Abstract
Purpose
To examine the influence of irradiation methods on the long-term results of contact transscleral Nd:YAG laser cyclophotocoagulation and to evaluate the factors that affect changes in intraocular pressure (IOP) and occurrence of ocular hypotony after cyclophotocoagulation.
Methods
In this retrospective study, 36 refractory glaucomatous eyes of 36 patients were observed for at least one year after a cyclophotocoagulation procedure. Contact transscleral Nd:YAG laser cyclophotocoagulation was performed with 7 to 10 Watts of power, a duration of 0.7 seconds, with one or two rows, and ranges of either greater or less than 180 degrees. The change in IOP, the success rate of the procedure, and the occurrence rate of hypotony were analyzed with regard to the methods of cyclophotocoagulation.
Results
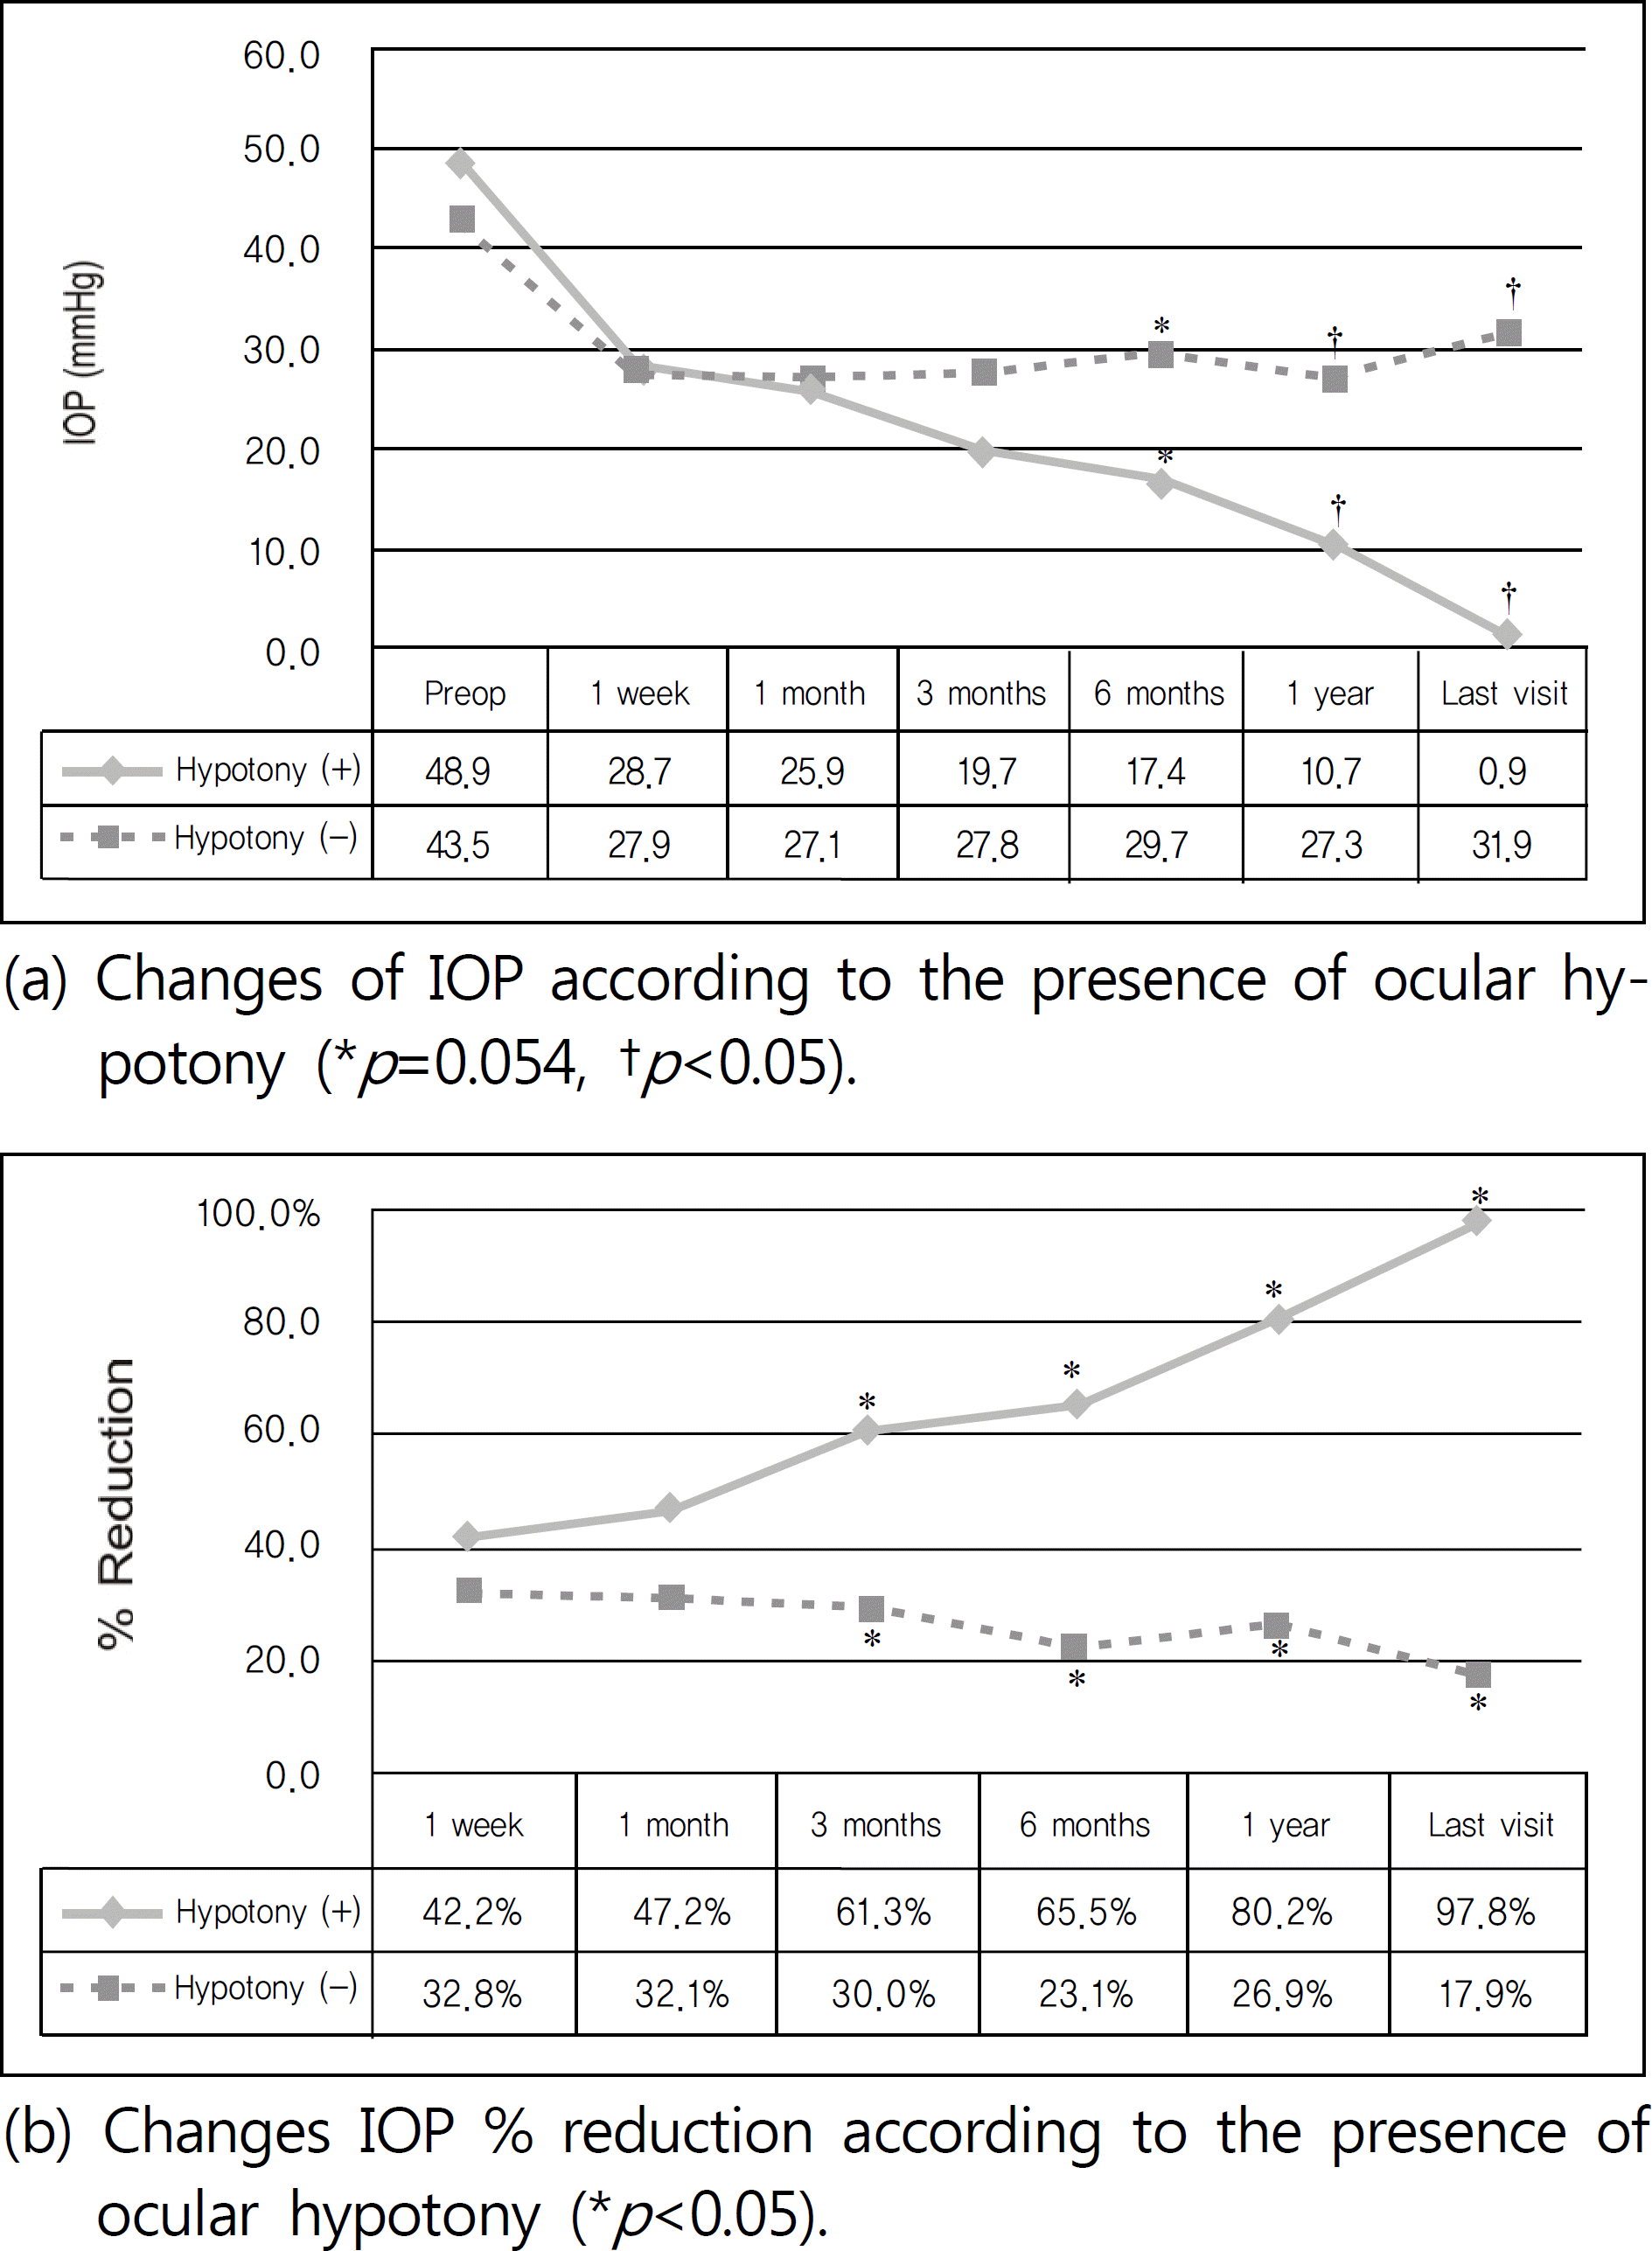
In this series of patients with refractory glaucoma, the final IOP and success rate were not significantly influenced by the laser application method or by the total energy used. The eyes with ocular hypotony showed significantly decreased IOP one year after cyclophotocoagulation when compared with eyes without ocular hypotony. The IOP percent reduction in the patients with ocular hypotony tended to decrease more rapidly than did that of the patients without hypotony, beginning three months after the operation.
Go to : 
References
1. Stamper RL, Liebermann MF, Drake MV. Becker-Shaffer's Diagnosis and Therapy of the Glaucomas. 8th ed.Mosby;2009.
2. Allingham RR. Shields' Textbook of Glaucoma. 5th ed.Lippincott Williams & Wilkins;2005.
3. Dickens CJ, Nguyen N, Mora JS, et al. Long-term results of non-contact transscleral neodymium: YAG cyclophotocoagulation. Ophthalmology. 1995; 102:1777–81.

4. Delgado MF, Dickens CJ, Iwach AG, et al. Long-term results of non-contact neodymium:yttrium-aluminum-garnet cyclophotocoagulation in neovascular glaucoma. Ophthalmology. 2003; 110:895–9.
5. Shields MB, Shields S. Noncontact transscleral Nd:YAG cyclophotocoagulation: a long-Term follow-up of 500 patients. Trans Am Ophthalmol Soc. 1994; 92:271–87.
6. Lin SC. Endoscopic and transscleral cyclophotocoagulation for the treatment of refractory glaucoma. J Glaucoma. 2008; 17:238–47.

7. Jin SM, Chung DY. The Effect of Contact Transscleral Nd:YAG Laser Cyclophotocoagulation in Refractory Glaucoma. J Korean Ophthalmol Soc. 2000; 41:958–64.
8. Kim JB, Yang KJ. Clinical Study of Contact Transscleral Nd:YAG Laser Cyclophotocoagulation. J Korean Ophthalmol Soc. 1994; 35:1195–201.
9. Pastor SA, Singh K, Lee DA, et al. Cyclophotocoagulation: a report by the American Academy of Ophthalmology. Ophthalmology. 2001; 108:2130–8.

10. Lin P, Wollstein G, Schuman JS. Contact transscleral neodymium: yttrium- aluminum-garnet laser cyclophotocoagulation: Long-term outcome. Ophthalmology. 2004; 111:2137–43.
11. Shields MB, Wilkerson MH, Echelman DA. A comparison of two energy levels for noncontact transscleral neodymium-YAG cyclophotocoagulation. Arch Ophthalmol. 1993; 111:484–7.

Go to : 
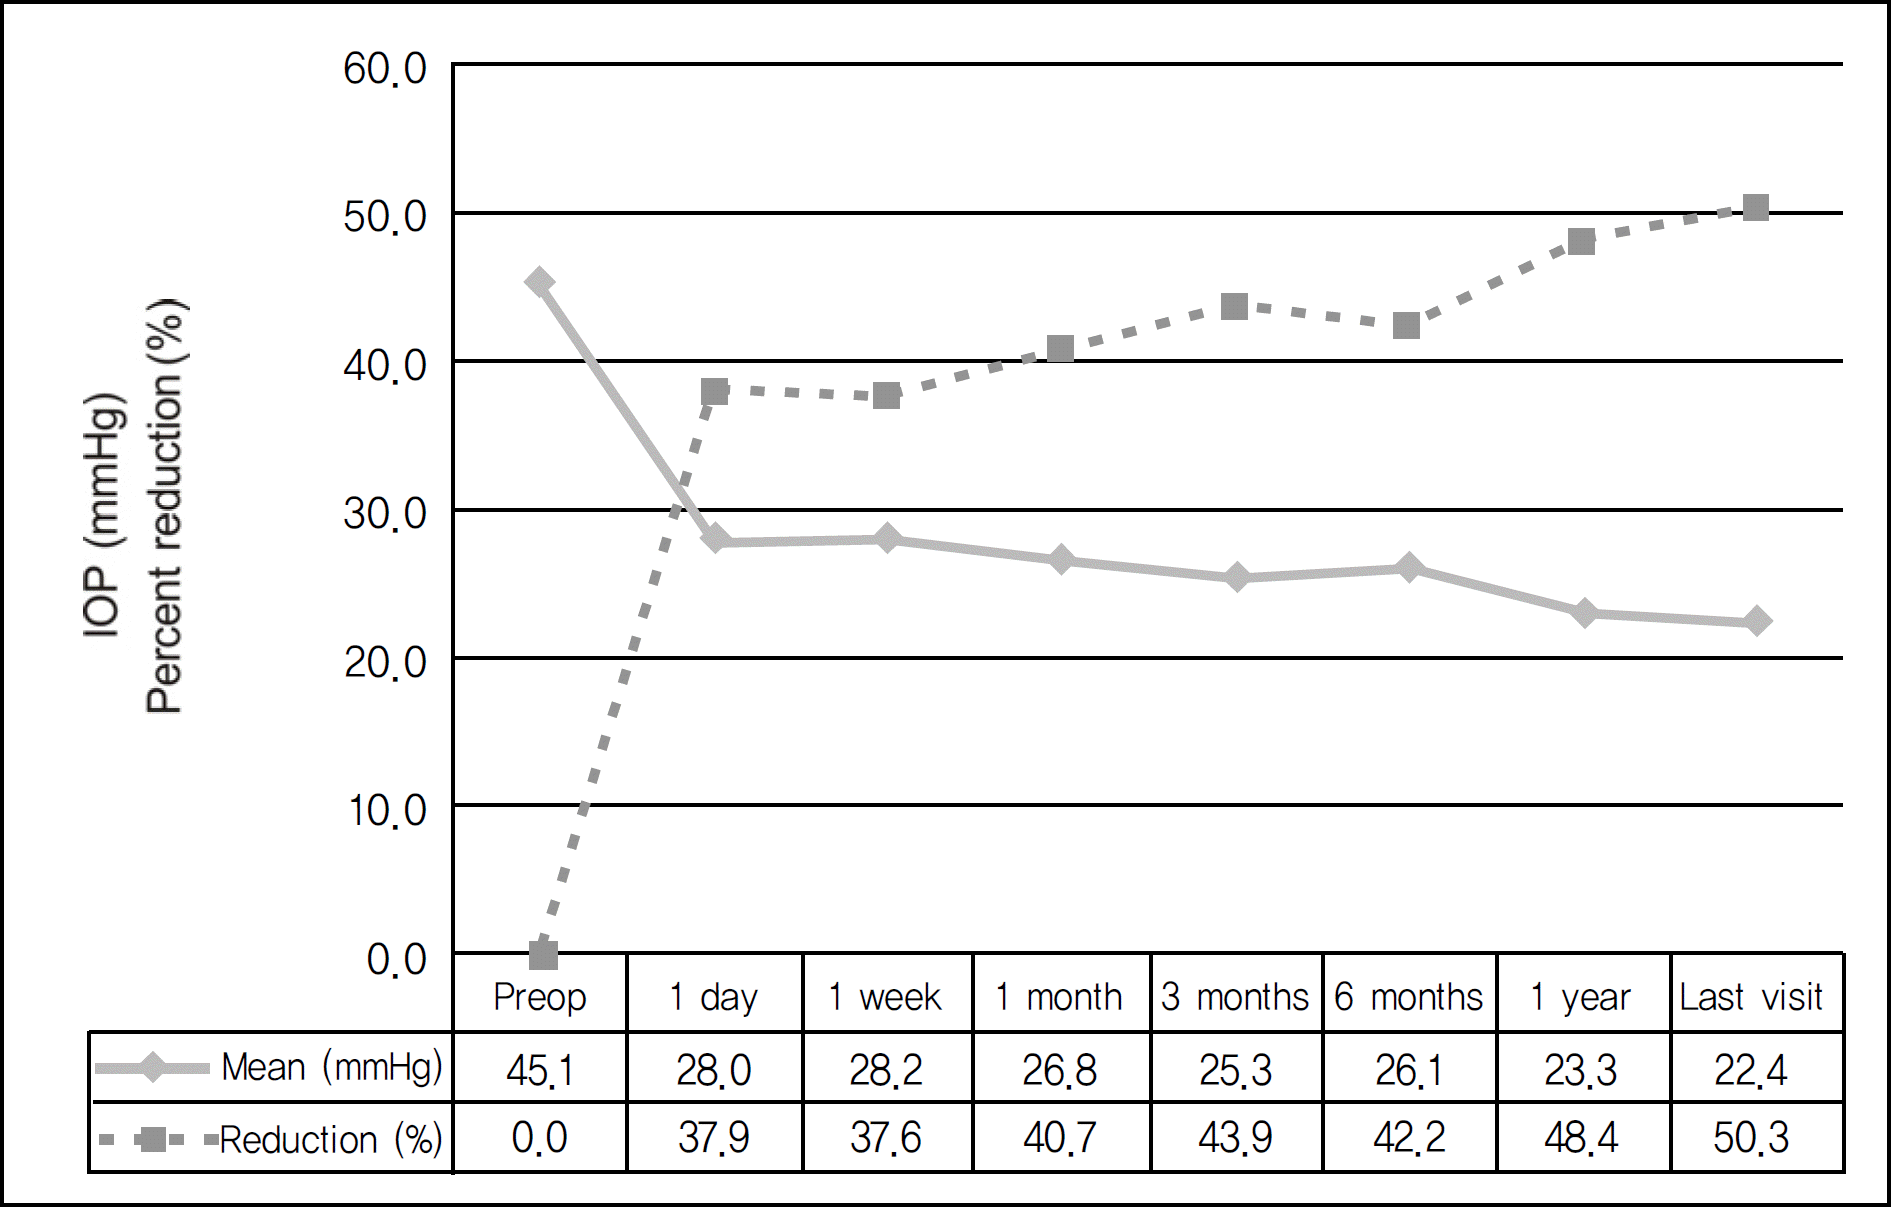
 | Figure 1.Changes in intraocular pressure (IOP) and percent IOP reduction from preoperative IOP. The difference of all postoperative intraocular pressure is statistically significant when compared with the pre-operative intraocular pressure (p<0.05). |
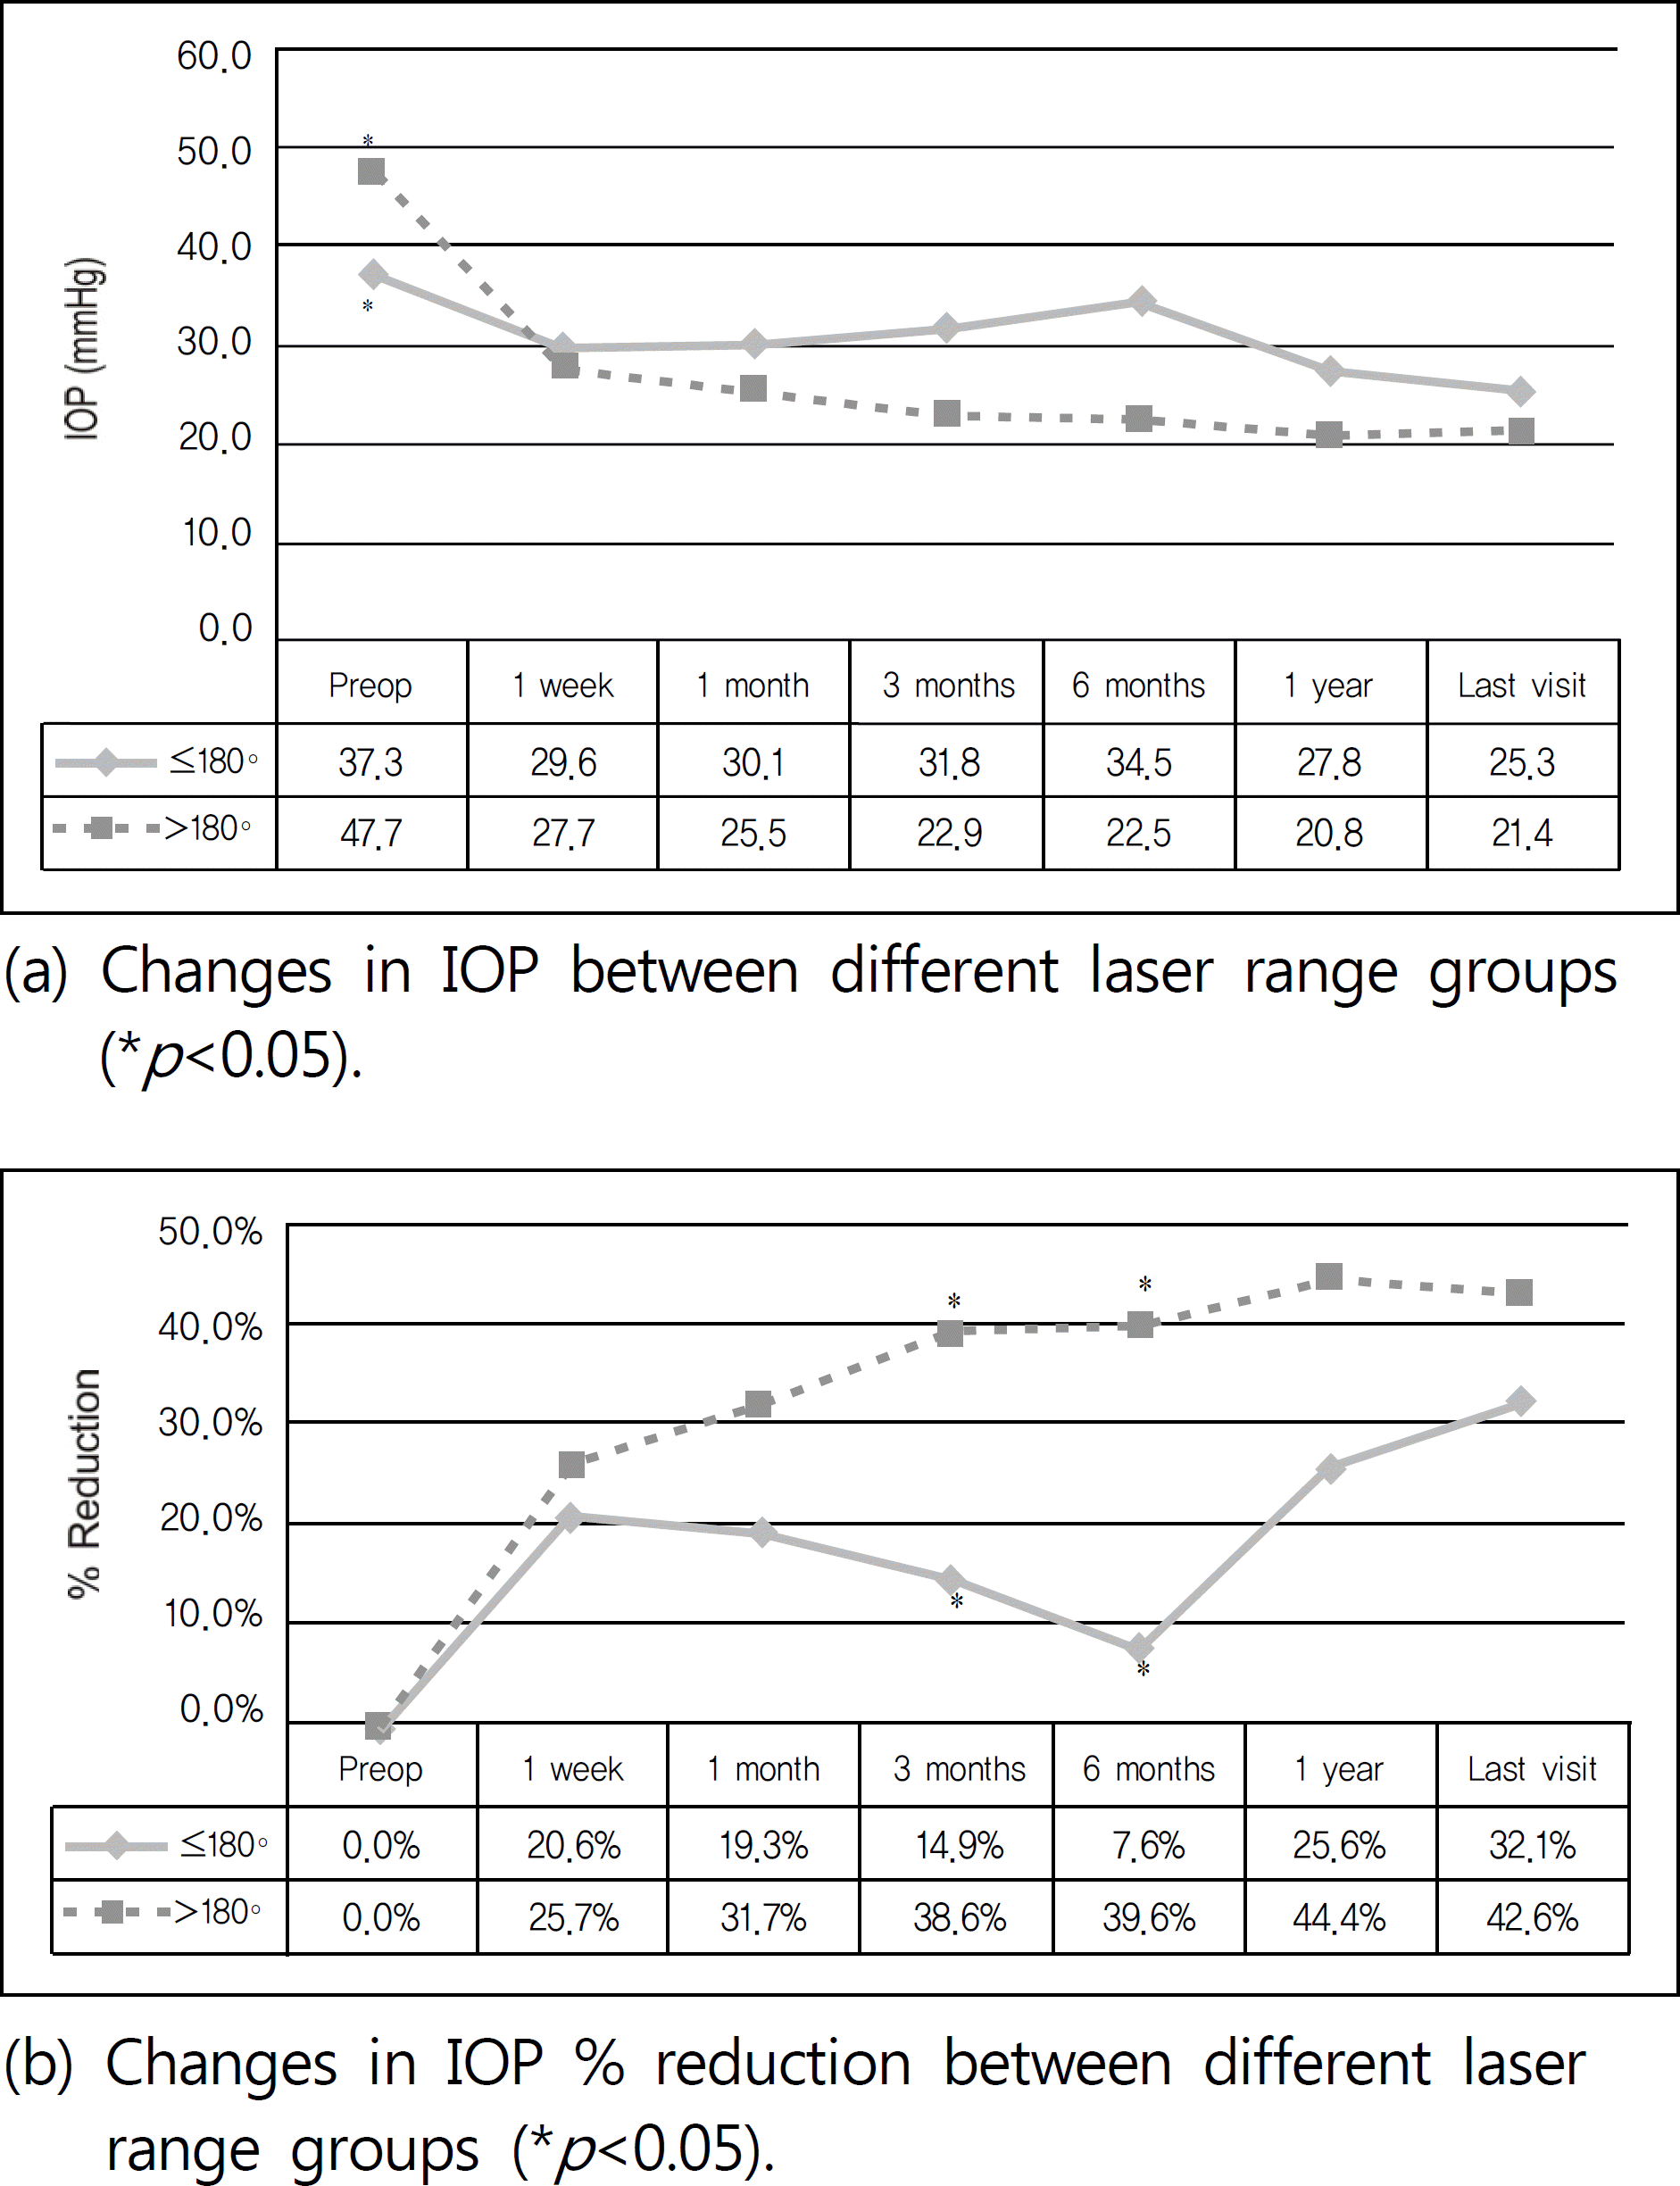
 | Figure 2.Changes in IOP and % reduction according to the range of laser performed. There was statistically significant difference between different laser range groups at preoperative time (a), and significant difference in IOP % reduction at 3, 6 months between different laser range groups (b). |
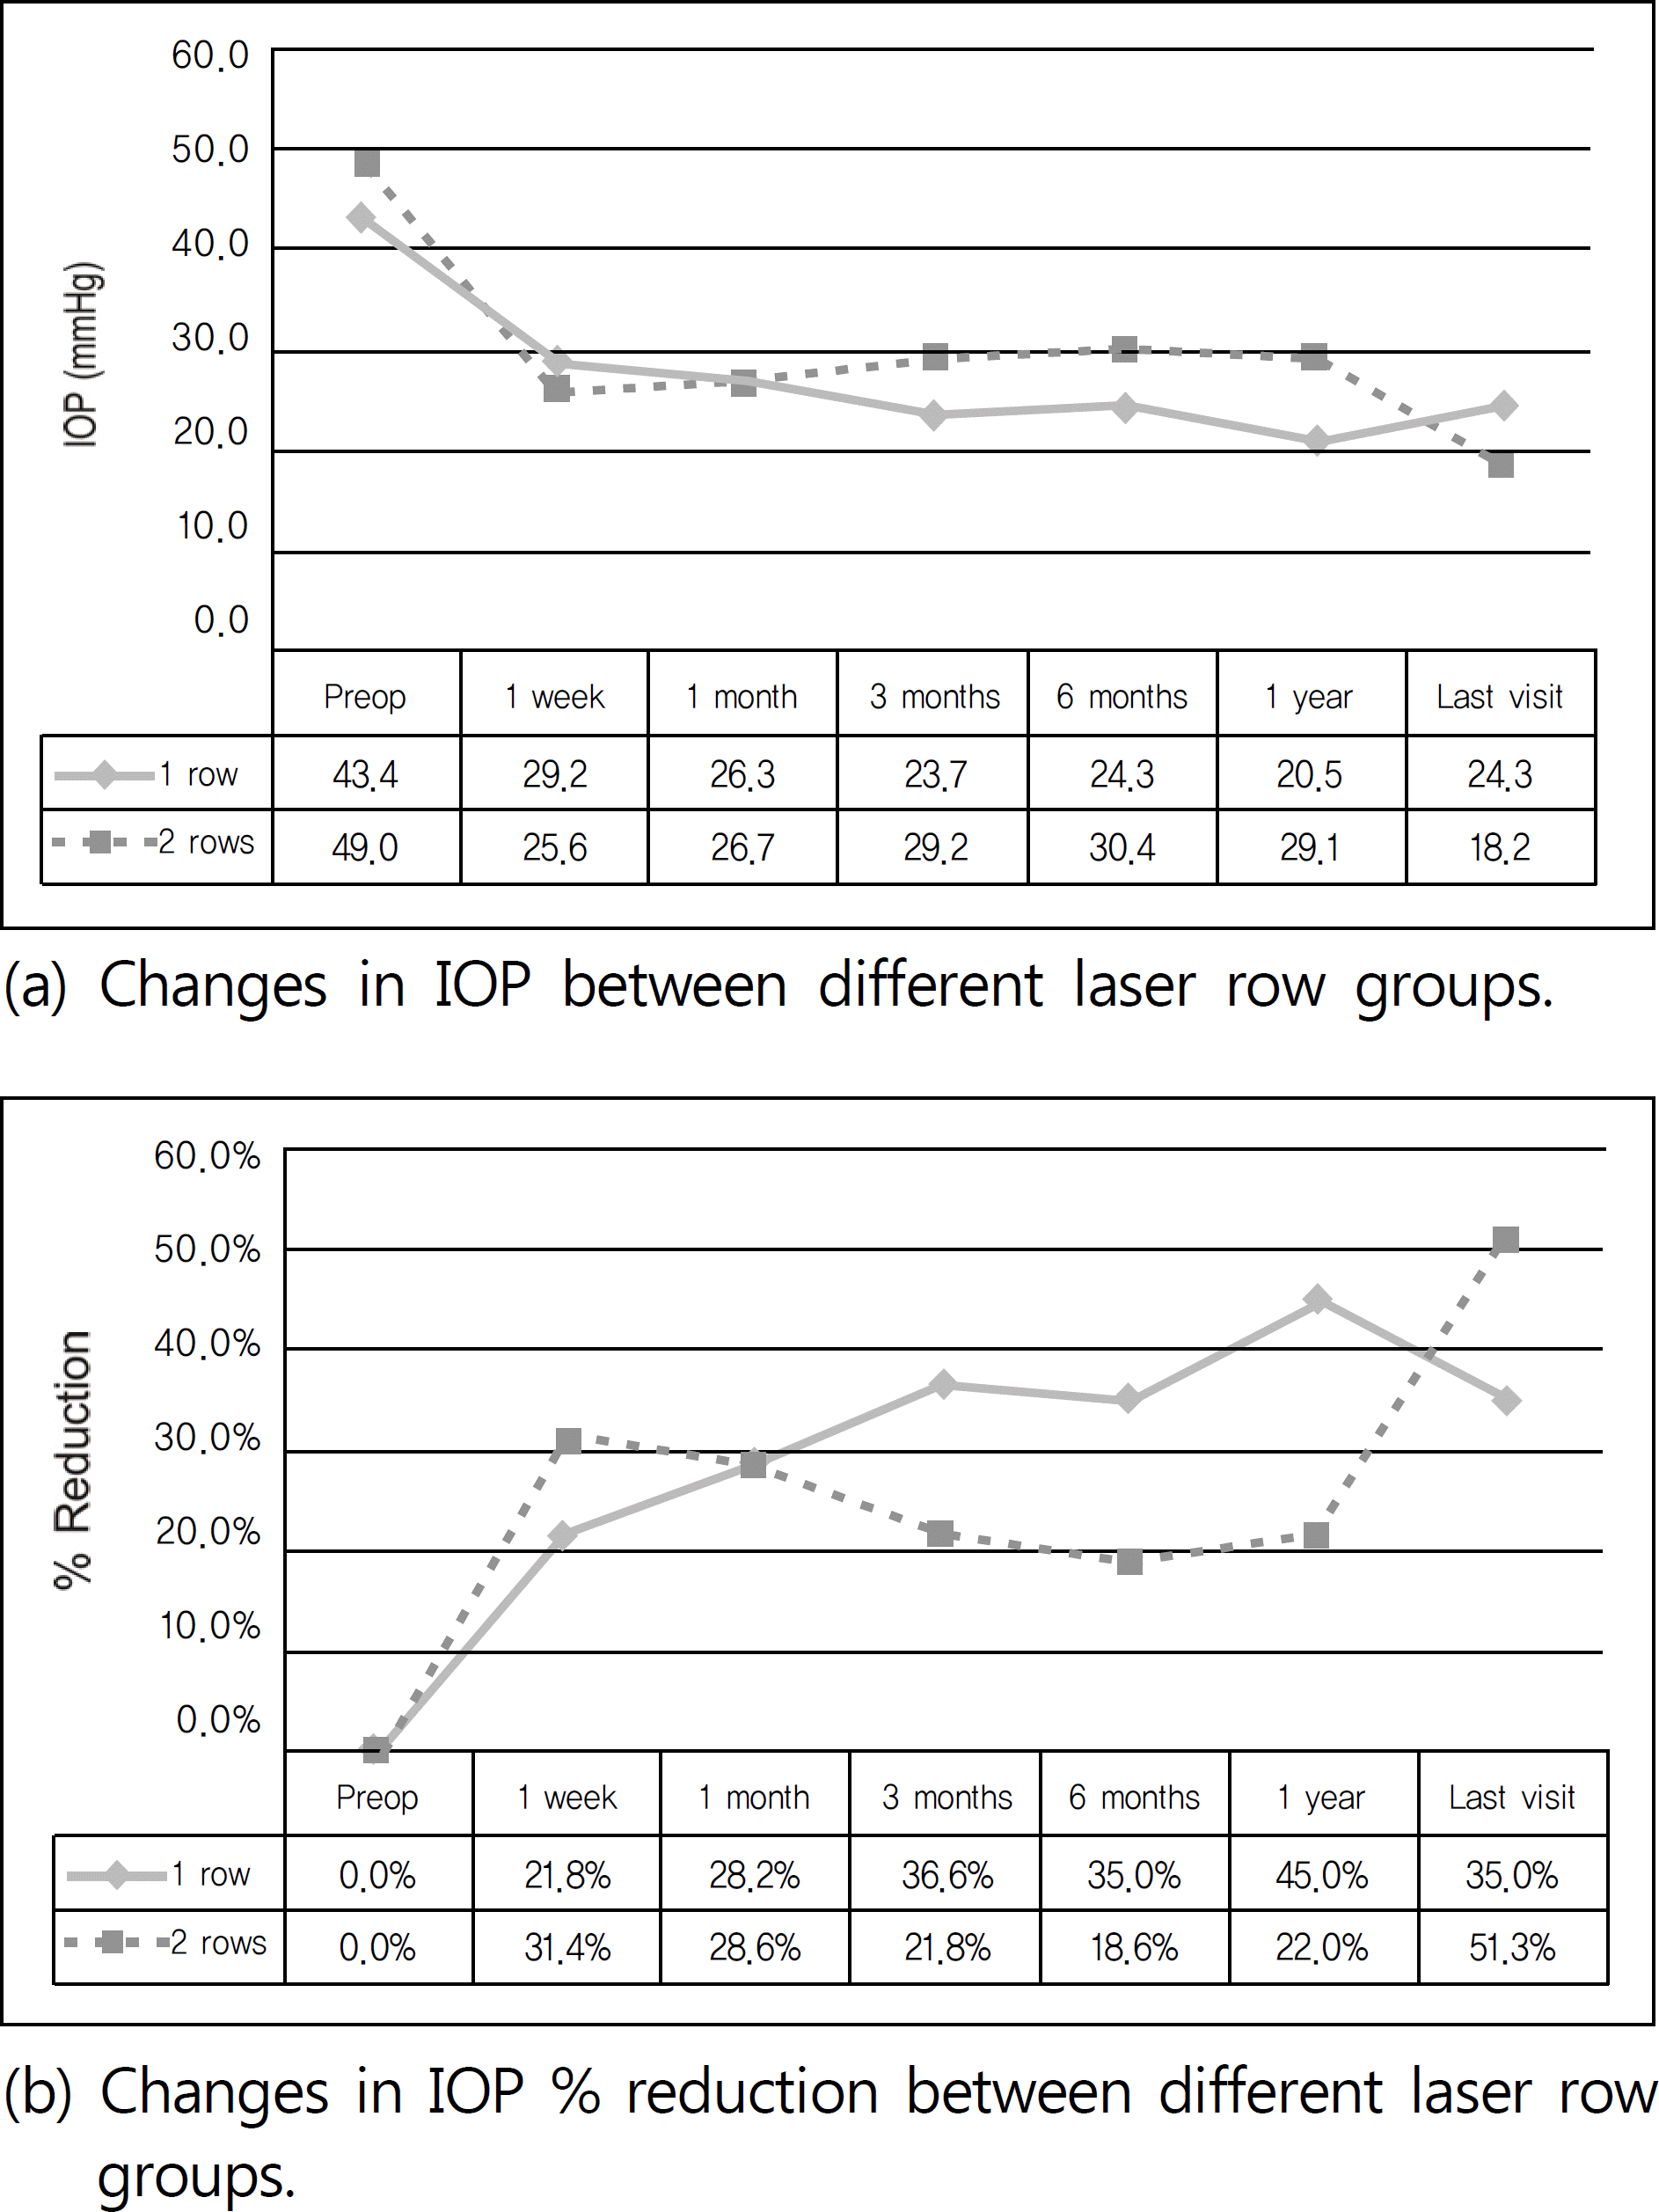
 | Figure 3.Changes in IOP and % reduction according to row of laser performed. There was no significant difference between different laser row groups in IOP (a) and IOP % reduction (b). |
 | Figure 4.IOP changes and % reduction between groups with or without ocular hypotony. Intraocular pressures became statistically different between 2 groups after 1 year (a). The percent reduction of IOP was significantly higher from 3 months after the procedure in the eyes with hypotony (b). |
Table 1.
Baseline characteristics of the study population
Table 2.
Demographic findings according to range and rows of laser performed
Table 3.
Postoperative changes of success rate and energy used
| 1 month | 3 months | 6 months | 1 year | Last visit | Energy used | ||
|---|---|---|---|---|---|---|---|
| Overall |
63.6% (21/33) |
51.5% (17/33) |
55.6% (15/27) |
52.0% (13/25) |
30.6% (11/36) |
228.7±95.7 J | |
|
Range of laser performed |
≤180° |
44.4% (4/9) |
33.3% (3/9) |
25.0% (2/8) |
33.3% (3/9) |
33.3% (3/9) |
159.8±62.5 J* |
| >180° |
70.8% (17/24) |
58.3% (14/24) |
68.4% (13/19) |
62.5% (10/16) |
29.6% (8/27) |
251.7±94.6 J* | |
| Rows of laser performed | 1 row |
62.5% (15/24) |
60.9% (14/23) |
57.9% (11/19) |
52.9% (9/17) |
28.0% (7/25) |
225.6±103.7 J |
| 2 rows |
66.7% (6/9) |
30.0% (3/10) |
50.0% (4/8) |
50.0% (4/8) |
36.4% (4/11) |
235.8±78.8 J |
Table 4.
Analyses of the factors that can affect the occurrence rate of ocular hypotony


 PDF
PDF ePub
ePub Citation
 Print
Print


 XML Download