Abstract
Purpose
To evaluate the incidence and progression of macular edema (ME) and associated risk factors in diabetic patients. Methods: In a prospective study, 66 eyes were assessed by optical coherence tomography (OCT) and best-corrected visual acuity was checked before operation at one and three months after operation. ME was defined as an increase of central macular thickness (CMT) by 30% or more after surgery than before operation, as measured by OCT.
Results
The incidence of ME in diabetic patients was 8.8%. The increment of CMT at three months after cataract surgery was statistically significant in the patients of diabetic duration≥10years (p=0.049). But insulin treatment, the severity of diabetic retinopathy, diabetic nephropathy and hemoglobin A1C were not significant risk factors for ME.
Go to : 
References
1. Dowler JG, Hykin PG, Lightman SL, Hamilton AM. Visual abdominal following extracapsular cataract extraction in diabetes: a metaanalysis. Eye. 1995; 9:313–7.
2. Zaczek A, Olivestedt G, Zetterstrom C. Visual outcome after abdominal and IOL implantation in diabetic patients. Br J Ophthalmol. 1999; 83:1036–41.
3. Cunliffe IA, Flanagan DW, George ND, et al. Extracapsular abdominal surgery with lens implantation in diabetics with and without proliferative retinopathy. Br J Ophthalmol. 1991; 75:9–12.
4. Pollack A, Dotan S, Oliver M. Progression of diabetic retinopathy after cataract extraction. Br J Ophthalmol. 1991; 75:547–51.

5. Henricsson M, Heijl A, Janzon L. Diabetic retinopathy before and after cataract surgery. Br J Ophthalmol. 1996; 80:789–93.

6. Kato S, Fukada Y, Hori S, et al. Influence of phacoemulsification and intraocular lens implantation on the course of diabetic retinopathy. J Cataract Refract Surg. 1999; 25:788–93.

7. Johnson RN, Howard SH, McDonald R, et al. Fluorescein abdominalgraphy: basic principles and interpretation. Ryan SJ, editor. Retina. revised ed.St. Louis: Mosby;2001. 2:chap. 55.
8. Flesner P, Sander B, Henning V, et al. Cataract surgery on diabetic patients: a prospective evaluation of risk factors and complications. Acta Ophthalmol Scand. 2002; 80:19–24.

9. Hayashi K, Igarashi C, Hirata A, et al. Changes in diabetic abdominal oedema after phacoemulsification surgery. Eye. 2009; 23:389–96.
10. Kim SJ, Equi R, Bressler NM. Analysis of macular edema after abdominal surgery in patients with diabetes using optical coherence tomography. Ophthalmology. 2007; 114:881–89.
11. Early Treatment Diabetic Retinopathy Study Research Group. Photocoagulation for diabetic macular edema: Early Treatment Diabetic Retinopathy Study report number 1. Arch Ophthalmol. 1985; 103:1796–806.
12. Hee MR, Puliafito CA, Wong C, et al. Quantitative assessmentof macular edema with optical coherence tomography. Arch Ophthalmol. 1995; 113:1019–29.
13. Goebel W, Kretzchmar-Gross T. Retinal thickness in diabetic abdominal: a study using optical coherence tomography (OCT). Retina. 2002; 22:759–67.
14. Chen CH, Liu YC, Wu PC. The combination of intravitreal abdominal and phacoemulsification surgery in patients with abdominal and coexisting diabetic macular edema. J Ocul Pharmacol Ther. 2009; 25:83–9.
15. Cardillo J, Melo LA Jr, Costa RA, et al. Comparison of abdominal versus posterior abdominal's capsule injection of triamcinolone acetonide for diffuse diabetic macular edema. Ophthalmology. 2005; 112:1557–63.
16. Larsson J, Zhu M, Sutter F, Gillies MC. Relation between reduction of foveal thickness and visual acuity in diabetic macular abdominal treated with intravitreal triamcinolone. Am J Ophthalmol. 2005; 139:802–6.
Go to : 
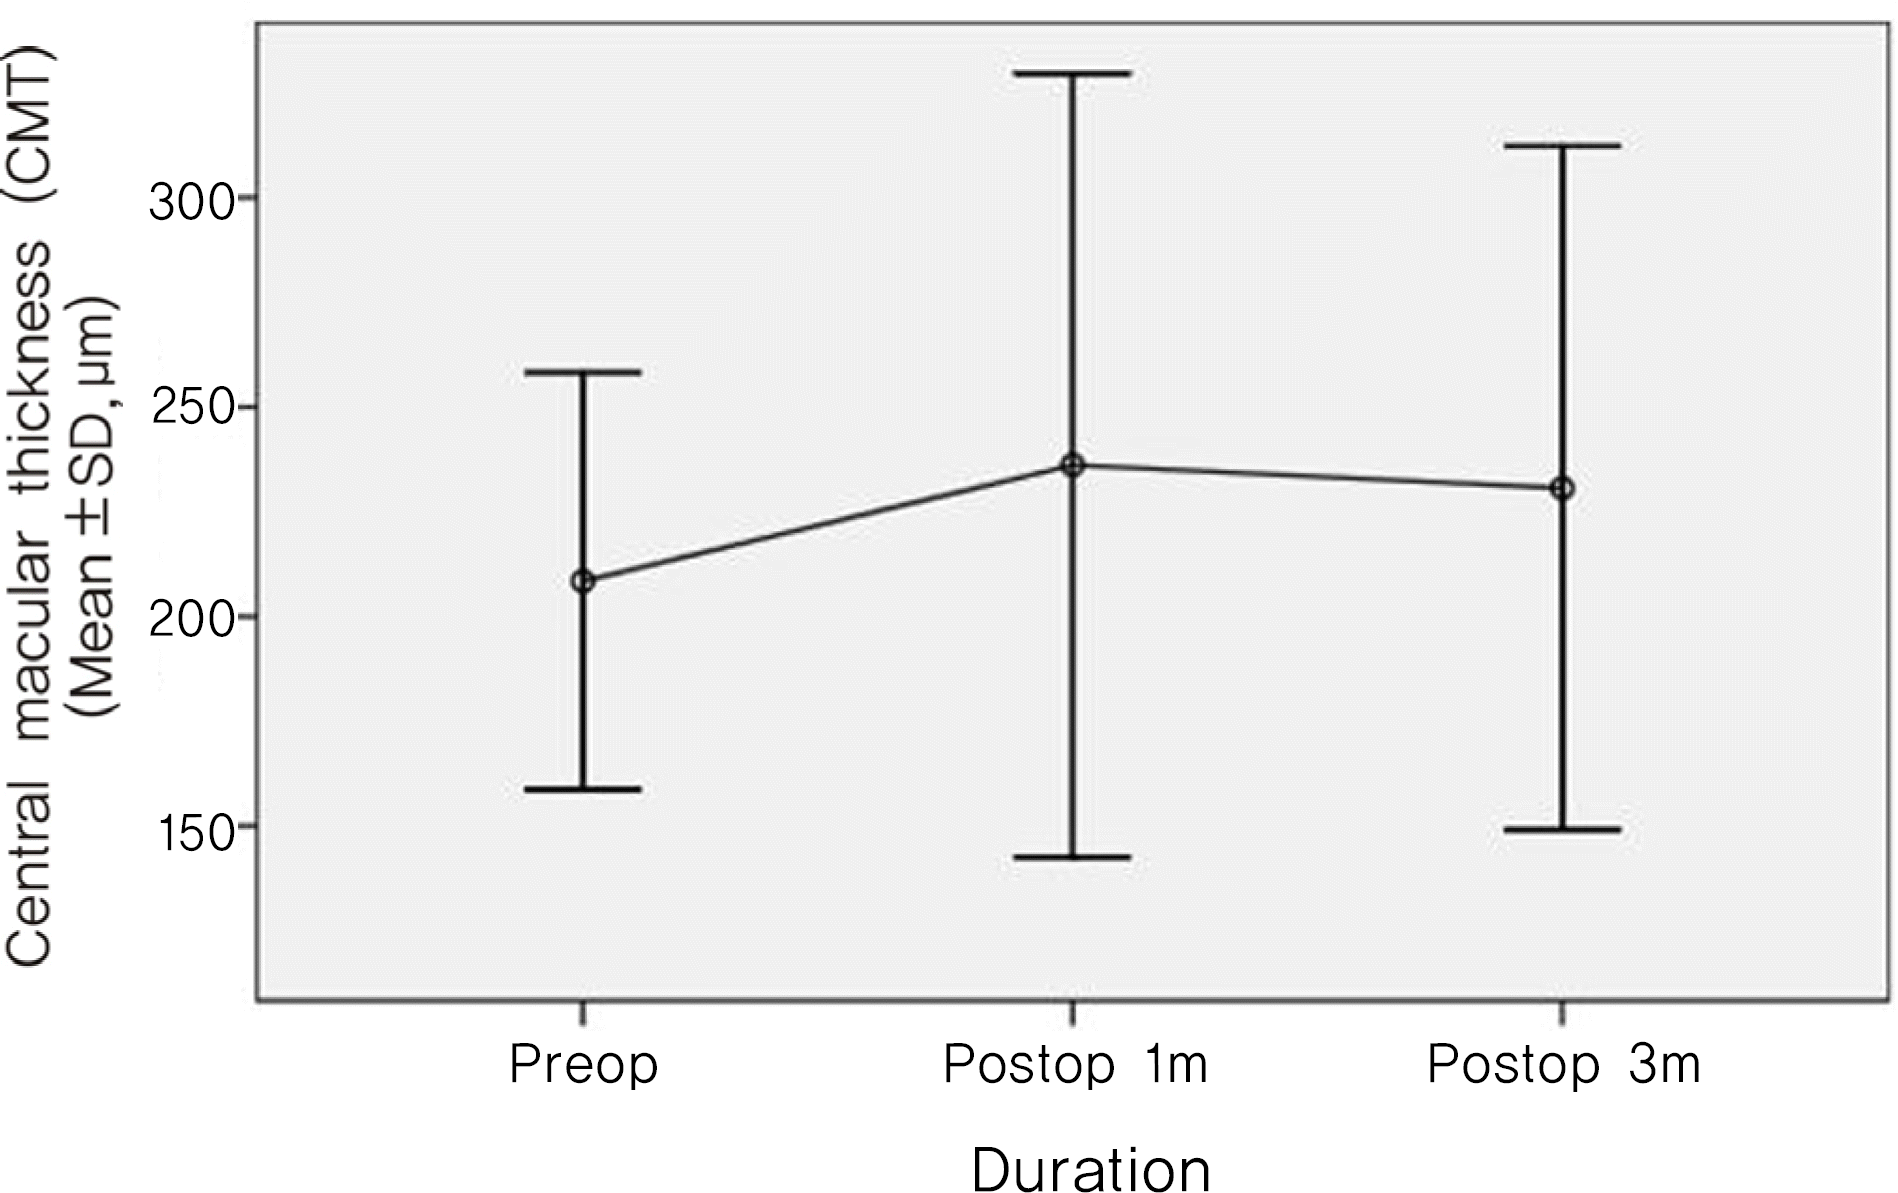
 | Figure 1.Mean central macular thickness of study eyes at 1 and 3 months preoperatively after cataract surgery. |
 | Figure 2.Representative range of cystoids abnormalities of study eyes with macular edema. (A) Preoperative optical coherence tomography (OCT). (B) Post-operative 1 month OCT. (C) Post-operative 3 months OCT. |
Table 1.
Characteristics of patients with diabetes received cataract operation
| Variable | Data |
|---|---|
| Age (years) | |
| Mean± SD* | 65.3±12.6 |
| Range | 15∼83 |
| Sex (%) | |
| Male | 26(39.4%) |
| Female | 40(60.6%) |
| Preoperative BCVA† (LogMAR‡, mean± SD*) | 0.61±0.43 |
| Preoperative central macular thickness (µm, mean± SD*) | 206.38±48.77 |
| Hemoglobin A1 C (%, mean± SD*) | 7.3±1.3 |
| Duration of diabetes (years, mean± SD*) | 11.6±8.7 |
| Treatment (number, %) | |
| Insulin | 18(27.3%) |
| Oral hypoglycemic agents | 48(72.7%) |
| Presence of nephropathy | 21(31.8%) |
| Level of Diabetic Retinopathy (number, %) | |
| No diabetic retinopathy | 41(62.1%) |
| Nonproliferative diabetic retinopathy | 28(42.4%) |
| Proliferative diabetic retinopathy | 7(10.5%) |
Table 2.
Clinical characteristics of patients with postoperative macular edema
| Patient No. | Sex/Age, (years) | HbA1C level (%) | DM duration, (years) | Insulin treatment | Severerity of diabetic retinopathy | Blood creatinine evel, mg/dl | BCVA* (LogMAR†) | Macular thicknes, μm | ||||
|---|---|---|---|---|---|---|---|---|---|---|---|---|
| Preop | Postop | Preop | Postop | |||||||||
| 1 m | 3 m | 1 m | 3 m | |||||||||
| 1 | M/77 | 8.3 | 20 | Yes | Severe NPDR‡ | 1.07 | 0.39 | 0.20 | 0.20 | 241 | 516 | 357 |
| 2 | M/77 | 8.3 | 20 | Yes | Severe NPDR‡ | 1.07 | 0.49 | 0.39 | 0.30 | 230 | 573 | 429 |
| 3 | M/78 | 7.3 | 30 | Yes | PDR§ | 1.38 | 1.69 | 0.39 | 0.30 | 137 | 237 | 227 |
| 4 | M/75 | 10.2 | 1 | No | No DMR∏ | 0.98 | 1.22 | 0 | 0 | 154 | 239 | 233 |
| 5 | M/74 | 6.4 | 4 | No | No DMR∏ | 0.76 | 0.30 | 0 | 0 | 198 | 295 | 282 |
| 6 | F/65 | 6.8 | 5 | No | No DMR∏ | 0.88 | 1.69 | 0.20 | 0 | 169 | 237 | 235 |
Table 3.
Increased central macular thickness after cataract operation
Table 4.
Changes of best corrected visual acuity


 PDF
PDF ePub
ePub Citation
 Print
Print


 XML Download