Journal List > J Korean Ophthalmol Soc > v.51(3) > 1008749

Lee, Park, and Shin: Comparison of Keratometric Values Measured by the Handheld Autokeratometer, On-table Autokeratometer and Manual Keratometer

Abstract

Purpose

To compare the keratometry measurements by the handheld Nikon Retinomax K-plus2, the on-table Canon RK-5 autokeratometer, and the manual Topcon OM-4 keratometer and to evaluate the degree of agreement among the three instruments.

Methods

Adults (n=30) and children (n=40) presenting toa tertiary eye hospital clinic were examined by an optometrist. Topcon OM-4 keratometer, Nikon Retinomax and the on-table Canon RK-5 autokeratometer analyses were performed in order. The horizontal and vertical keratometry data were measured. The vector components of astigmatism, mean bias and agreement among the three types of measurements were evaluated.

Results

There were no significant differences among the three keratometers in horizontal or vertical keratometry or in central corneal astigmatism in both the adult and child groups (p-value>0.05). The keratometers which were estimated with Retinomax K-plus2 were highly correlated with those by on-table RK-5 autokeratometer (min. 0.89, max. 0.97) and Topcon OM-4 keratometer (min. 0.67, max. 0.94) in the adult group, while in the child group, the three instruments showed slightly decreased correlation (min. 0.45, max. 0.97 on RK-5, min. 0.36, max. 0.92 on OM-4), especially in the left eyes.

Conclusions

The handheld Retinomax K-plus2 provided comparable data to that of the conventional on-table Topcon and manual keratometers. This instrument will beuseful in the clinic to measure keratometry in children or immobilized patients who have difficulty sitting during the examination.

References

1. Lloyd IC, Goss-Sampson M, Jeffrey BG, et al. Neonatal cataract: aetiology, pathogenesis, and management. Eye. 1992; 6:184–96.
crossref
2. Cho CW, Kim SJ, Park YG. The utility of hand held autorefractometer for refraction in children. J Korean Ophthalmol Soc. 1997; 38:1044–9.
3. La TY, Oh JR. Reliability of Refractive Measurement by Hand-held Autorefractor. J Korean Ophthalmol Soc. 2002; 43:2241–5.
4. Kim M, Choi YS, Lu WN, et al. The developement of an objective test for visual acuity assessment using optokinetic nystagmus stimuli presented head – mounted display: Seohan objective visual acuity test. J Korean Ophthalmol Soc. 2000; 41:871–8.
5. Noonan CP, Raop GP, Kaye SB, et al. Validation of a handheld automated keratometer in adults. J Cataract Refract Surg. 1998; 24:411–44.
crossref
6. Manning CA, Kloess PM. Comparison of portable automated keratometry and manual keratometry for IOL calculation. J Cataract Refract Surg. 1997; 23:1213–6.
crossref
7. Sunderraj P. Clinical comparison of automated and manual keratometry in preoperative ocular biometry. Eye. 1992; 6:60–2.
crossref
8. Liang CL, Hung KS, Park N, et al. Comparison of the handheld Retinomax K-Plus2 and on-table autokeratometers in children with and without cycloplegia. J Cataract Refract Surg. 2004; 30:669–74.
crossref
9. Farook M, Venkatramani J, Gazzard G, et al. Comparisons of the Handheld Autorefractor, Table-Mounted Autorefractor, and Subjective Refraction in Singapore Adults. Optom Vis Sci. 2005; 82:1066–70.
crossref
10. Cordonnier M, De Maertelaer V. Comparison between two hand-held autorefractors: the Sure-Sight and the Retinomax. Strabismus. 2004; 12:261–74.
crossref
11. Lam AK, Chan R, Chiu R. Effect of instrument rotation on handheld keratometry. J Cataract Refract Surg. 2004; 30:2590–4.
crossref

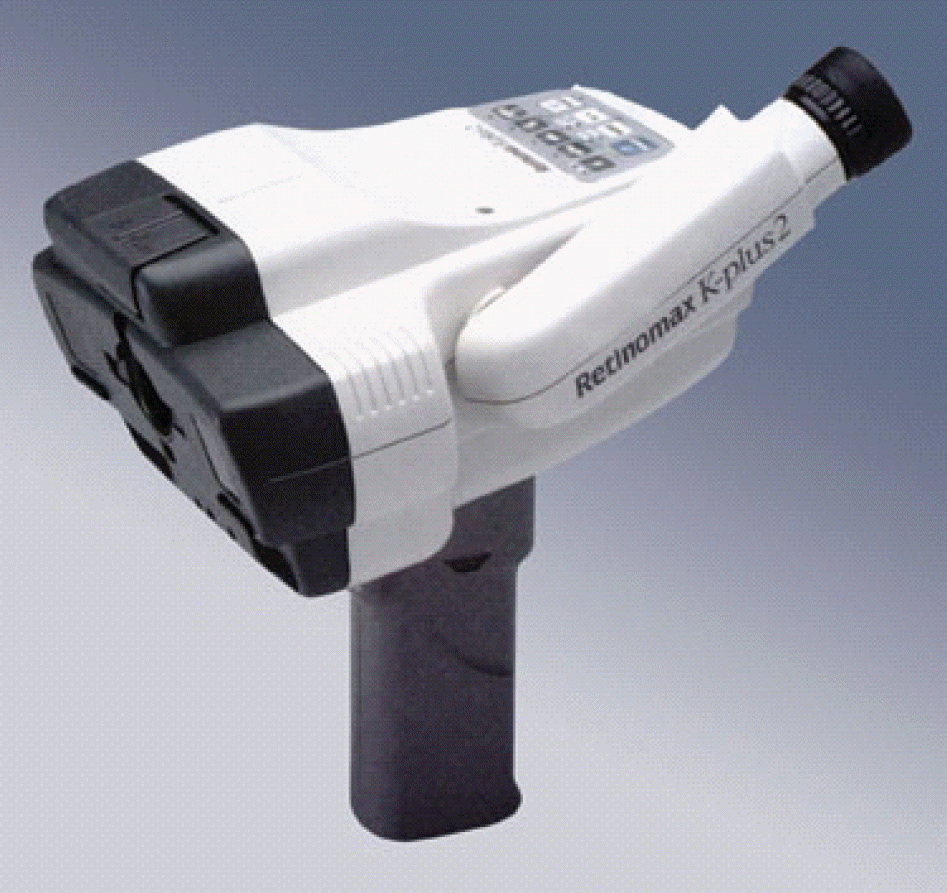
Figure 1.
Composition of Retimax K-plus2.
jkos-51-328f1.tif
Table 1.
Mean, mean difference, and 95% LoA between 2 measurements by the retinomax K-plus and canon RK-5 (mean difference=data by the RK-5 minus data by retinomax
Keratometer Horizontal
Vertical
Astigmatism
Right
Left
Right
Left
Right
Left
Child Adult Child Adult Child Adult Child Adult Child Adult Child Adult
Retinomax 43.10±1.87 42.62±1.26 42.14±6.95 42.60±1.26 44.38±2.11 43.27±1.12 44.32±2.77 43.26±1.16 1.28±0.70 0.65±0.98 2.18±5.00 0.66±1.09
Canon RK-5 43.04±1.76 42.72±1.32 43.02±1.73 42.24±1,27 44.48±2.14 43.40±1.01 44.68±2.13 43.03±1,48 1.34±0.79 0.68±1.23 1.66±0.89 0.79±1.38
Mean difference –0.06±0.26 0.088±0.56 0.88±6.76 –0.36±0.39 0.10±0.44 0.13±0.27 0.36±1.58 –0.22±0.54 0.06±0.46 0.037±0.57 –0.52±5.20 0.13±0.59
95% LoA –0.14∼0.02 –0.12–0.30 –1.08∼3.04 –0.50∼−0.21 –0.04∼0.24 0.025–0.23 –0.15∼0.86 –0.43∼−0.02 –0.09∼0.21 –0.18–0.25 –1.18∼1.14 –0.087∼0.35
Correlation 0.97 0.91 0.48 0.95 0.97 0.97 0.62 0.94 0.81 0.89 0.45 0.91
Paired t-test 0.47 0.37 0.11 0.42 0.53 0. 46 0.26 0.62 0.38 0.32 0.09 0.53
Table 2.
Mean, mean difference, and 95% LoA between 2 measurements by the retinomax K-plus and topcon OM-4 (mean difference=data by the OM-4 minus data by retinomax)
Keratometer Horizontal
Vertical
Astigmatism
Right
Left
Right
Left
Right
Left
Child Adult Child Adult Child Adult Child Adult Child Adult Child Adult
Retinomax 43.10±1.87 42.63±1.26 42.14±6.95 42.60±1.26 44.38±2.11 43.27±1.12 44.32±2.77 43.26±1.16 1.28±0.70 0.65±0.98 2.18±5.00 0.66±1.09
Topcon OM-4 43.24±1.73 42.38±1.12. 43.06±1.69 42.49±1.16 44.41±2.05 43.29±0.93 44.49±2.14 43.29±1.24 1.17±0.92 0.91±0.86 1.43±1.03 1.00±0.88
Mean difference 0.13±0.49 –0.25±0.68 0.92±6.67 –0.11±0.49 0.027±0.33 0.017±0,60 0.17±1.90 0.036±0.62 –0.11±0.57 0.26±1.00 –0.75±5.03 0.34±1.00
95% LoA –0.021∼0.29 –0.50∼0.009 –1.21∼2.05 –0.29∼−0.22 –0.079∼0.13 –0.21∼0.24 –0.44∼0.78 –0.20∼0.27 –0.29∼0.076 –0.11∼0.64 –1.36∼0.46 0.030∼0.52
Correlation 0.82 0.84 0.46 0.93 0.92 0.94 0.73 0.86 0.78 0.84 0.36 0.67
Paired t-test 0.18 0.34 0.07 0.64 0.59 0.65 0.13 0.19 0.24 0.18 0.06 0.42
Table 3.
Mean, mean difference, and 95% LoA between 2 measurements by the topcon OM-4 and canon RK-5 (mean difference=data by the OM-4minus data by RK-5)
Keratometer Horizontal Vertical Astigmatism
Right Left Right Left Right Left
Child Adult Child Adult Child Adult Child Adult Child Adult Child Adult
Topcon OM-4 43.24±1.73 42.38±1.12. 43.06±1.69 42.49±1.16 44.41±2.05 43.29±0.93 44.49±2.14 43.29±1.24 1.17±0.92 0.91±0.86 1.43±1.03 1.00±0.88
Canon RK-5 43.04±1.76 42.72±1.32 43.02±1.73 42.24±1,27 44.48±2.14 43.40±1.01 44.68±2.13 43.03±1,48 1.34±0.79 0.68±1.23 1.66±0.89 0.79±1.38
Mean difference 0.20±0.42 –0.33±0.73 0.044±0.29 0.25±0.60 –0.07±0.37 –0.11±0.59 –0.18±0.92 0.26±0.83 –0.17±0.54 0.22±1.15 –0.23±0.91 0.21±1.21
95% LoA 0.07∼0.34 –0.51∼−0.061 –0.48∼0.11 –0.52∼0.17 –0.59∼−0.36 –0.33∼0.11 –0.48∼0.11 –0.050∼0.57 –1.14∼−0.80 –0.20∼0.45 –0.42∼0.062 –0.24∼0.46
Correlation 0.97 0.83 0.98 0.88 0.98 0.82 0.91 0.83 0.81 0.84 0.77 0.65
Paired t-test 0.59 0.48 0.62 0.47 0.54 0.52 0.51 0.39 0.31 0.44 0.12 0.10
TOOLS
Similar articles