Abstract
Methods
Forty patients with normal tension glaucoma and thirty healthy people were investigated with regard to hemoglobin, hematocrit, RBC count, WBC count, platelet count, fasting glucose, HbA1c, total cholesterol, triglycerides, LDL, HDL, and high-sensitivity C-reactive protein (hsCRP). Also, ET-1 and MCP-1 were measured using enzyme-linked immunosorbent assay kits.
Results
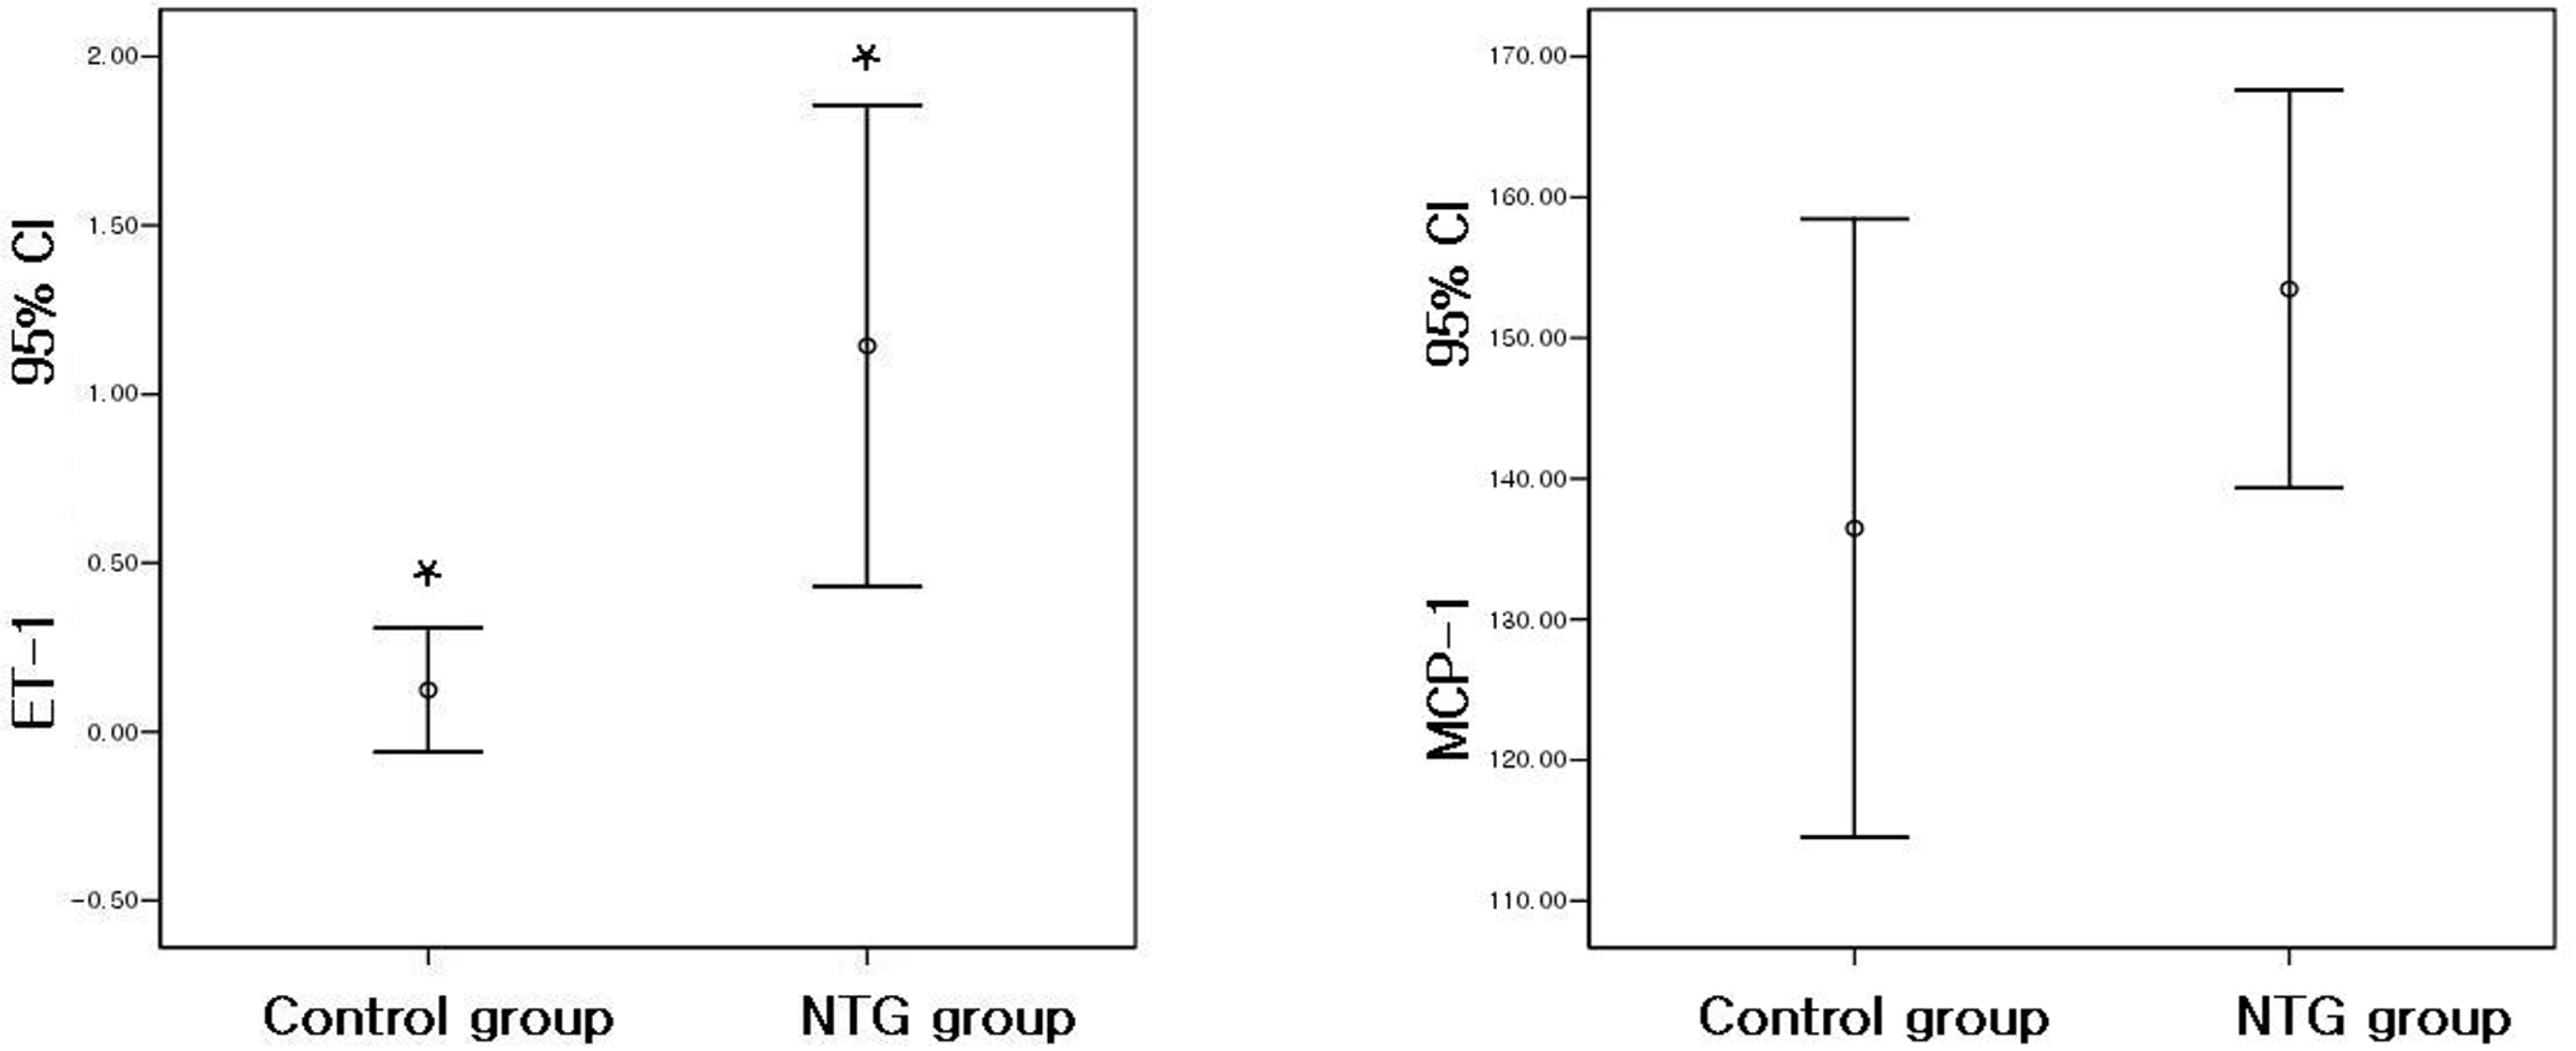
The results of the blood examinations showed no statistically significant differences in hemoglobin, hematocrit, RBC count, WBC count, platelet count, fasting glucose, HbA1c, total cholesterol, LDL, HDL, and hsCRP. Only triglycerides showed a statistically significant difference between the groups (P=0.03). The level of serum ET-1 was significantly higher in the normal tension glaucoma group (P=0.007). The results of MCP-1 showed no statistically significant difference.
Go to : 
References
1. Drance S, Sweeney V, Morgan R. Studies of factors involved in the production of low tension glaucoma. Arch Ophthalmol. 1973; 89:457–65.

2. Gasser P. Ocular vasospasm: A risk factor in the pathogenesis of low tension glaucoma. Int Ophthalmol. 1989; 13:281–90.
3. Rojanapongpun P, Drance SM. The response of blood flow velocity in the ophthalmic artery and blood flow of the finger to warm and cold stimuli in glaucomatous patients. Graefes Arch Clin Exp Ophthalmol. 1993; 231:375–7.

4. Sugiyama T, Moriya S, Oku H, Azuma I. Association of endothe-lin-1 with normal tension glaucoma: Clinical and fundamental studies. Surv Ophthalmol. 1995; 39:S49–56.

5. Henry E, Newby DE, Webb DJ, et al. Altered endothelin-1 vaso-reactivity in patients with untreated normal-pressure glaucoma. Invest Ophthalmol Vis Sci. 2006; 47:2528–32.

6. Lakoski SG, Cushman M, Palmas W, et al. The relationship between blood pressure and C-reactive protein in the multi-ethnic study of atherosclerosis (MESA). J Am Coll Cardiol. 2005; 46:1869–74.

7. Oh JW, Ahn MD, Park CK. Analysis of systemic risk factors in normal tension glaucoma. J Korean Ophthalmol Soc. 1999; 40:2239–44.
8. Flammer J, Orgül S, Costa VP, et al. The impact of ocular blood flow in glaucoma. Prog Retin Eye Res. 2002; 21:359–93.

9. Winder AF. Circulating lipoprotein and blood glucose levels in association with low tension and chronic simple glaucoma. Br J Ophthalmol. 1977; 61:641–5.
11. Jacobson TA, Miller M, Schaefer EJ. Hypertriglyceridemia and cardiovascular risk reduction. Clin Ther. 2007; 29:763–77.

12. Day C. Metabolic syndrome, or What you will: definitions and epidemiology. Diab Vasc Dis Res. 2007; 4:32–8.

13. Joist JH, Lichtenfeld P, Mandell AI, Kolker AE. Platelet function, blood coagulability, and fibrinolysis in patients with low tension glaucoma. Arch Ophthalmol. 1976; 94:1893–5.

14. Waldmann E, Gasser P, Dubler B, et al. Silent myocardial ischemia in glaucoma and cataract patients. Graefes Arch Clin Exp Ophthalmol. 1996; 234:595–8.

15. Pasceri V, Willerson JT, Yeh ET. Direct proinflammatory effect of C-reactive protein on human endothelial cells. Circulation. 2000; 102:2165–8.

16. Leibovitch I, Kurtz S, Kesler A, et al. C-reactive protein levels in normal tension glaucoma. J Glaucoma. 2005; 14:384–6.

17. Su WW, Ho WJ, Cheng ST, et al. Systemic high-sensitivity Creative protein levels in normal-tension glaucoma and priamry open angle glaucoma. J Glaucoma. 2007; 16:320–3.
18. Kunimatsu S, Mayama C, Tomidokoro A, Araie M. Plasma endo-thelin-1 level in Japanese normal tension glaucoma patients. Curr Eye Res. 2006; 31:727–31.

19. Kaiser HJ, Flammer J, Wenk M, Lüscher T. Endothelin-1 plasma levels in normal-tension glaucoma: abnormal response to postural changes. Graefes Arch Clin Exp Ophthalmol. 1995; 233:484–8.

Go to : 
 | Figure 1.Graphs demonstrating the value of total cholesterol, triglyceride, LDL, HDL and high-sensitivity C-reactive protein (hs CRP) in the control group and the normal-tension glaucoma (NTG) group. Each dot represents the average of each factor (95% confidence interval). * Statistical significance (p<0.05) compared with control group. |
 | Figure 2.Graphs demonstrating the value of endothelin-1 (ET-1) and macrophage chemoattractant protein-1 (MCP-1) in the control group and the normal-tension glaucoma (NTG) group. Each dot represents the average of each factor (95% confidence interval). *Statistical significance (p<0.05) compared with control group. |
Table 1.
Baseline characteristics of the healthy control group and the normal-tension glaucoma (NTG) group. No statistical difference between the two groups (independent t-test)
| Characteristics | Control group | NTG group | p-value |
|---|---|---|---|
| No. of cases | 30 | 40 | |
| Sex (male/female) | 14/16 | 17/23 | 0.13 |
| Age (years) | 49.5±15.4 | 53.9±12.7 | 0.30 |
Table 2.
Results of blood examination between the control group and the normal-tension glaucoma (NTG) group (mean± standard deviation)
| Factor (unit) | Control group | NTG group | p-value |
|---|---|---|---|
| WBC (109/L) | 6.00±1.55 | 5.94±1.47 | 0.91 |
| RBC (1012/L) | 4.56±0.32 | 4.61±0.43 | 0.69 |
| Hemoglobin (g/dL) | 13.96±0.99 | 14.19±1.37 | 0.60 |
| Hematocrit (%) | 41.09±2.61 | 41.85±3.73 | 0.53 |
| Platelet (109/L) | 252.73±61.69 | 222.59±53.53 | 0.11 |
| Fasting glucose (mg/dl) | 107.02±31.32 | 108.61±22.72 | 0.89 |
| HbA1C (%) | 5.57±0.59 | 5.44±0.57 | 0.53 |
| Total cholesterol (mg/dl) | 206.63±33.89 | 205.95±40.75 | 0.96 |
| Triglyceride (mg/dl) | 108.82±63.72 | 165.63±95.90 | 0.03* |
| HDL (mg/dl) | 66.09±15.70 | 59.84±15.38 | 0.24 |
| LDL (mg/dl) | 126.90±29.80 | 120.44±36.78 | 0.61 |
| hsCRP (mg/dl) | 0.08±0.17 | 0.07±0.07 | 0.64 |
Table 3.
Results of enzyme-linked immunosorbent assay (ELISA) of endothelin-1 (ET-1) and macrophage chemoattractant protein-1 (MCP-1) in the control group and the normal-tension glaucoma (NTG) group (mean± standard deviation)
| Factor | Control group | NTG group | p-value |
|---|---|---|---|
| ET-1 | 0.12±0.30 pg/ml | 1.14±2.37 pg/ml | 0.007* |
| MCP-1 | 136.47±36.36 pg/ml | 153.47±47.07 pg/m | 0.23 |


 PDF
PDF ePub
ePub Citation
 Print
Print


 XML Download