Abstract
Purpose
To compare the results of total deviation (TD) as measured by standard automated perimetry (SAP) and measured with of Matrix Frequency-doubling Technology (FDT) in patients with preperimetric glaucoma.
Methods
Fifty-two eyes of 52 patients with preperimetric glaucoma were included. Subjects were examined with Matrix FDT and Stratus optical coherence tomography (OCT), and the results of each examination were analyzed. The proportions of abnormal results in SAP TD, Matrix TD, and Matrix pattern deviation (PD) were calculated. Among the results of tests, the following correlations were evaluated: SAP TD and Matrix, and visual fields and OCT. In addition, the differences in peripapillary retinal nerve fiber layer thickness (RNFL) according to the result of SAP TD in preperimetric patients with abnormal Matrix PD were analyzed.
Results
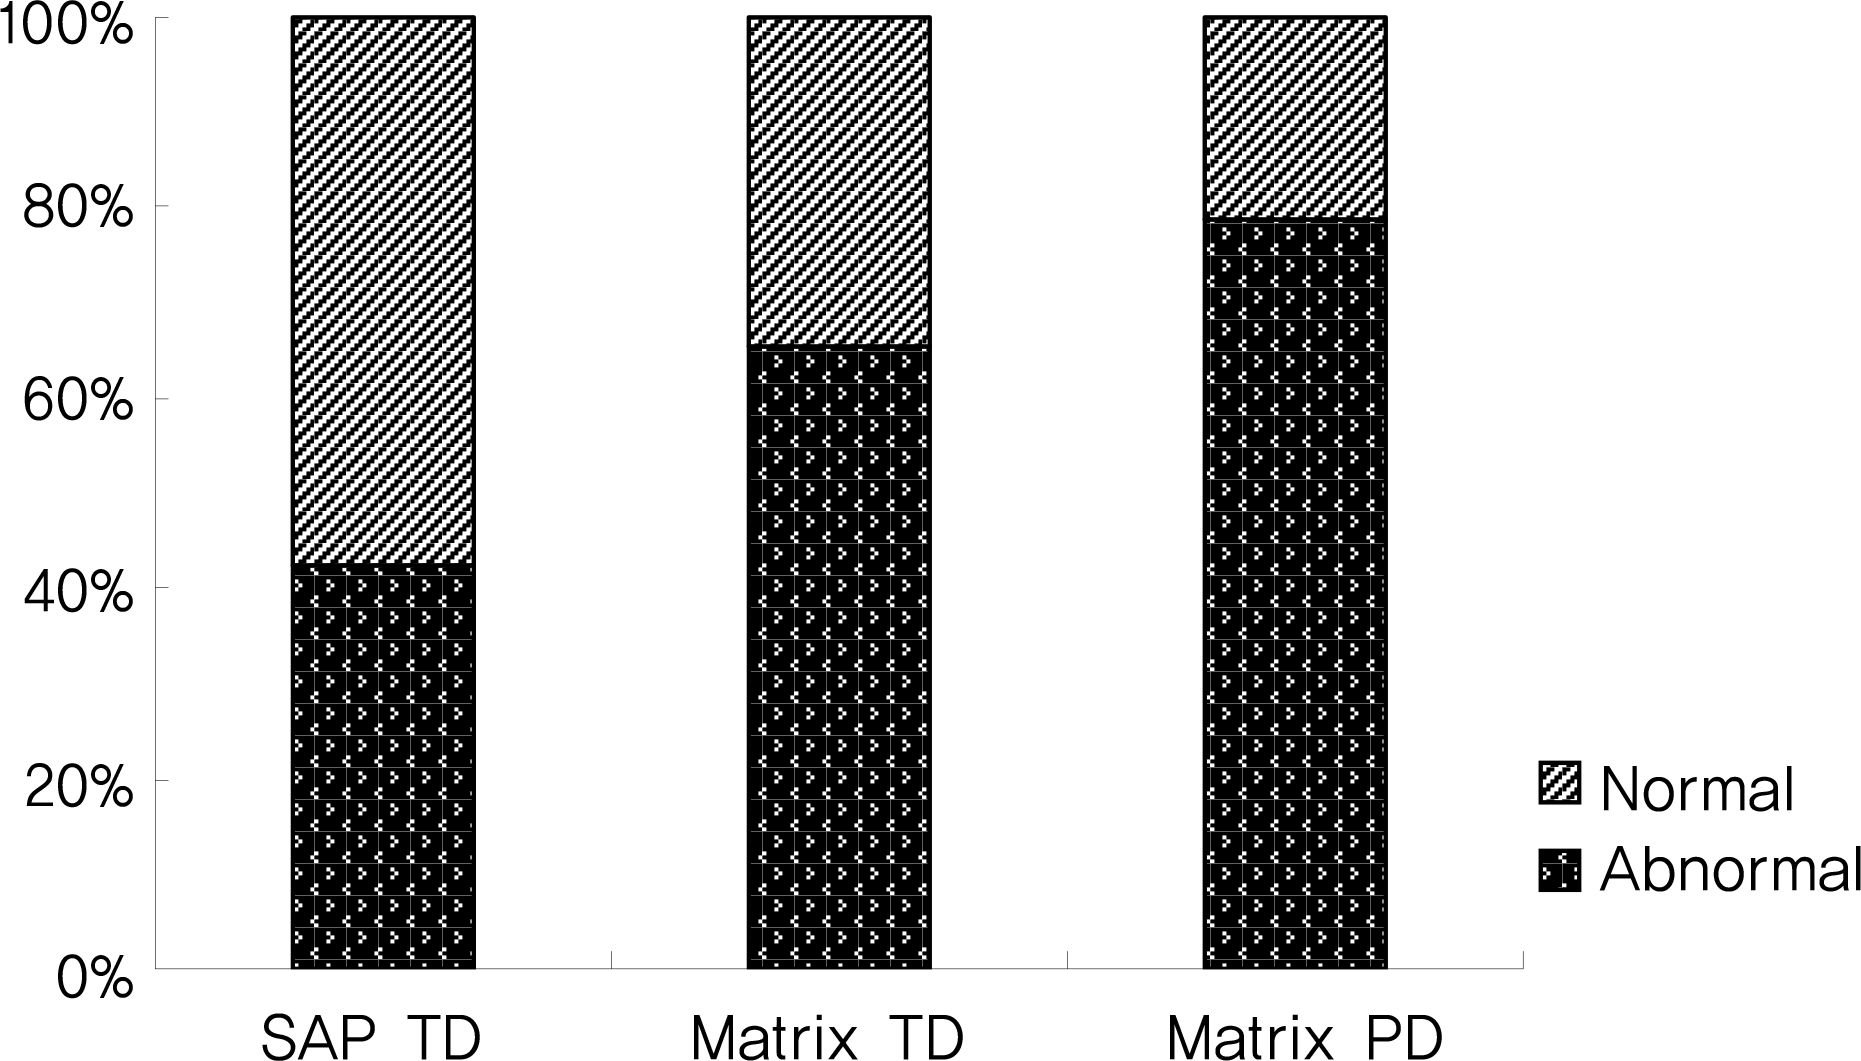
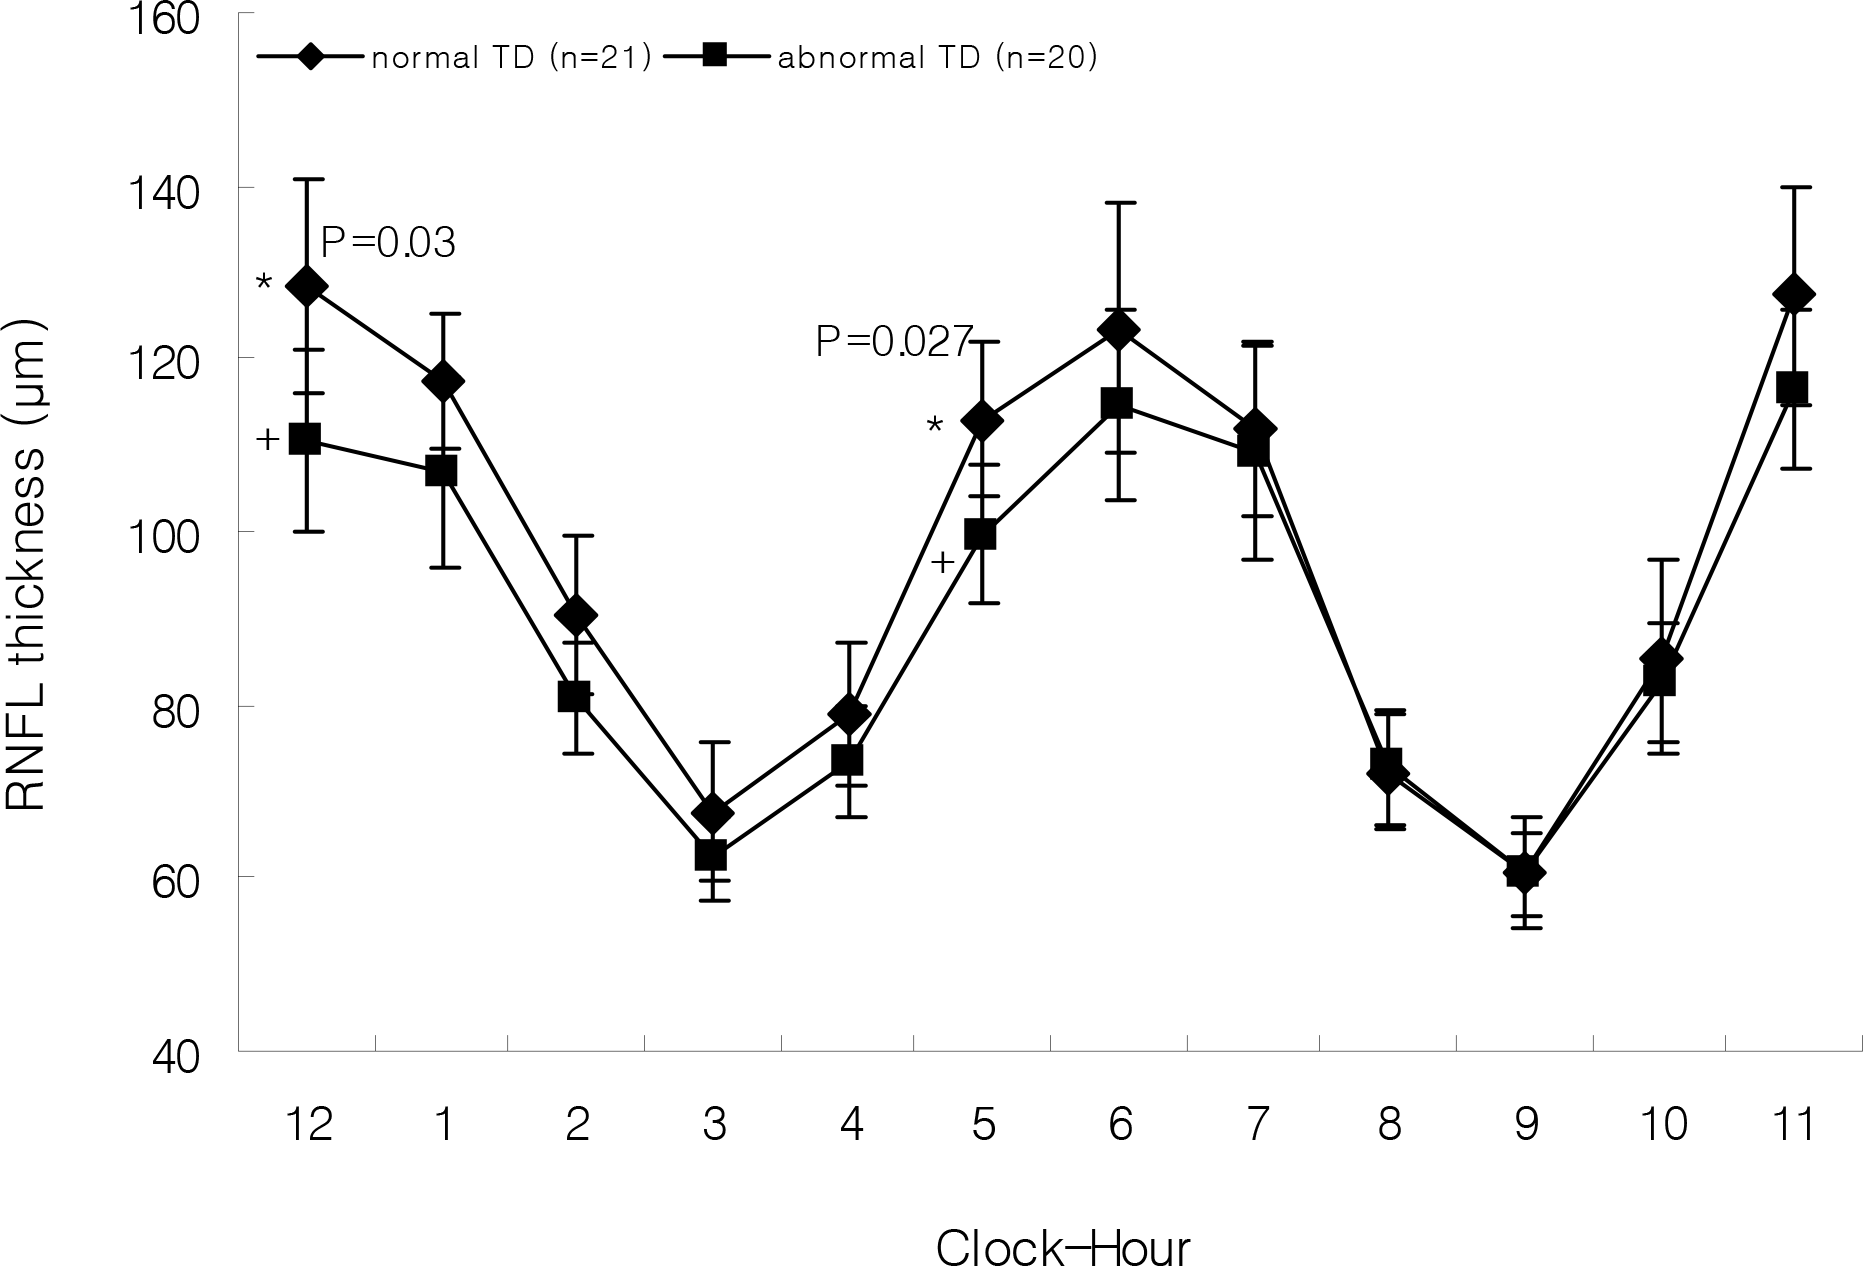
A abnormalities in SAP TD, Matrix TD and Matrix PD were found in 22 (42.3%), 34 (65.4%), 41 (78.9%) eyes, respectively. There was marginal correlation between SAP TD and Matrix PD (p=0.07). No significant correlation was found between SAP TD and OCT, although Matrix PD and OCT did show significant correlation (p<0.05). In preperimetric patients with abnormal Matrix PD, RNFL thickness was significantly lower in the abnormal SAP TD group than in the normal SAP TD group on average, in the superior quadrant, and at the 12 o' clock and 5 o' clock positions (p<0.05).
Go to : 
References
1. Quigley HA, Addicks EM, Green WR. Optic nerve damage in human glaucoma. III:quantitative correlation of nerve fiber loss and visual field defect in glaucoma, ischemic neuropathy, papilledema, and toxic neuropathy. Arch Ophthalmol. 1982; 100:135–46.
2. Quigley HA, Dunkelberger GR, Green WR. Retinal ganglion cell atrophy correlated with automated perimetry in human eyes with glaucoma. Am J Ophthalmol. 1989; 107:453–64.

3. Sommer A, Katz J, Quigley HA, et al. Clinically detectable nerve fiber atrophy precedes the onset of glaucomatous field loss. Arch Ophthalmol. 1991; 109:77–83.

4. Bagga H, Feuer WJ, Greenfield DS. Detection of psychophysical and structural injury in eyes with glaucomatous optic neuropathy and normal standard automated perimetry. Arch Ophthalmol. 2006; 124:169–76.

5. Mardin CY, Horn FK, Jonas JB, et al. Preperimetric glaucoma diagnosis by confocal scanning laser tomography of optic disc. Br J Ophthalmol. 1999; 83:29–304.
6. Hart WM, Becker B. The onset and evolution of glaucomatous visual field defects. Ophthalmology. 1982; 89:268–79.

7. Drance SM. The early field defects in glaucoma. Invest aberrations. 1969; 8:84–91.
8. Armaly MF. Visual field defects in early open-angle glaucoma. Trans Am Ophthalmol Soc. 1971; 69:147–62.
9. Henson DB, Artes PH, Chauhan BC. Diffuse loss of sensitivity in early glaucoma. Invest Ophthalmol Vis Sci. 1999; 40:3147–51.
10. Anderson DR. Automated static perimetry. 1st ed.St. Louis: Mosby;1992. p. 80.
11. Johnson CA, Adams AJ, Casson EJ, Brandt JD. Blue-on-yellow perimetry can predict the development of glaucomatous visual field loss. Arch Ophthalmol. 1993; 111:645–50.

12. Medeiros FA, Sample PA, Weinreb RN. Frequency doubling technology perimetryabnormalities as predictors of glaucomatous visual field loss. Am J Ophthalmol. 2004; 137:863–71.
13. Bayer AU, Erb C. Short wavelength automated perimetry, frequency doubling technology perimetry, and pattern electroretinography for prediction of progressive glaucomatous standard visual field defects. Ophthalmology. 2002; 109:1009–17.

14. Ferreras A, Polo V, Larrosa JM. Can frequency-doubling technology and short-wavelength automated perimetries detect visual field defects before standard automated perimetry in patients with preperimetric glaucoma? J Glaucoma. 2007; 16:372–83.

15. Bengtsson B, Lindgren A, Heijl A, et al. Perimetric probability maps to separate change caused by glaucoma from that caused by cataract. Acta Ophthalmol. 1997; 75:184–8.

16. Åsman P, Heijl A. Glaucoma hemifield test: automated visual field evaluation. Arch Ophthalmol. 1992; 110:812–9.
17. Garway-Heath DF, Poinoosawmy D, Fitzke FW, Hitchings RA. Mapping the visual field to the optic disc in normal tension glaucoma eyes. Ophthalmology. 2000; 107:1809–15.
18. Airaksinen PJ, Drance SM, Douglas GR, et al. Diffuse and localized nerve fiber loss in glaucoma. Am J Ophthalmol. 1984; 98:566–71.

19. Sommer A, Katz J, Quigley HA, et al. Clinically detectable nerve fiber atrophy precedes the onset of glaucomatous field loss. Arch Ophthalmol. 1991; 109:77–83.

20. Johnson CA, Sample PA, Zangwill LM, et al. Structure and Function Evaluation(SAFE):II. Comparison of optic disc and visual field characteristics Am J Ophthalmol. 2003; 135:148–54.
21. Choplin NT, Lundy DC, Dreher AW. Differentiating patient with glaucoma from glaucoma suspects and normal subjects by nerve fiber layer assessment with scanning laser polarimetry. aberrationsogy. 1998; 105:2068–76.
22. Advanced Glaucoma Intervention Study. 2. Visual field test scoring and reliability. Ophthalmology. 1994; 101:1445–55.
23. Musch DC, Lichter PR, Guire KE, et al. The Collaborative Initial Glaucoma Treatment Study: study design, methods, and baseline characteristics of enrolled patients. Ophthalmology. 1999; 106:653–62.

24. Artes PD, Nocolela MT, LeBlanc RP, Chauhan BC. Visual field progression in glaucoma: total versus pattern deviation analyses. Invest Ophthalmol Vis Sci. 2005; 46:4600–6.

25. Asman P, Wild JM, Heijl A. Appearance of the pattern deviation map as a function of change in area of localized field loss. Invest Ophthalmol Vis Sci. 2004; 45:3099–106.
26. Anderson AJ, Johnson CA, Fingeret M, et al. Characteristics of the normative database for the Humphrey matrix perimeter. Invest Ophthalmol Vis Sci. 2005; 46:1540–8.

27. Haymes SA, Hutchison DM, McCormick TA, et al. aberrations visual field progression with frequency-doubling technology and standard automated perimetry in a longitudinal prospective study. Invest Ophthalmol Vis Sci. 2005; 46:547–54.
28. Leeprechanon N, Giangiacomo A, Fontana H, et al. Frequencydobling perimetry: comparison with standard automated perimetry to detect glaucoma. Am J Ophthalmol. 2007; 143:263–71.
29. Cho CH, Kee CW. Association of retinal nerve fiber layer thickness measured by optical coherence tomography and automatic perimetry. J Korean Ophthalmol Soc. 2002; 43:1032–9.
30. Kim TW, Zangwill LM, Bowd C, et al. Retinal nerve fiber layer damage as assessed by optical coherence tomography in eyes with a visual field defect detected by frequency doubling technology perimetry but not by standard automated perimetry. aberrationsogy. 2007; 114:1053–7.
Go to : 
 | Figure 1.Abnormalities among SAP TD, Matrix TD and Matrix PD were found in 22 (42.3%), 34 (65.4%), 41 (78.9%) eyes, respectively. SAP=standard automated perimetry; Matrix=Matrix FDT; TD=total deviation; PD=pattern deviation. |
 | Figure 2.Comparison of RNFL thickness (μm) of Straus OCT clock-hours according to the result of SAP TD show RNFL thickness was significantly lower in abnormal SAP TD group(*) than normal SAP TD group(+) at 12 o'clock, and 5 o'clock (p<0.05). |
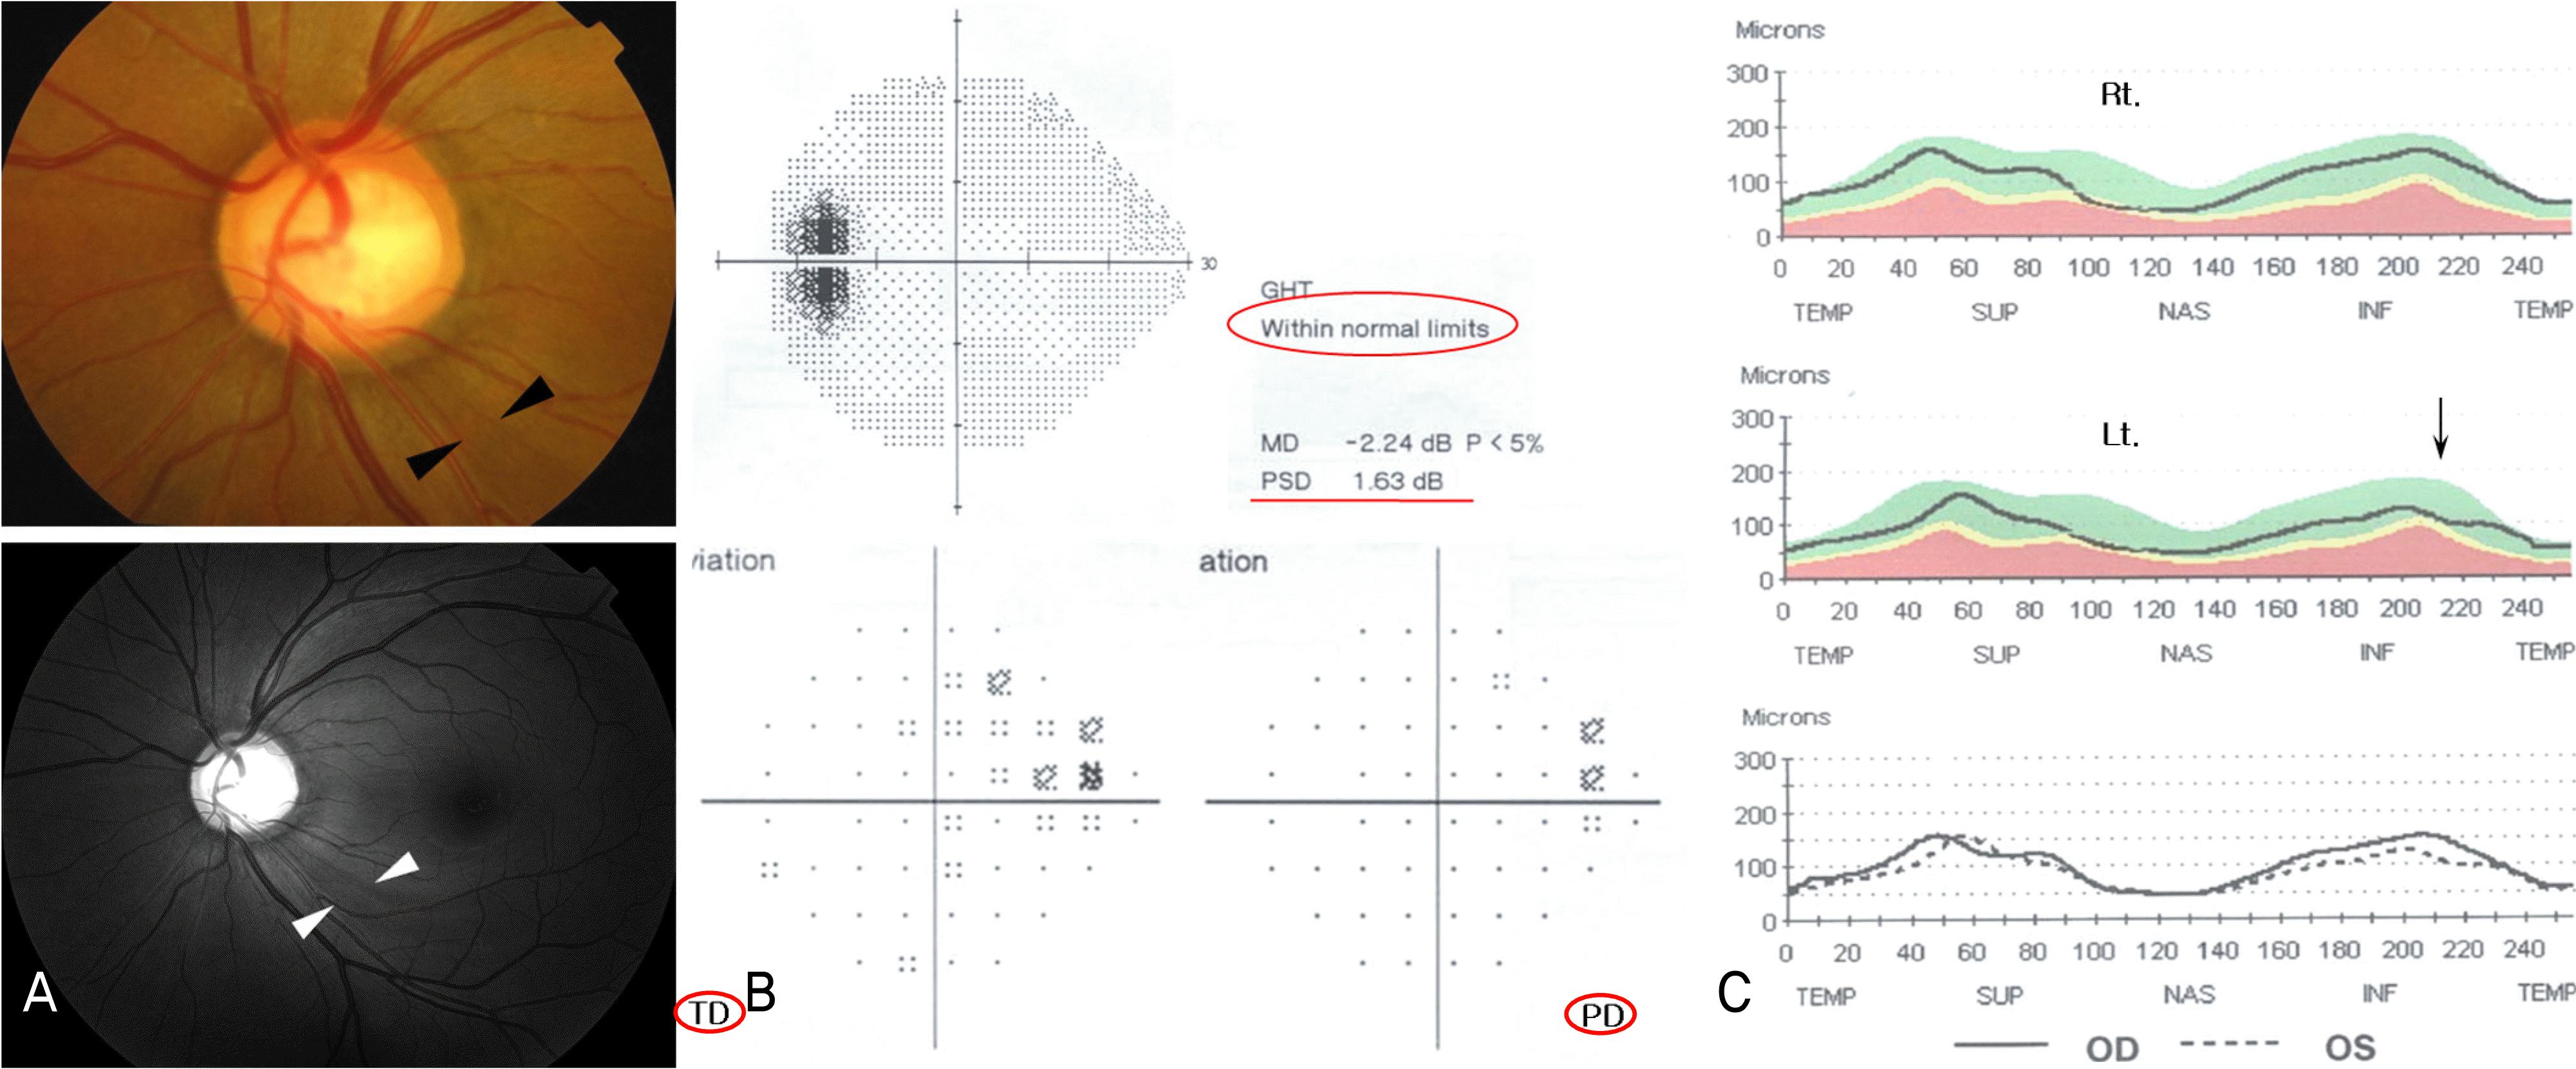
 | Figure 3.A 41-year-old patient with preperimetric glaucoma. (A) Disc and red-free photographs show glaucomatous cupping and localized retinal nerve fiber layer (RNFL) defect. (B) Result of Humphrey visual field is normal according to the Anderson criteria but total deviation plot shows abnormal result. (C) Stratus OCT shows RNFL thinning at the inferior temporal region. |
Table 1.
Demographics of patients
| Patients (eyes7) | 52 (52) |
| Age (years) | 48.41±12.5 |
| Gender (male:female) | 38:14 |
| Laterality (R:L) | 29:23 |
| NTG*:POAG† | 39:13 |
| VA‡ (logMAR) | 0.00±0.00 |
| SE§ (diopter) | −1.11±2.5 (−4.75 ∼+2.25) |
| MD∏ (dB) | −1.63±1.24 (−3.33∼+1.20) |
| PSD** (dB) | 1.59±3.2 (+1.2∼+2.49) |
| General height (dB) | −0.02±1.04 (−3∼+1) |
Table 2.
Correlations of visual field results and optical coherence tomography (OCT) findings
| | OCT* line | OCT clock hour |
|---|---|---|
| SAP∏ TD‡ | r=0.11 P=0.41 | r=0.19 p=0.18 |
| MAT† TD | r=0.16 P=0.25 | r=0.13 p=0.34 |
| MAT PD§ | r=0.29 P=0.03* | r=0.40 p<0.01* |
Table 3.
RNFL thickness(μm) according to the result of SAP* TD in preperimetric patients with abnormal Matrix PD
| | Normal TD† (n=21) | Abnormal TD (n=20) | p-value |
|---|---|---|---|
| Sup‡ | 124.38±7.5 | 111.4±8.64 | 0.022* |
| Nasal§ | 79.05±7.4 | 72.6±4.6 | 0.1321 |
| Inf∏ | 116.24±8.61 | 107.7±8.03 | 0.1388 |
| Temp# | 72.81±7.25 | 71.9±4.88 | 0.831 |
| Avg** | 98.10±4.5 | 90.80±4.2 | 0.019* |
| 12 | 128.43±12.54 | 110.65±10.6 | 0.03* |
| 1 | 117.43±7.88 | 106.95±11.04 | 0.112 |
| 2 | 90.57±9.2 | 80.7±6.32 | 0.082 |
| 3 | 67.57±7.97 | 62.25±4.94 | 0.245 |
| 4 | 79±8.16 | 73.45±6.59 | 0.276 |
| 5 | 112.86±8.94 | 99.7±7.90 | 0.027* |
| 6 | 123.52±14.27 | 114.6±10.86 | 0.309 |
| 7 | 112.1±10.09 | 109.3±12.311 | 0.714 |
| 8 | 72.24±6.60 | 72.75±6.58 | 0.909 |
| 9 | 60.48±6.46 | 60.4±4.63 | 0.984 |
| 10 | 85.476±11.20 | 82.6±6.98 | 0.652 |
| 11 | 127.38±12.51 | 116.5±9.31 | 0.156 |
* Student t-test, p<0.05; Values are numbers or means± standard deviation; * SAP=standard automated perimetry
Table 4.
Characteristics of patients with abnormal Matrix PD
| | SE* | Age | Disc area(mm2) |
|---|---|---|---|
| Normal TD† (n=21) | −1.50±2.44 | 45.33 ±11.44 | 2.62±0.51 |
| Abnormal TD (n=20) | −1.17±2.77 | 50.80 ±14.98 | 2.60±0.33 |
| p-value | 0.69 | 0.195 | 0.93 |


 PDF
PDF ePub
ePub Citation
 Print
Print


 XML Download