Abstract
Purpose
To evaluate the correlation between central corneal thickness (CCT) and scleral thickness (ST) in glaucoma patients.
Methods
Seventy-eight eyes of 78 patients with no previous history of intraocular surgery and 23 control eyes were enrolled in the present study. For all eyes, CCT, ST, axial length, anterior chamber depth and refractive error were measured by a single examiner. The correlations among the measurements were analyzed.
Results
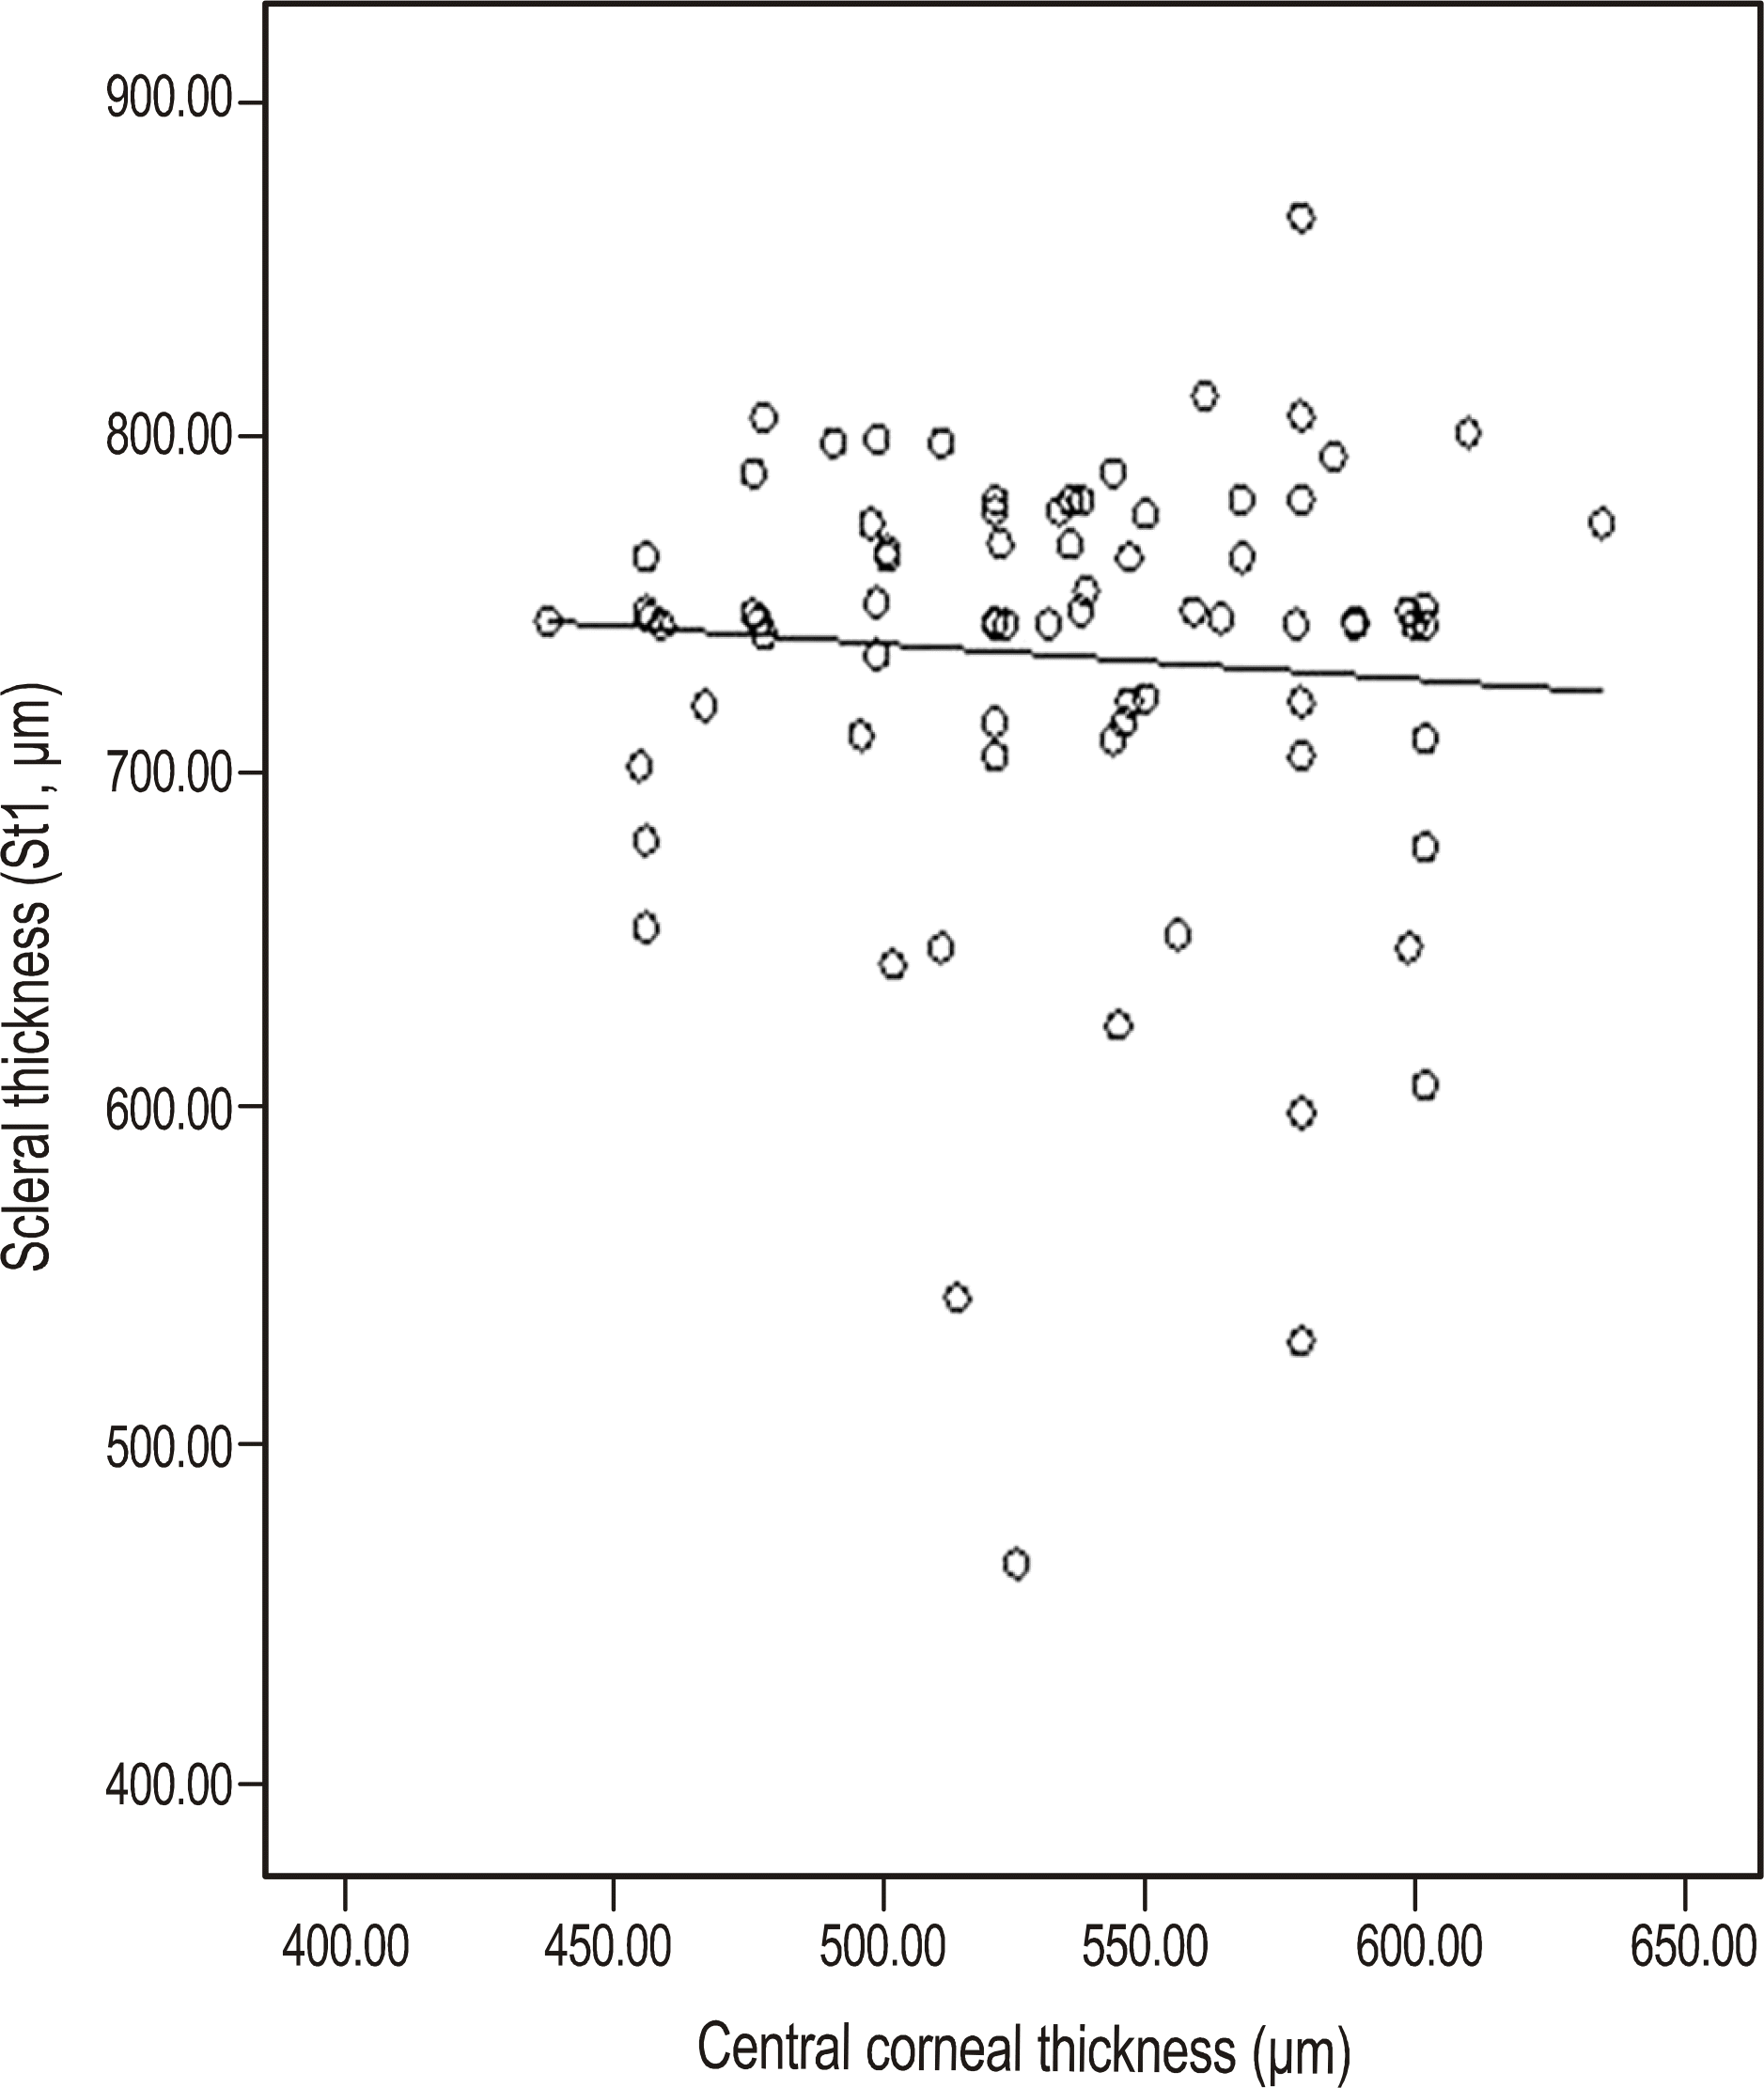
The mean patient age was 57.32 ± 9.44 years, and the mean CCT was 532.80 ± 43.75 μ m. The mean CCT of ocular hypertension (576.00 ± 26.59 μ m) was thicker than that of the normal control group (530.30 ± 35.34 μ m, p = 0.028), although the mean STs of the groups were not significantly different. No significant correlation was found between CCT and ST (r = −0.073, p = 0.466).
Go to : 
References
1. Wolfs RC, Klaver CC, Vingerling JR, et al. Distribution of central corneal thickness and its association with intraocular pressure: the Rotterdam Study. Am J Ophthalmol. 1997; 123:767–72.

2. Damji KF, Muni RH, Munger RM. Influence of corneal variables on accuracy of intraocular pressure measurement. J Glaucoma. 2003; 12:69–80.

3. Herndon LW, Choudhri SA, Cox T, et al. Central corneal thickness in normal, glaucomatous, and ocular hypertensive eyes. Arch Ophthalmol. 1997; 115:1137–41.

4. La Rosa FA, Gross RL, Orengo-Nania S. Central corneal thickness of Caucasians and African Americans in glaucomatous and non-glaucomatous populations. Arch Ophthalmol. 2001; 119:23–7.
5. Shah S, Chatterjee A, Mathai M, et al. Relationship between corneal thickness and measured intraocular pressure in a general ophthalmology clinic. Ophthalmology. 1999; 106:2154–60.
6. Bhan A, Browning AC, Shah S, et al. Effect of corneal thickness on intraocular pressure measurements with the pneumotonometer, Goldmann applanation tonometer, and Tono-Pen. Invest aberrations Vis Sci. 2002; 43:1389–92.
7. Singh RP, Goldberg I, Graham SL, et al. Central corneal thickness, tonometry, and ocular dimensions in glaucoma and ocular aberrations. J Glaucoma. 2001; 10:206–10.
8. Stodtmeister R. Applanation tonometry and correction according to corneal thickness. Acta Ophthalmol Scand. 1998; 76:319–24.

9. Doughty MJ, Zaman ML. Human corneal thickness and its impact on intraocular pressure measures: a review and meta-analysis approach. Surv Ophthalmol. 2000; 44:367–408.
10. Gordon MO, Beiser JA, Brandt JD, et al. The Ocular Hypertension Treatment Study. baseline factors that predict the onset of primary open-angle glaucoma. Arch Ophthalmol. 2002; 120:714–20.
11. Burgoyne CF, Downs JC, Bellezza AJ, et al. The optic nerve head as a biomechanical structure: a new paradigm for understanding the role of IOP-related stress and strain in the pathophysiology of glaucomatous optic nerve head damage. Prog Retin Eye Res. 2005; 24:39–73.

12. Hansen FK, Ehlers N. Elevated tonometer reading caused by a thick cornea. Acta Ophthalmol (Copenh). 1971; 49:775–8.
13. Doughty MJ, Zaman ML. Human corneal thickness and its impact on intraocular pressure measures: a review and meta-analysis approach. Surv Ophthalmol. 2000; 44:367–408.
14. Herndon LW, Weizer JS, Stinnett SS. Central corneal thickness as a risk factor for advanced glaucoma damage. Arch Ophthalmol. 2004; 122:17–21.

15. Ehlers N, Hansen FK. Central corneal thickness in low tension glaucoma. Acta Ophthalmol (Copenh). 1974; 52:740–6.
16. Copt RP, Thomas R, Mermoud A. Corneal thickness in ocular hypertension, primary open-angle glaucoma, and normal tension glaucoma. Arch Ophthalmol. 1999; 117:14–6.

Go to : 
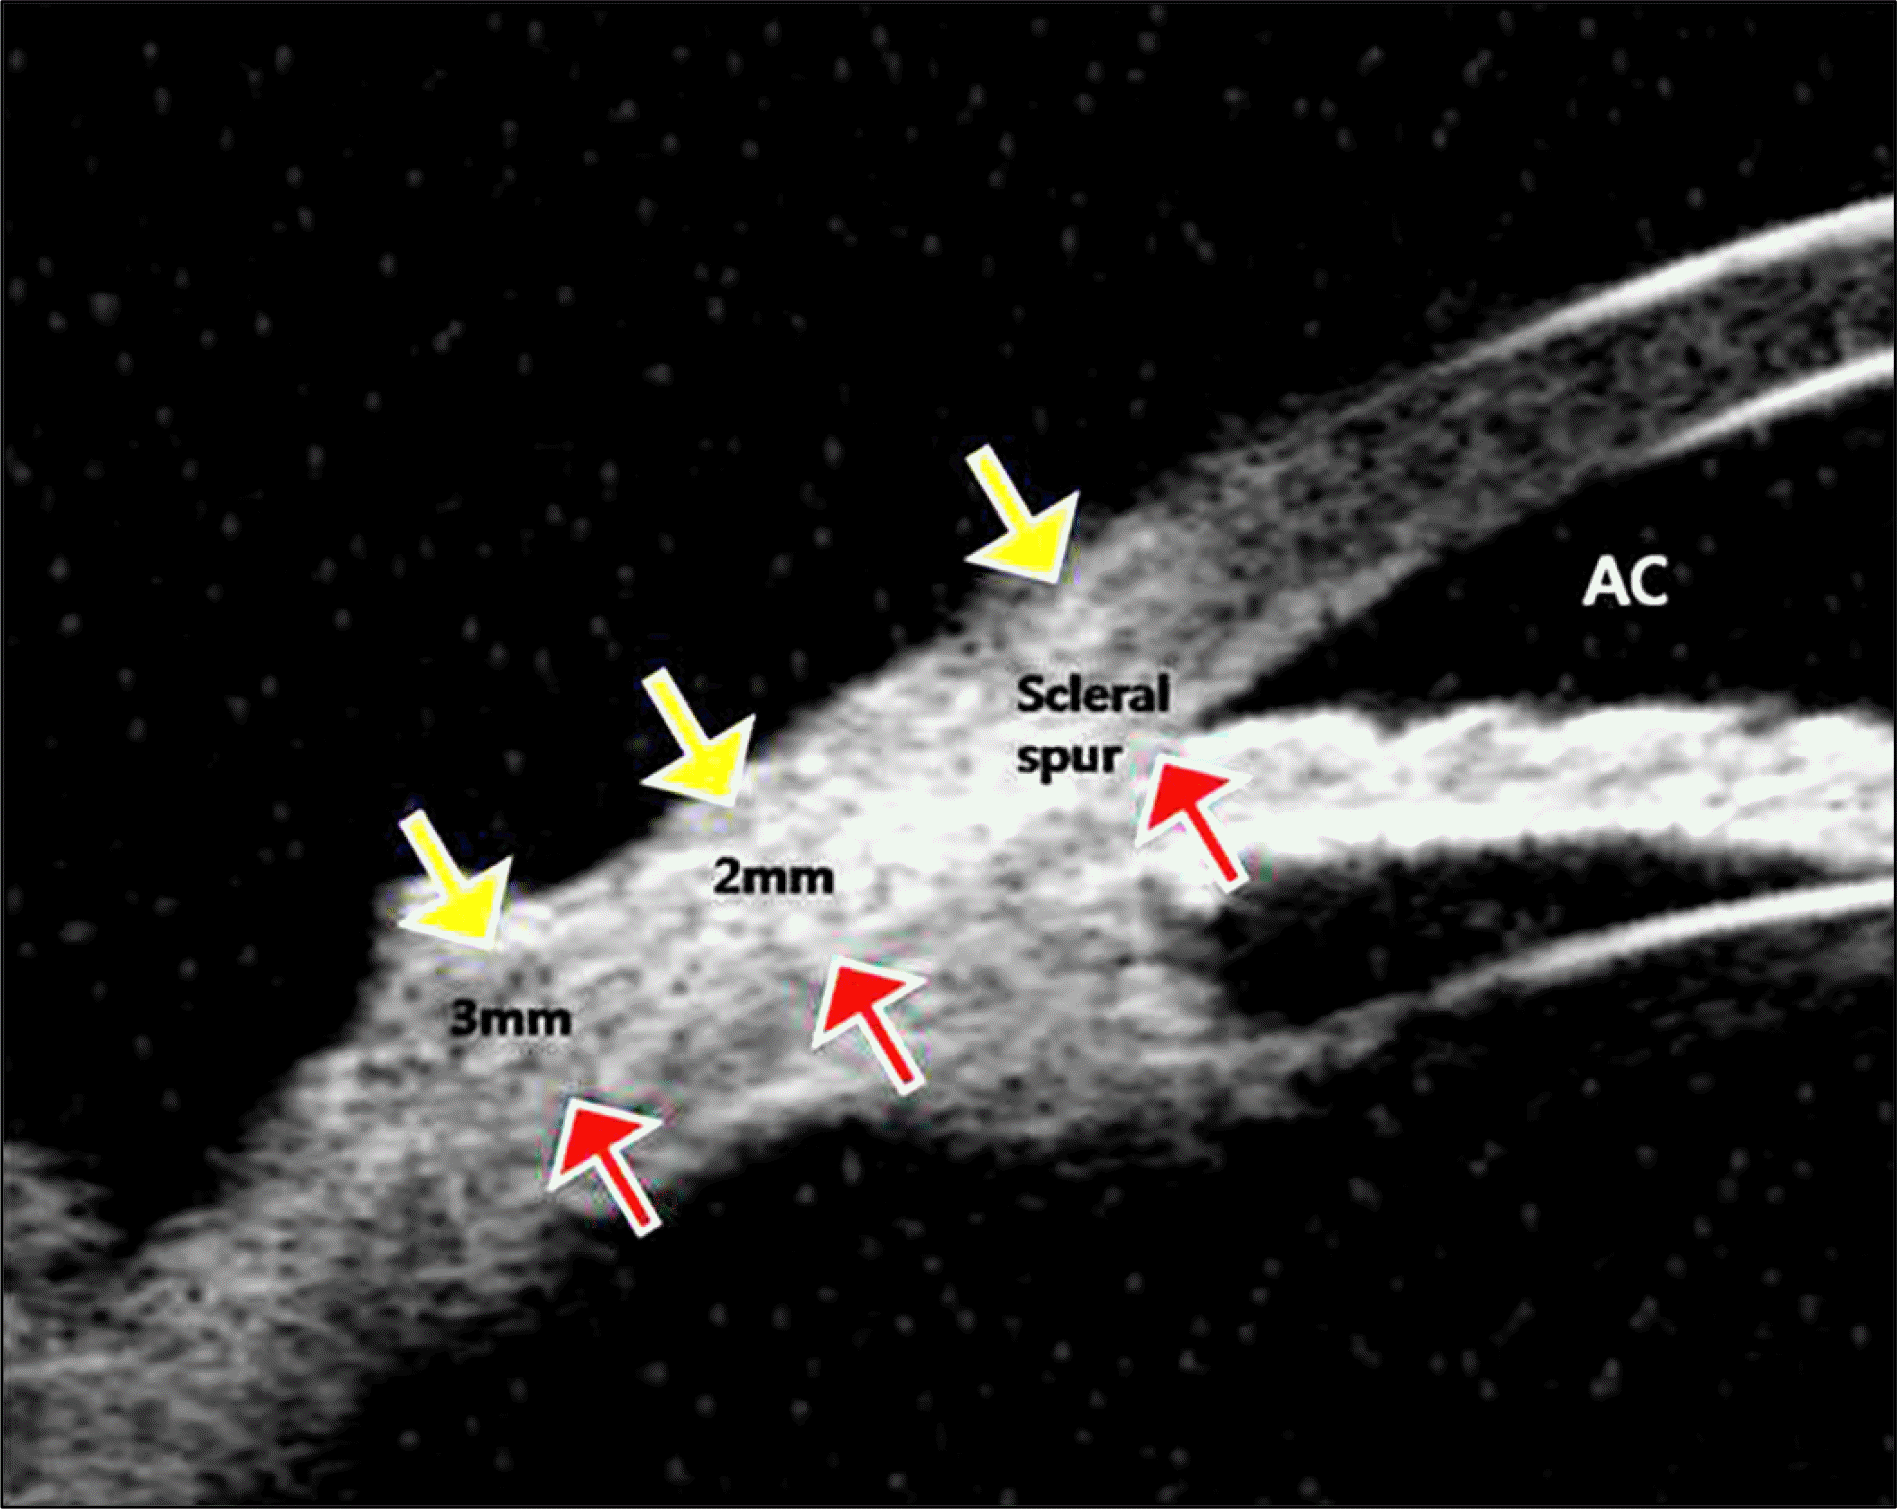
 | Figure 1.Ultrasound biomicroscopic image of the temporal corneoscleral limbus demonstrates the limits of episcleral tis-sue-sclera (outer yellow arrows) and sclera-ciliary body inter-faces (inner red arrows) at the three sites of measurements, the scleral spur (ST1), 2.0 and 3.0 mm posterior to it (ST2 and ST3, respectively). |
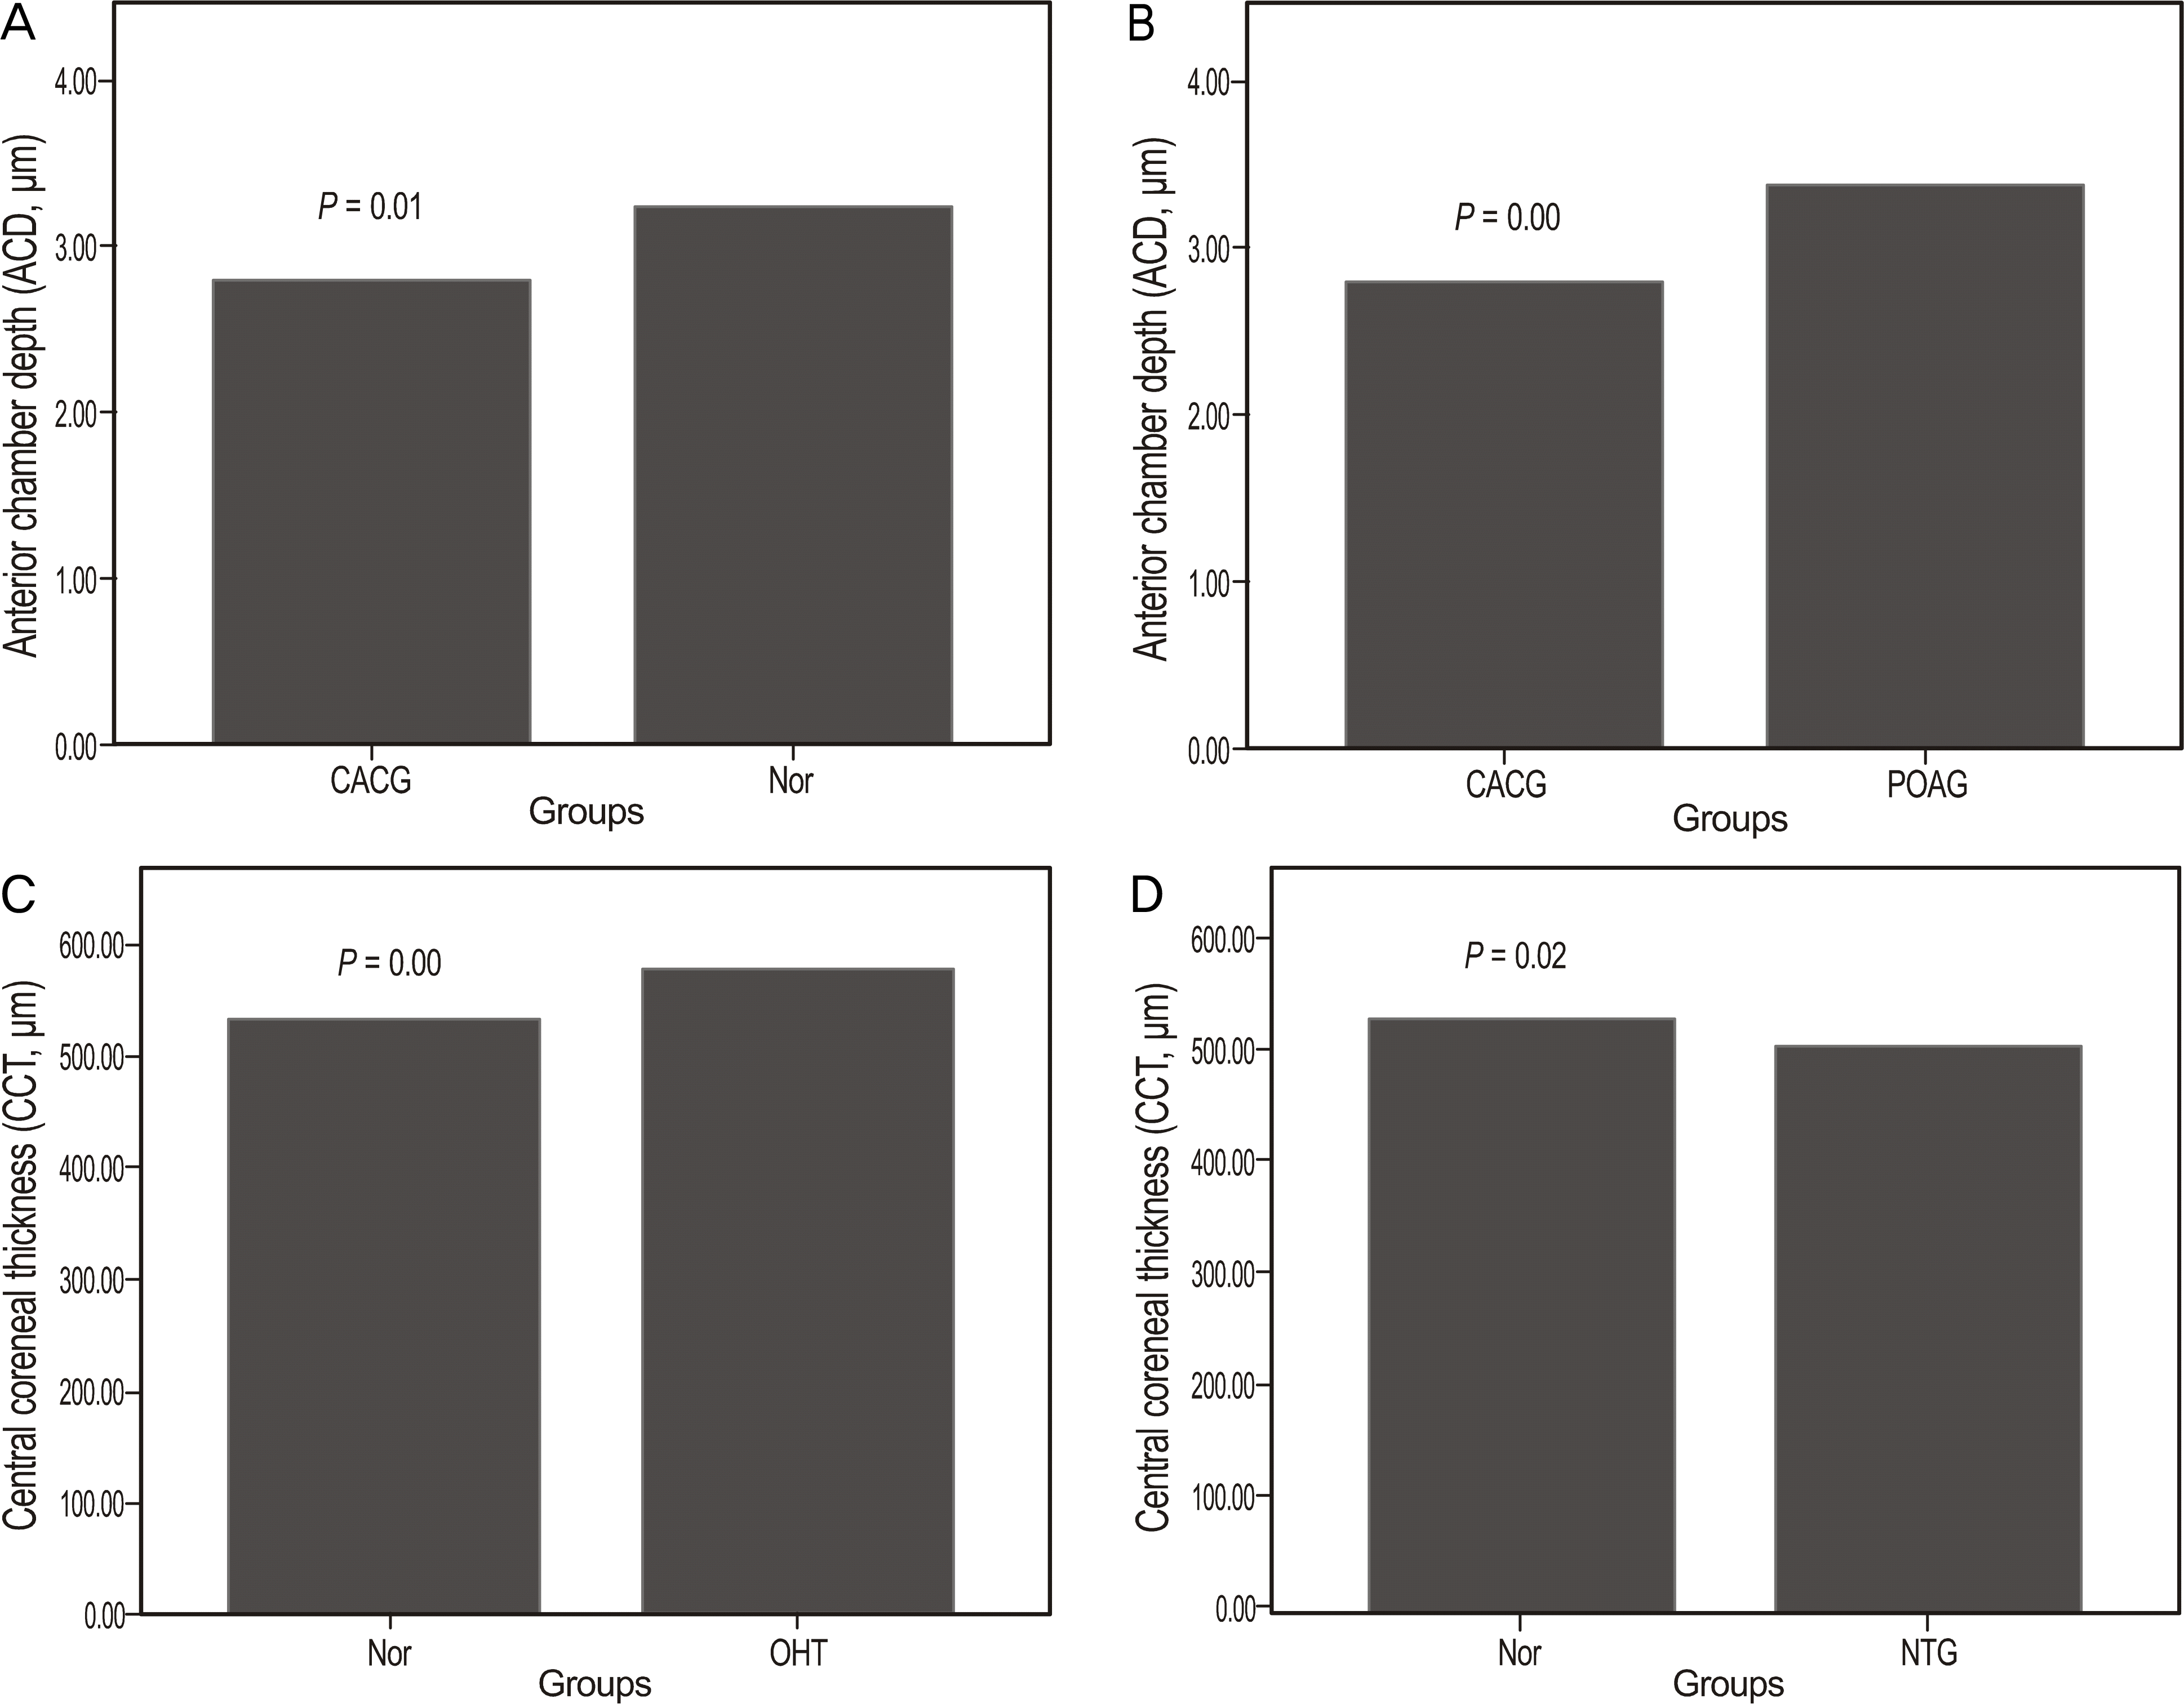
 | Figure 2.Anterior chamber depth (ACD) (Fig. A, B) and central corneal thickness (CCT) (Fig. C, D) in total patients. ACD in chronic angle closure glaucoma group was significantly narrower than control and that of the primary open angle glaucoma groups (p = 0.01, 0.00). CCT in ocular hypertension group was significantly thicker than control group and CCT in normal tension glaucoma group was significantly thiner than that of the control group (p = 0.00, 0.02). POAG = priamry open angle glaucoma; CACG = chronic angle closure glaucoma; NTG = normal tension glaucoma; OHT = ocular hypertension; Nor = normal controls. |
 | Figure 3.Correlation between central corneal thickness and scleral thickness (ST1) in total patinets. There was no correlation between central corneal thickness and scleral thickness (r =-0.073, p = 0.620). |
Table 1.
Sex, age, spherical equivalent of the patients
Table 2.
Axial length, anterior chamber depth (ACD), central corneal thickness (CCT) and scleral thickness (ST1, ST2, ST3) in the subgroups of the patients
Table 3.
Correlations between central corneal thickness (CCT) and scleral thickness (ST) in total subjects
| | CCT vs. ST1 | CCT vs. ST2 | CCT vs. ST3 |
|---|---|---|---|
| r | −0.073 | −0.061 | −0.095 |
| p* | 0.466 | 0.542 | 0.345 |
Table 4.
Correlation between central corneal thickness (CCT) and scleral thickness among the subgroups


 PDF
PDF ePub
ePub Citation
 Print
Print


 XML Download