Abstract
Methods
Fifteen patients were enrolled in the present study. Subjects performed visual tasks on a computer for one hour. A survey of ocular fatigue was conducted with a questionnaire. Tear breakup time, blinking rate, ocular protection index, conjunctival injection, maximal blinking interval, temperature of the ocular surface, and visual evoked potential were evaluated before and immediately after the task. Surface electromyography of the orbicularis oculi muscle was performed before and during the task.
Results
The survey showed increases in subjective ocular fatigue in all subjects. Tear breakup time, ocular protection index and maximal blinking interval decreased, while temperature of the ocular surface increased after the task. Conjunctival injection showed a tendency to increase. Electromyography, and visual evoked potential did not change significantly. Conclusions: In the present study, tear breakup time, ocular protection index, maximal blinking interval, and temperature of the ocular surface changed as ocular fatigue increased. Therefore, these measures can be objectively used for the evaluation of ocular fatigue.
Go to : 
References
1. Scheiman M. Accommodative and binocular vision disorders associated with video display terminals: diagnosis and management issues. J Am Optom Assoc. 1996; 67:531–9.
2. Thomson WD. Eye problems and visual display terminals–the facts and the fallacies. Ophthalmic Physiol Opt. 1998; 18:111–9.

3. Schlote T, Kadner G, Freudenthaler N. Marked reduction and distinct patterns of eye blinking in patients with moderately dry eyes during video display terminal use. Graefes Arch Clin Exp Ophthalmol. 2004; 242:306–12.

4. Ames SL, Wolffsohn JS, McBrien NA. The Development of a Symptom Questionnaire for Assessing Virtual Reality Viewing Using a Head-Mounted Display. Optom Vis Sci. 2005; 82:168–76.

5. Schulze MM, Jones DA, Simpson TL. The Development of Validated Bulbar Redness Grading Scales. Optom Vis Sci. 2007; 84:976–83.

6. Cella D, Peterman A, Passik S, et al. Progress toward guidelines for the management of fatigue. Oncology. 1998; 12:369–77.
8. Toda I, Fujishima H, Tsubota K. Ocular fatigue is the major symptom of dry eye. Acta Ophthalmol. 1993; 71:347–52.

9. Himebaugh NL, Begley CG, Bradley A, Wilkinson JA. Blinking and tear breakup during four visual tasks. Optom Vis Sci. 2009; 86:E106–14.

10. Kim JS, Cho KJ, Song JS. Influences of computer works on blink rate and ocular dryness in adolescents. J Korean Ophthalmol Soc. 2007; 48:1466–72.

11. Ousler GW, Hagberg KW, Schindelar M, et al. The Ocular Protection Index. Cornea. 2008; 27:509–13.

12. Galassi F, Giambene B, Corvi A, Falaschi G. Evaluation of ocular surface temperature and retrobulbar haemodynamics by infrared thermography and colour Doppler imaging in patients with glaucoma. Br J Ophthalmol. 2007; 91:878–81.

13. Sodi A, Giambene B, Falaschi G, et al. Ocular surface temperature in central retinal vein occlusion: preliminary data. Eur J Ophthalmol. 2007; 17:755–9.

14. Sodi A, Giambene B, Miranda P, et al. Ocular surface temperature in diabetic retinopathy: a pilot study by infrared thermography. Eur J Ophthalmol. 2009; 19:1004–8.

15. Kim JH, Jeong JH, Ha HS, et al. Relationship Between the Ocular Surface Temperature and the Nasal Predominance in Pterygium. J Korean Ophthalmol Soc. 2008; 49:732–6.

Go to : 
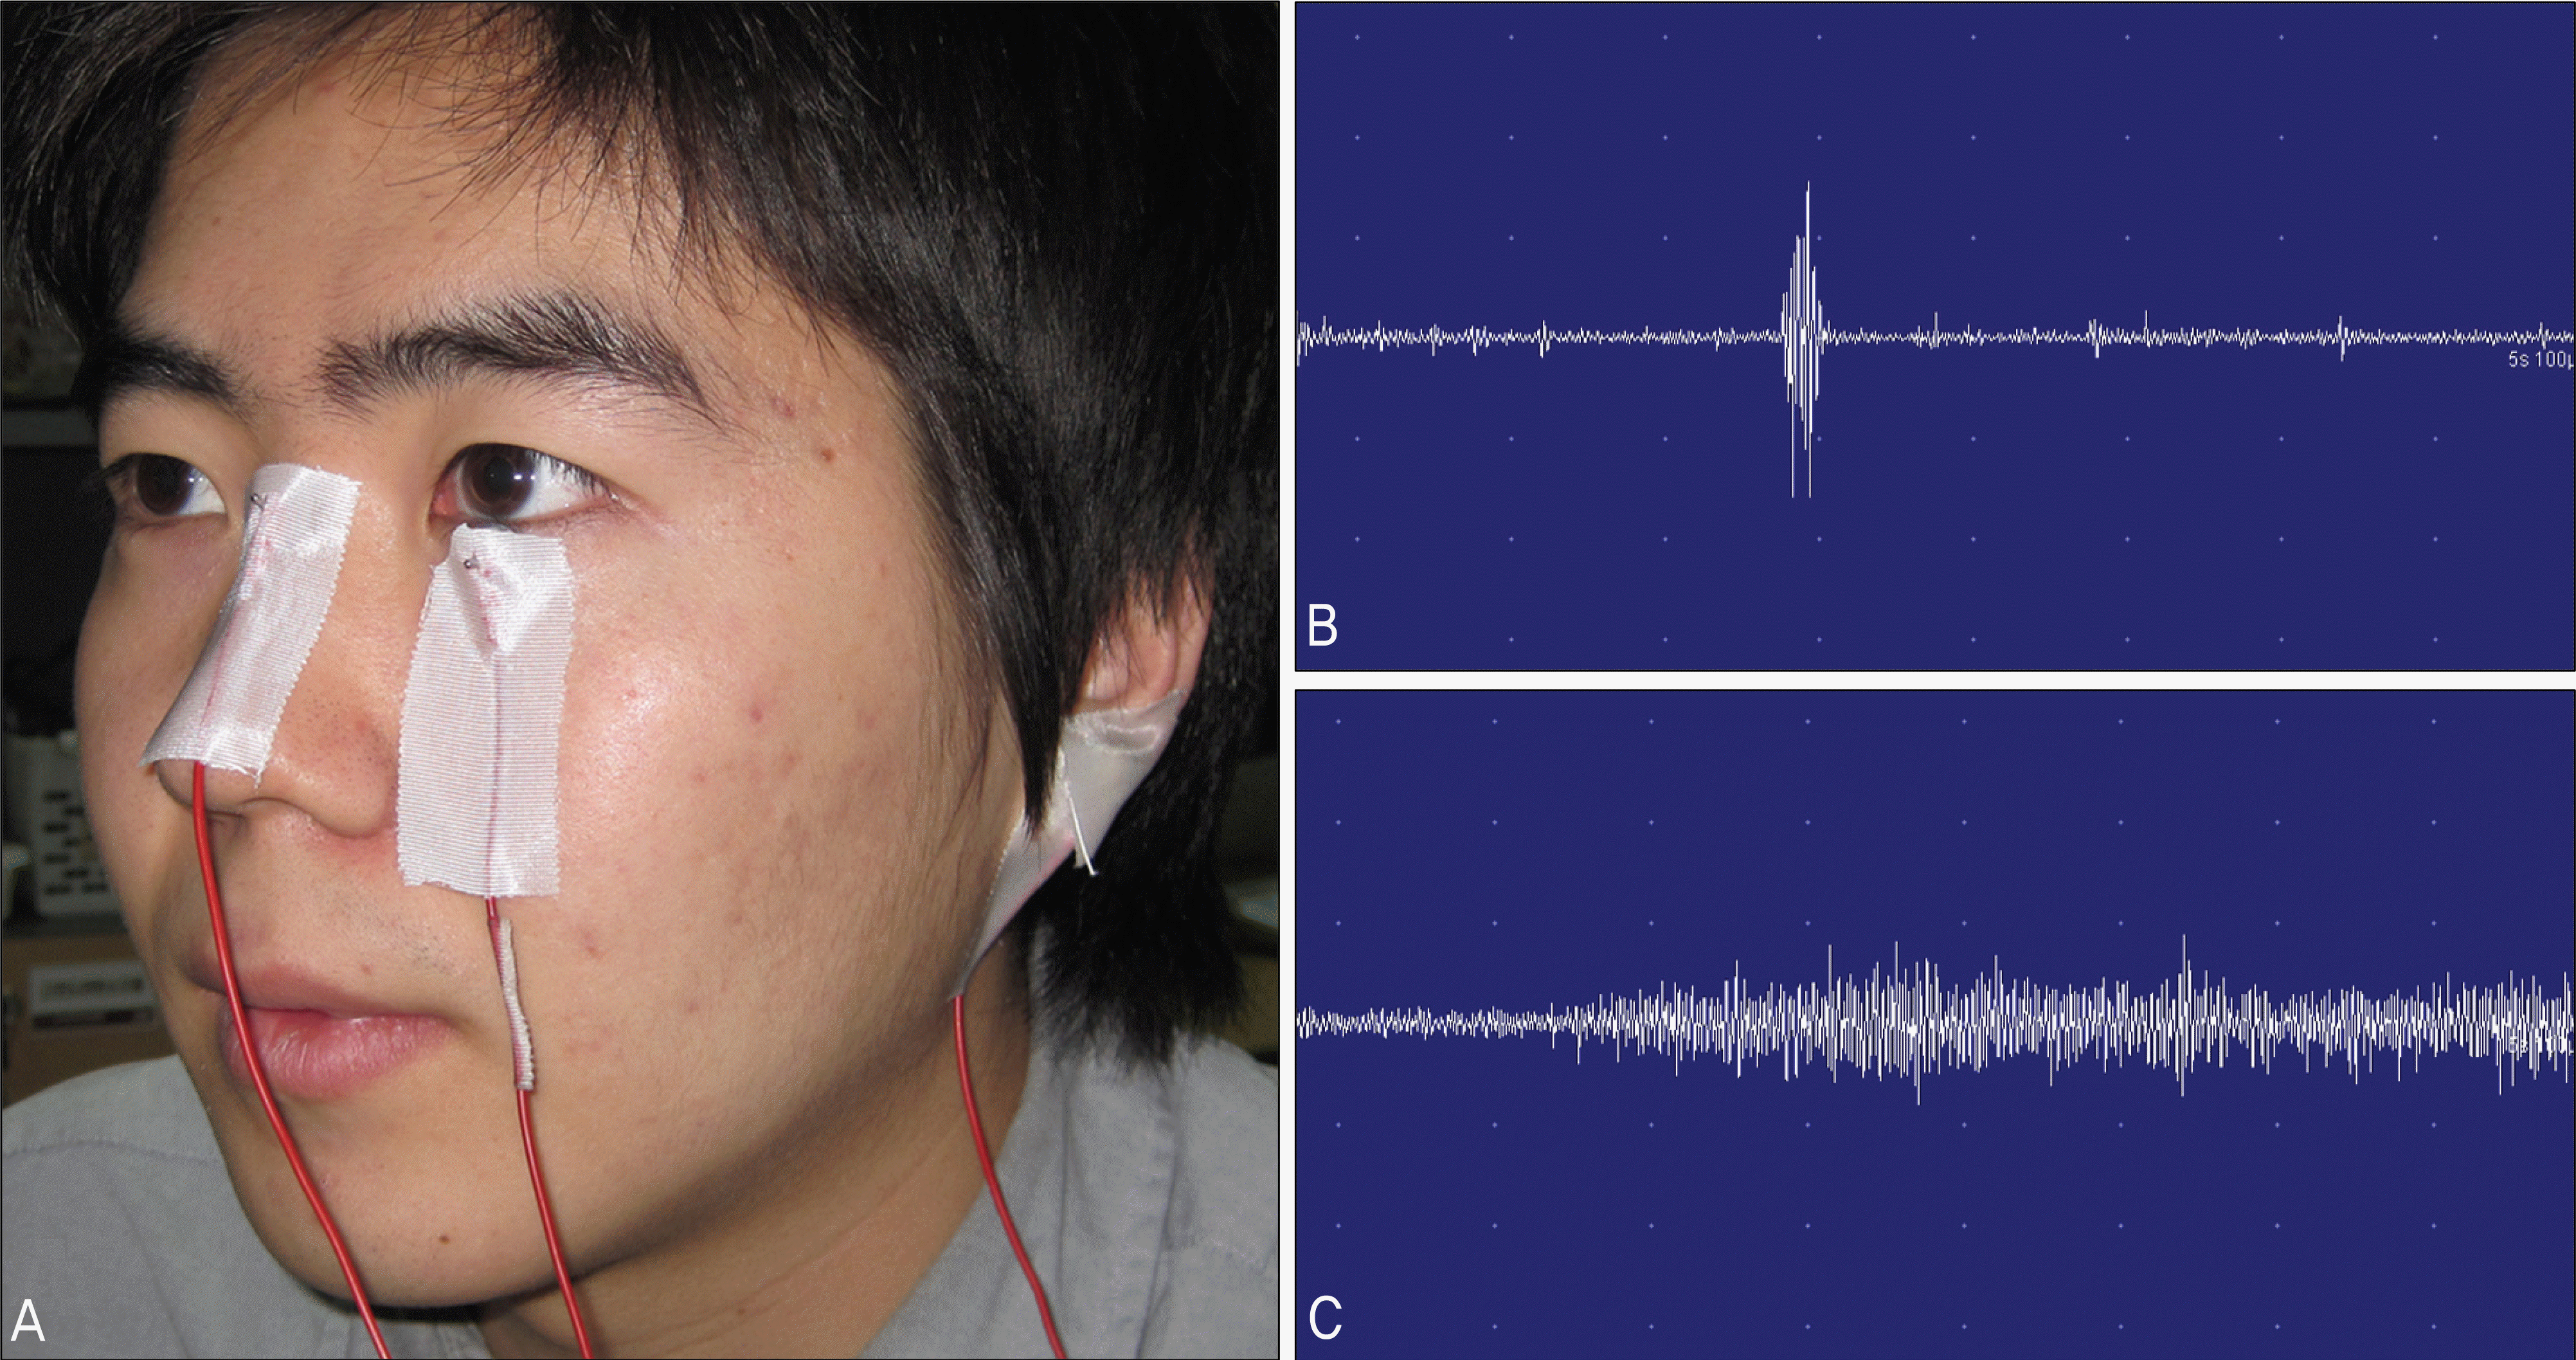
 | Figure 2.(A) The surface electromyography (EMG) of orbucularis oculi muscle. (B) The wave pattern of EMG while a subject blinks. (C) The wave pattern of EMG while a subject squints. |
Table 1.
Questionnaire for evaluating ocular fatigue
| |
None |
Mild |
Moderate |
Severe |
|||
|---|---|---|---|---|---|---|---|
| | 0 | 1 | 2 | 3 | 4 | 5 | 6 |
| Tired eyes | |||||||
| Sore/aching eyes | |||||||
| Irritated eyes | |||||||
| Watery eyes | |||||||
| Dry eyes | |||||||
| Eyestrain | |||||||
| Hot/burning eyes | |||||||
| Blurred vision | |||||||
| Difficulty focusing | |||||||
| Vision discomfort | |||||||
Table 2.
The results of evaluation for ocular fatigue before and after the visual task
| | Pre | Post | p | |
|---|---|---|---|---|
| Tear breakup time (sec) | 7.47 ± 3.15 | 5.54 ± 2.89 | 0.001 | |
| Maximal blinking interval (sec) | 23.12 ± 15.52 | 17.09 ± 14.39 | 0.011 | |
| Ocular surface temperature (˚ C) | 34.16 ± 0.49 | 34.44 ± 0.40 | 0.041 | |
| Conjunctival hyperemia | Nasal | 20.00 ± 7.56 | 22.00 ± 7.75 | 0.083 |
| Temporal | 22.67 ± 7.99 | 22.00 ± 7.75 | 0.157 | |
| Fusional convergence* | Break point | 20.06 ± 11.45 | 19.27 ± 10.34 | 0.388 |
| Recovery point | 11.60 ± 6.10 | 11.40 ± 4.68 | 0.615 | |
| Fusional divergence* | Break point | 9.60 ± 4.37 | 9.73 ± 4.90 | 0.752 |
| Recovery point | 7.56 ± 3.07 | 7.87 ± 4.44 | 0.722 | |
| VEP) | Latency (sec) | 99.9 ± 9.36 | 98.53 ± 10.44 | 0.31 |
| Latency (sec) VEP Amplitude (µV) | 4.42 ± 3.36 | 4.11 ± 2.73 | 0.463 | |
| Amplitude of surface EMG (µV/sec) | 11.02 ± 2.50 | 11.23 ± 5.53 | 0.441 | |


 PDF
PDF ePub
ePub Citation
 Print
Print


 XML Download