

 PDF
PDF ePub
ePub Citation
 Print
Print


Abstract
Purpose
To compare the performance of glaucoma diagnosis according to the macular and peripapillary retinal nerve fiber layer (RNFL) thicknesses, as determined by spectral domain optical coherence tomography (OCT).
Methods
Ninety-six normal, 63 early glaucoma and 37 moderate to advanced glaucomatous eyes were imaged by Cirrus OCT. The areas under the receiver operating characteristics curves (AUCs) of macular and RNFL thicknesses were calculated for discrimination of normal and glaucomatous eyes. The sensitivity and specificity of normative classification of each parameter were assessed.
Results
The glaucoma diagnostic capability determined by AUC was greater when based on the peripapillary RNFL than the macular thickness (0.914, 0.775, p<0.001). Both the early and the moderate-to-advanced group showed higher AUCs in peripapillary RNFL thickness (early glaucoma group; 0.870, 0.670, p<0.001, moderate to advanced glaucoma group; 0.990, 0.954, p=0.03). The inferior outer sector of macular thickness showed highest sensitivity among the parameters (58%).
Figures and Tables
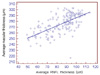 | Figure 1The correlation between average macular and peripapillary retinal nerve fiber layer thickness (µm) measured by Cirrus spectral domain optical coherence tomography.
|
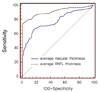 | Figure 2The receiver operating characteristic curve of average macular and peripapillary retinal nerve fiber layer thickness for discrimination between normal (96 eyes) and glaucomatous eyes (100 eyes). Sensitivities and specificities were described as percentage (%).
|
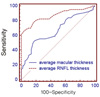 | Figure 3The receiver operating characteristic curve of average macular and peripapillary retinal nerve fiber layer thickness for discrimination between normal (96 eyes) and early glaucomatous eyes (63 eyes). Sensitivities and specificities were described as percentage (%).
|
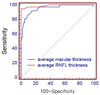 | Figure 4The receiver operating characteristic curve of average macular and peripapillary retinal nerve fiber layer thickness for discrimination between normal (96 eyes) and moderate to advanced glaucomatous eyes (37 eyes). Sensitivities and spcificities were described as percentage (%).
|
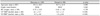
Table 2
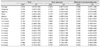
Macular thickness of normal and glaucomatous eyes in 9 sectors as well as average determined by Cirrus spectral domain optical coherence tomography
![]()
Table 3
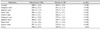
Retinal nerve fiber layer thickness of normal and glaucomatous eyes in 4 quadrants, 12 clock hour sectors as well as average determined by Cirrus spectral domain optical coherence tomography
![]()
Table 4
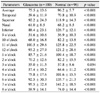
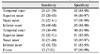
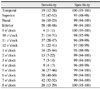
The area under receiver operator characteristics curve (AUC) and confidence interval (CI) of macular thickness in 9 sectors as well as average for discrimination of glaucoma from normal eyes
![]()
Table 5
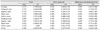
The area under receiver operator characteristics curve (AUC) and confidence interval (CI) of retinal nerve fiber layer thickness in 4 quadrants, 12 sectors, as well as average for discrimination of glaucoma from normal eyes
![]()
References
1. Quigley HA, Katz J, Derick RJ, et al. An evaluation of optic disc and nerve fiber layer examinations in monitoring progression of early glaucoma damage. Ophthalmology. 1992. 99:19–28.
2. Sommer A, Katz J, Quigley HA, et al. Clinically detectable nerve fiber atrophy precedes the onset of glaucomatous field loss. Arch Ophthalmol. 1991. 109:77–83.
3. Zeyen TG, Caprioli J. Progression of disc and field damage in early glaucoma. Arch Ophthalmol. 1993. 111:62–65.
4. Burgansky-Eliash Z, Wollstein G, Chu T, et al. Optical coherence tomography machine learning classifiers for glaucoma detection: a preliminary study. Invest Ophthalmol Vis Sci. 2005. 46:4147–4152.
5. Huang ML, Chen HY. Development and comparison of automated classifiers for glaucoma diagnosis using Stratus optical coherence tomography. Invest Ophthalmol Vis Sci. 2005. 46:4121–4129.
6. Kanamori A, Nagai-Kusuhara A, Escano MF, et al. Comparison of confocal scanning laser ophthalmoscopy, scanning laser polarimetry and optical coherence tomography to discriminate ocular hypertension and glaucoma at an early stage. Graefes Arch Clin Exp Ophthalmol. 2006. 244:58–68.
7. Lalezary M, Medeiros FA, Weinreb RN, et al. Baseline optical coherence tomography predicts the development of glaucomatous change in glaucoma suspects. Am J Ophthalmol. 2006. 142:576–582.
8. Leung CK, Chan WM, Yung WH, et al. Comparison of macular and peripapillary measurements for the detection of glaucoma: an optical coherence tomography study. Ophthalmology. 2005. 112:391–400.
9. Manassakorn A, Nouri-Mahdavi K, Caprioli J. Comparison of retinal nerve fiber layer thickness and optic disk algorithms with optical coherence tomography to detect glaucoma. Am J Ophthalmol. 2006. 141:105–115.
10. Medeiros FA, Zangwill LM, Bowd C, et al. Evaluation of retinal nerve fiber layer, optic nerve head, and macular thickness measurements for glaucoma detection using optical coherence tomography. Am J Ophthalmol. 2005. 139:44–55.
11. Naithani P, Sihota R, Sony P, et al. Evaluation of optical coherence tomography and heidelberg retinal tomography parameters in detecting early and moderate glaucoma. Invest Ophthalmol Vis Sci. 2007. 48:3138–3145.
12. Nouri-Mahdavi K, Nikkhou K, Hoffman DC, et al. Detection of early glaucoma with optical coherence tomography (StratusOCT). J Glaucoma. 2008. 17:183–188.
13. Parikh RS, Parikh S, Sekhar GC, et al. Diagnostic capability of optical coherence tomography (Stratus OCT 3) in early glaucoma. Ophthalmology. 2007. 114:2238–2343.
14. Sihota R, Sony P, Gupta V, et al. Comparing glaucomatous optic neuropathy in primary open angle and chronic primary angle closure glaucoma eyes by optical coherence tomography. Ophthalmic Physiol Opt. 2005. 25:408–415.
15. Ojima T, Tanabe T, Hangai M, et al. Measurement of retinal nerve fiber layer thickness and macular volume for glaucoma detection using optical coherence tomography. Jpn J Ophthalmol. 2007. 51:197–203.
16. Tan O, Li G, Lu AT, et al. Mapping of macular substructures with optical coherence tomography for glaucoma diagnosis. Ophthalmology. 2008. 115:949–956.
17. Ishikawa H, Stein DM, Wollstein G, et al. Macular segmentation with optical coherence tomography. Invest Ophthalmol Vis Sci. 2005. 46:2012–2017.
18. Zeimer R, Asrani S, Zou S, et al. Quantitative detection of glaucomatous damage at the posterior pole by retinal thickness mapping. A pilot study. Ophthalmology. 1998. 105:224–231.
19. Greenfield DS, Bagga H, Knighton RW. Macular thickness changes in glaucomatous optic neuropathy detected using optical coherence tomography. Arch Ophthalmol. 2003. 121:41–46.
20. Park SB, Sung KR, Kang SY, et al. Comparison of glaucoma diagnostic capabilities of Cirrus HD and Stratus optical coherence tomography. Arch Ophthalmol. 2009. 127:1603–1609.
21. Hodapp E, Parrish RK II, Anderson DR. Clinical decisions in glaucoma. 1993. St Louis: The CV Mosby Co;52–61.
22. Mills RP, Budenz DL, Lee PP, et al. Categorizing the stage of glaucoma from pre-diagnosis to end-stage disease. Am J Ophthalmol. 2006. 141:24–30.
23. DeLong ER, DeLong DM, Clarke-Pearson DL. Comparing the areas under two or more correlated receiver operating characteristic curves: a nonparametric approach. Biometrics. 1988. 44:837–845.
24. Wollstein G, Ishikawa H, Wang J, et al. Comparison of three optical coherence tomography scanning areas for detection of glaucomatous damage. Am J Ophthalmol. 2005. 139:39–43.
25. Budenz DL, Michael A, Chang RT, et al. Sensitivity and specificity of the Stratus OCT for perimetric glaucoma. Ophthalmology. 2005. 112:3–9.
26. Bows C, Zangwill LM, Berry CC, et al. Detecting early glaucoma by assessment of retinal nerve fiber layer thickness and visual function. Invest Ophthalmol Vis Sci. 2001. 42:1993–2003.
27. Han K, Jun RM, Choi K. Comparison of RNFL Thickness Measured by Two Different Kind of OCT in NTG Patients. J Korean Ophthalmol Soc. 2009. 12:1853–1859.
 XML Download