Abstract
Purpose
To show Humphrey automated kinetic perimetry can be substituted for Goldmann perimetry, which has been used in the field of disability evaluation field, the differences of normal visual fields between two perimetries were evaluated.
Methods
Goldmann and Humphrey automated kinetic perimetries were performed simultaneously in 70 eyes of 35 normal healthy Koreans who had no specific ophthalmologic disease at 12 meridians; 0°, 30°, 60°, 90°, 120°, 150°, 180°, 210°, 240°, 270°, 300°, and 330°. The mean values of field in each case were compared. In addition, the corrected values were obtained through the calculation of the difference in the two maximal fields.
Results
The visual fields of Humphrey and Goldmann kinetic perimetries showed a similar oval shape, but the fields of Goldmann were statistically significantly wider than the Humphrey fields. As the values of Humphrey were compared with the original data of Goldmann, all values of the visual field were narrow.
Go to : 
References
1. Lee SC, Yu SY, Kwak HW. The study of normal visual fields using Goldmann module in OCTOPUS 101 automated perimetry in Koreans. J Korean Ophthalmol Soc. 2004; 45:1123–7.
2. Stewart WC, Shields MB. The peripheral visual field in glaucoma: Reevaluation in the age of automated perimetry. Surv Ophthalmol. 1991; 36:59–69.

3. Miller KN, Shields MB, Ollie AR. Automated kinetic perimetry with two peripheral isopters in glaucoma. Arch Ophthalmol. 1989; 107:1316–20.

4. Miller KN, Shields MB, Ollie AR. Peripheral visual field testing by automated kinetic perimetry in glaucoma. Arch Ophthalmol. 1988; 106:202–6.
5. Liu GT, Volpe NJ, Galetta SL. Neuro-Ophthalmology, Diagnosis and Management. Philadelphia: Saunders Co.;2001. p. 46–54.
6. Zingirian M, Gandolfo E, Orciuolo M. Automation of the Goldmann perimeter. Doc Ophthalmol Proc Ser. 1983; 42:103–7.

7. Kim DK, Choi KS, Park SH. Usefulness of the Binocular Double Vision Field Using Kinetic Automated Perimetry in Diplopia. J Korean Ophthalmol Soc. 2005; 46:1196–203.
8. Kim MH, Lee CS. Studies on the normal visual field of Koreans. J Korean Ophthalmol Soc. 1983; 24:367–78.
Go to : 
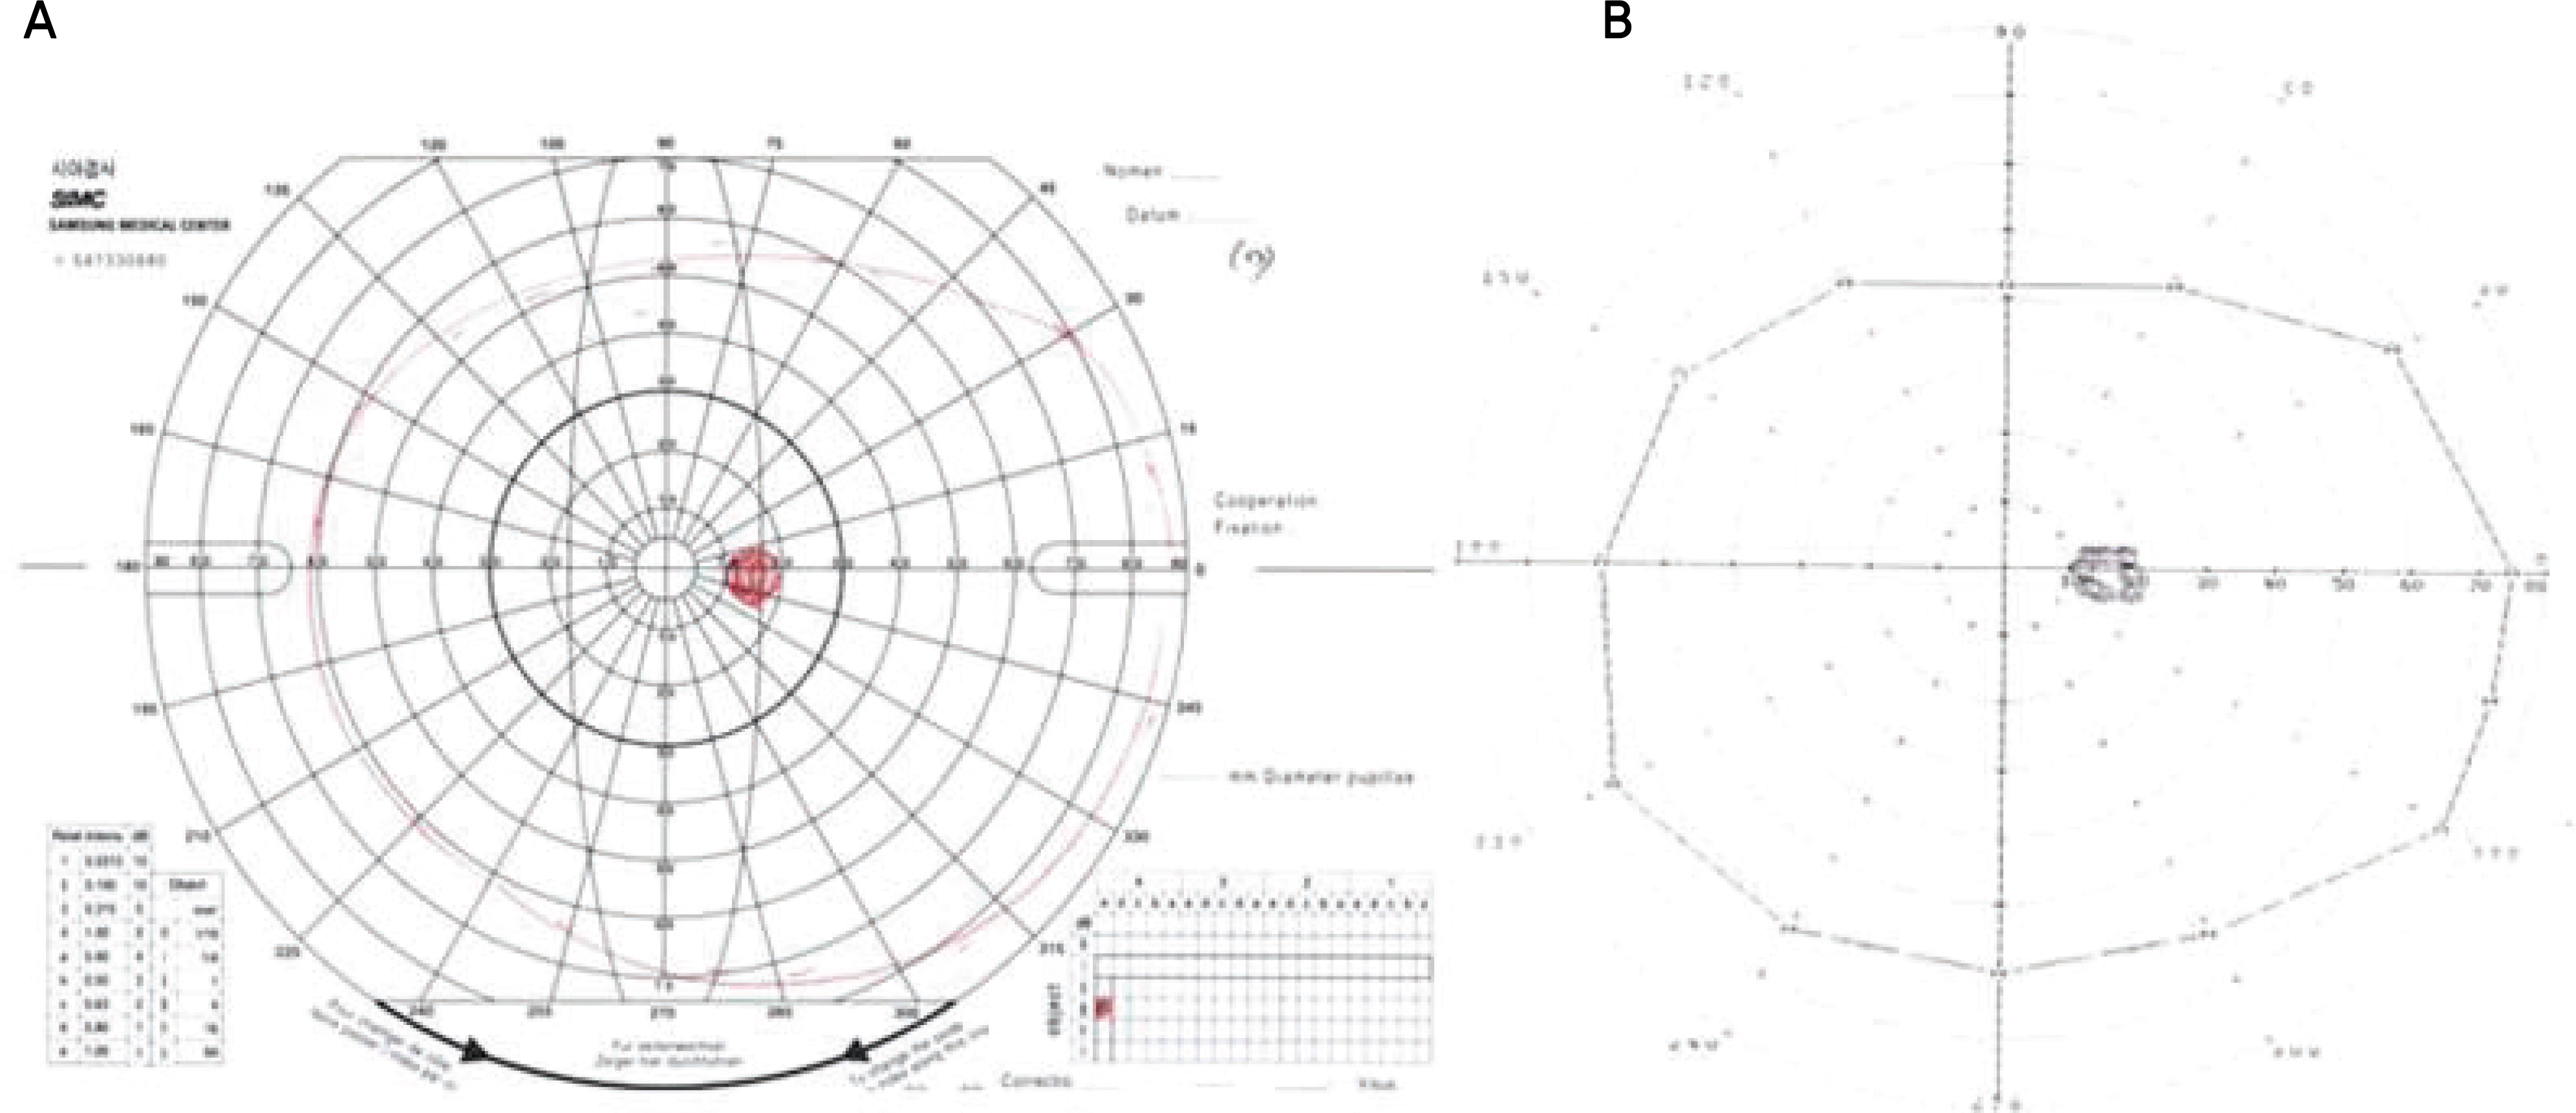
 | Figure 2.Comparison of Goldmann perimetry and Humphrey kinetic perimetry, right eye (A) and left eye (B). |
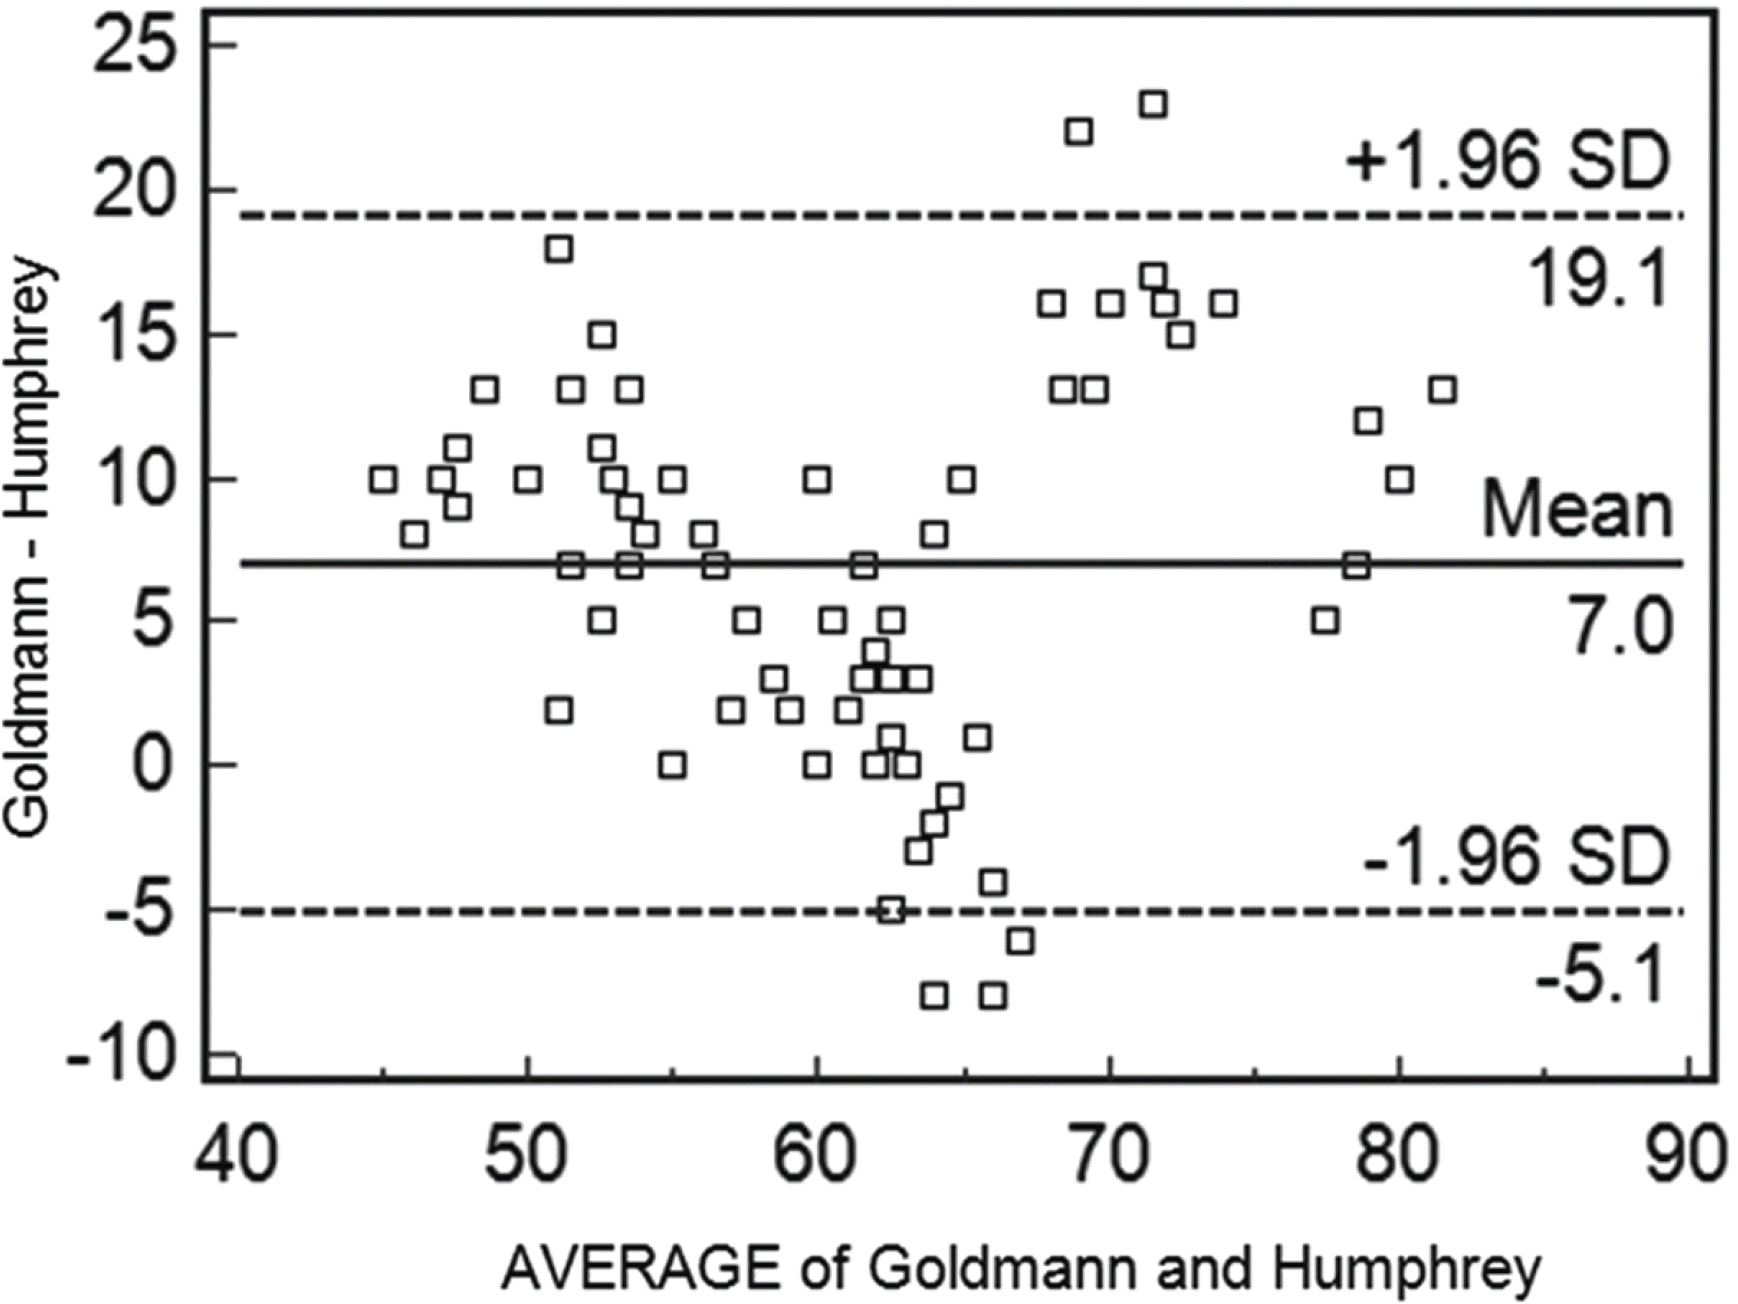
 | Figure 3.Bland-Altman plot showing the mean values and the error allowance limits of the difference between the values of Goldmann visual field and Humphery visual field. |
Table 1.
Comparison between Goldmann and Humphrey kinetic perimetries (Right eye)
| Right (°) | GVF* | HVF† | P‡ |
|---|---|---|---|
| 0 | 85.0±2.3 | 75.0±0.6 | .629 |
| 30 | 79.0±2.5 | 62.0±2.4 | .078 |
| 60 | 57.0±2.1 | 47.9±2.1 | .752 |
| 90 | 54.0±2.9 | 42.0±0.7 | .698 |
| 120 | 56.3±2.0 | 48.0±1.7 | .651 |
| 150 | 59.6±0.8 | 54.6±3.4 | .346 |
| 180 | 60.0±1.6 | 59.0±5.1 | <.001 |
| 210 | 63.2±1.0 | 63.0±4.4 | <.001 |
| 240 | 63.7±1.6 | 62.0±2.7 | .004 |
| 270 | 66.0±3.0 | 59.5±1.5 | .413 |
| 300 | 76.6±2.5 | 65.0±1.5 | .653 |
| 330 | 80.0±2.8 | 75.0±1.6 | .317 |
Table 2.
Comparison between Goldmann and Humphrey kinetic perimetries (Left eye)
| Left (°) | GVF* | HVF† | P‡ |
|---|---|---|---|
| 0 | 60.0±1.1 | 59.3±3.9 | .014 |
| 30 | 58.1±2.0 | 55.8±3.7 | .233 |
| 60 | 53.8±1.4 | 48.9±1.2 | .552 |
| 90 | 53.1±3.4 | 41.1±1.0 | .697 |
| 120 | 61.0±3.1 | 49.5±2.0 | .688 |
| 150 | 74.2±2.3 | 64.0±1.8 | .598 |
| 180 | 83.2±2.3 | 76.1±1.5 | .468 |
| 210 | 79.7±1.9 | 74.4±1.7 | .203 |
| 240 | 76.6±2.0 | 63.8±1.8 | .591 |
| 270 | 69.1±2.2 | 59.6±1.8 | .564 |
| 300 | 64.1±2.8 | 58.5±1.9 | .325 |
| 330 | 60.0±2.0 | 58.1±3.0 | .029 |
Table 3.
Comparison of data from Goldmann, Humphrey kinetic perimetries and McBride's reference values (Right eye)
| Right | GVF* | HVF† | McBride‡ |
|---|---|---|---|
| Temporal | 85.0±2.3 | 75.0±0.6 | 85 |
| Superotemporal | 68.0±1.8 | 55.0±2.3 | 55 |
| Superior | 54.0±2.9 | 42.0±0.7 | 45 |
| Superonasal | 58.0±1.1 | 51.3±2.6 | 55 |
| Nasal | 60.0±1.6 | 59.6±0.8 | 60 |
| Inferonasal | 63.4±1.1 | 62.5±3.6 | 50 |
| Inferior | 66.0±3.0 | 59.5±1.5 | 65 |
| Inferotemporal | 78.5±2.1 | 70.0±1.6 | 65 |
| Total | 532.9±11.2 | 474.9±13.7 | ≥ 500 |
Table 4.
Comparison of data from Goldmann, Humphrey kinetic perimetries and McBride's reference values (Left eye)
| Left | GVF* | HVF† | McBride‡ |
|---|---|---|---|
| Nasal | 60.0±1.1 | 59.3±3.9 | 60 |
| Superonasal | 56.0±1.3 | 52.4±2.5 | 55 |
| Superior | 53.1±3.4 | 41.1±1.0 | 45 |
| Superotemporal | 67.6±2.0 | 56.8±1.9 | 55 |
| Temporal | 83.2±2.3 | 76.1±1.5 | 85 |
| Inferotemporal | 78.1±1.7 | 69.1±1.8 | 65 |
| Inferior | 69.1±2.2 | 59.6±1.8 | 65 |
| Inferonasal | 62.0±2.1 | 58.3±2.5 | 50 |
| Total | 529.1±9.9 | 472.7±16.9 | ≥ 500 |


 PDF
PDF ePub
ePub Citation
 Print
Print


 XML Download