Abstract
Purpose
To investigate the clinical potential of multifocal electroretinography (mf-ERG) for the evaluation of residual retinal function in retinitis pigmentosa (RP).
Methods
From a group of 41 patients with RP examined for full-field and mf-ERGs, 24 patients were selected in whom the full-field ERGs were non-detectable. Data from the mf-ERGs of this group were reviewed retrospectively. Patients were divided into two groups based on best corrected visual acuity (BCVA); Group A, with a BCVA of less than 0.5, and group B with a BCVA greater than 0.5. The amplitudes and implicit times of Ring 1 and Ring 2 among six concentric rings were measured for comparison between mf-ERG groups.
Results
In the mf-ERGs, the amplitudes of Ring 1 and Ring 2 were reduced and implicit time was delayed in all 48 eyes of 24 patients in whom scotopic and photopic responses were non-detectable in full-field ERGs, whereas, there were no detectable responses in Rings 3 thru 6. There was a greater reduction in amplitude and an increased delay in implicit time in group A.
Go to : 
References
1. Berson EL. Retinitis pigmentosa and allied retinal diseases: electrophysiologic findings. Trans Sect Ophthalmol Am Acad Ophthalmol Otolaryngol. 1976; 81:659–66.
2. Berson EL, Sandberg MA, Rosner B, et al. Natural course of retinitis pigmentosa over a three-year interval. Am J Ophthalmol. 1985; 99:240–51.

3. Shin WK, Ohn YH, Shin H, Lee HK. Three cases of atypical retinitis pigmentosa: Diagnostic value of electroretinography. J Korean Ophthalmol Soc. 1994; 35:1295–9.
4. Ryan SJ. Retinitis pigmentosa and allied disorders. In: Hinton DR ed. Retina. 4th ed.California: Mosby;2006. 1:chap.17.
5. Berson EL. Long-term visual prognoses in patients with retinitis pigmentosa: The Ludwig von Sallmann lecture. Exp Eye Res. 2007; 85:7–14.

6. Gränse L, Ponjavic V, Andrė asson S. Full-field ERG, multifocal ERG and multifocal VEP in patients with retinitis pigmentosa and residual central visual fields. Acta Ophthalmol Scand. 2004; 82:701–6.

7. Gerth C, Wright T, Hė on E, Westall CA. Assessment of central retinal function in patients with advanced retinitis pigmentosa. Invest Ophthalmol Vis Sci. 2007; 48:1312–8.

8. Ohn YH, Ahn YS. Clinical applications of multifocal eletroretinography. J Korean Ophthalmol Soc. 2002; 43:1901–17.
9. Frank MH, Sayegh MH. Immunomodulatory functions of mesenchymal stem cells. Lancet. 2004; 363:1439–41.

10. Berson EL, Rosner B, Simonoff E. Risk factors for genetic typing and detection in retinitis pigmentosa. Am J Ophthalmol. 1980; 89:763–75.

11. Li ZY, Possin DE, Milam AH. Histopathology of bone spicule pigmentation in retinitis pigmentosa. Ophthalmology. 1995; 102:805–16.

12. Carr RE, Noble KG. Retinitis Pigmentosa. Ophthalmology. 1981; 88:169–72.
13. Seeliger M, Kretschmann U, Zrenner E. Multifocal electroretinography in retinitis pigmentosa. Am J Ophthalmol. 1998; 125:214–26.

14. Sutter EE, Tran D. The field topography of ERG components in man-I. The photopic luminance response. Vision Res. 1992; 32:433–46.

15. Hood DC. Assessing retinal function with the multifocal technique. Prog Retin Eye Res. 2000; 19:607–46.

16. Nagy D, Schönfisch B, Zrenner E, Jägle H. Long-term follow-up of retinitis pigmentosa patients with multifocal electroretinography. Invest Ophthalmol Vis Sci. 2008; 49:4664–71.

17. Curcio CA, Sloan KR, Kalina RE, Hendrickson AE. Human photoreceptor topography. J Comp Neurol. 1990; 292:497–523.

18. Marmor MF, Hood D, Keating D, et al. Guidelines for basic multifocal electroretinography(mfERG). Doc Ophthalmol. 2003; 106:105–15.
19. Hood DC, Seiple W, Holopigian K, Greenstein V. A comparison of the components of the multifocal and full-field ERGs. Vis Neurosci. 1997; 14:533–44.

20. Hood DC, Frishman LJ, Saszik S, Viswanathan S. Retinal origins of the primate multifocal ERG: implications for the human response. Invest Ophthalmol Vis Sci. 2002; 43:1673–85.
Go to : 
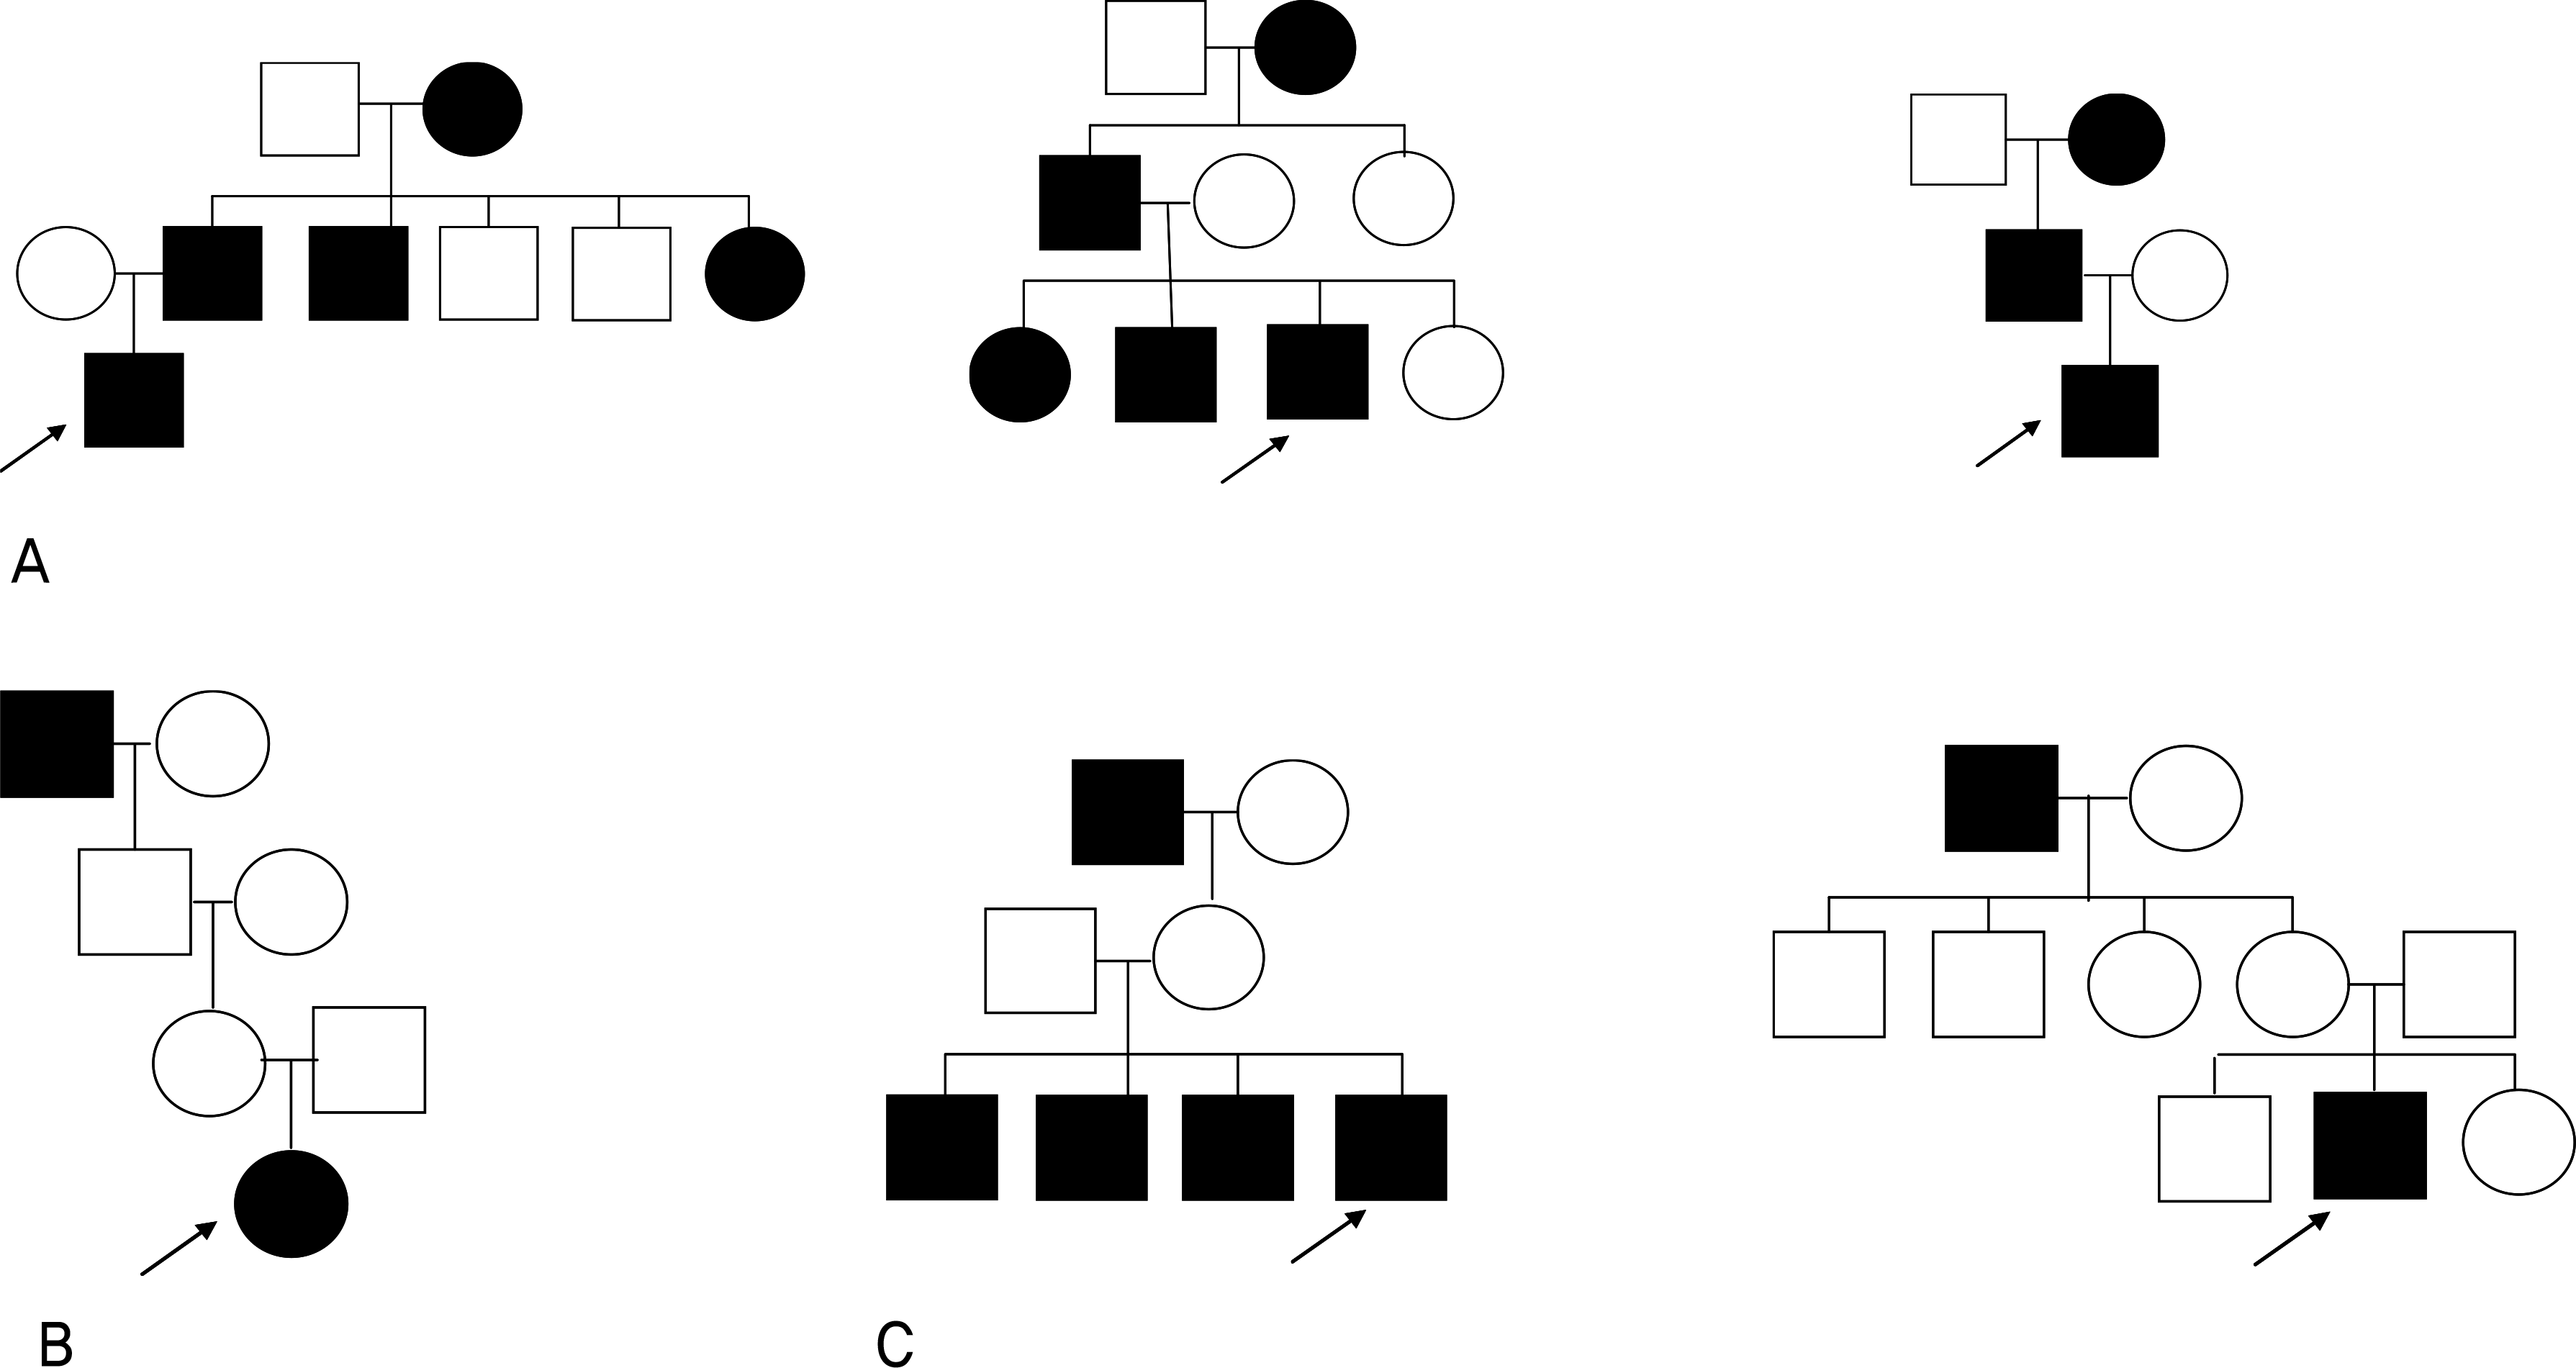
 | Figure 1.The pedigree charts of the subjects' families, A) Three families represented autosomal dominant inheritance, B) One family represented autosomal recessive trait, C) Two families represented X-linked recessive trait. |
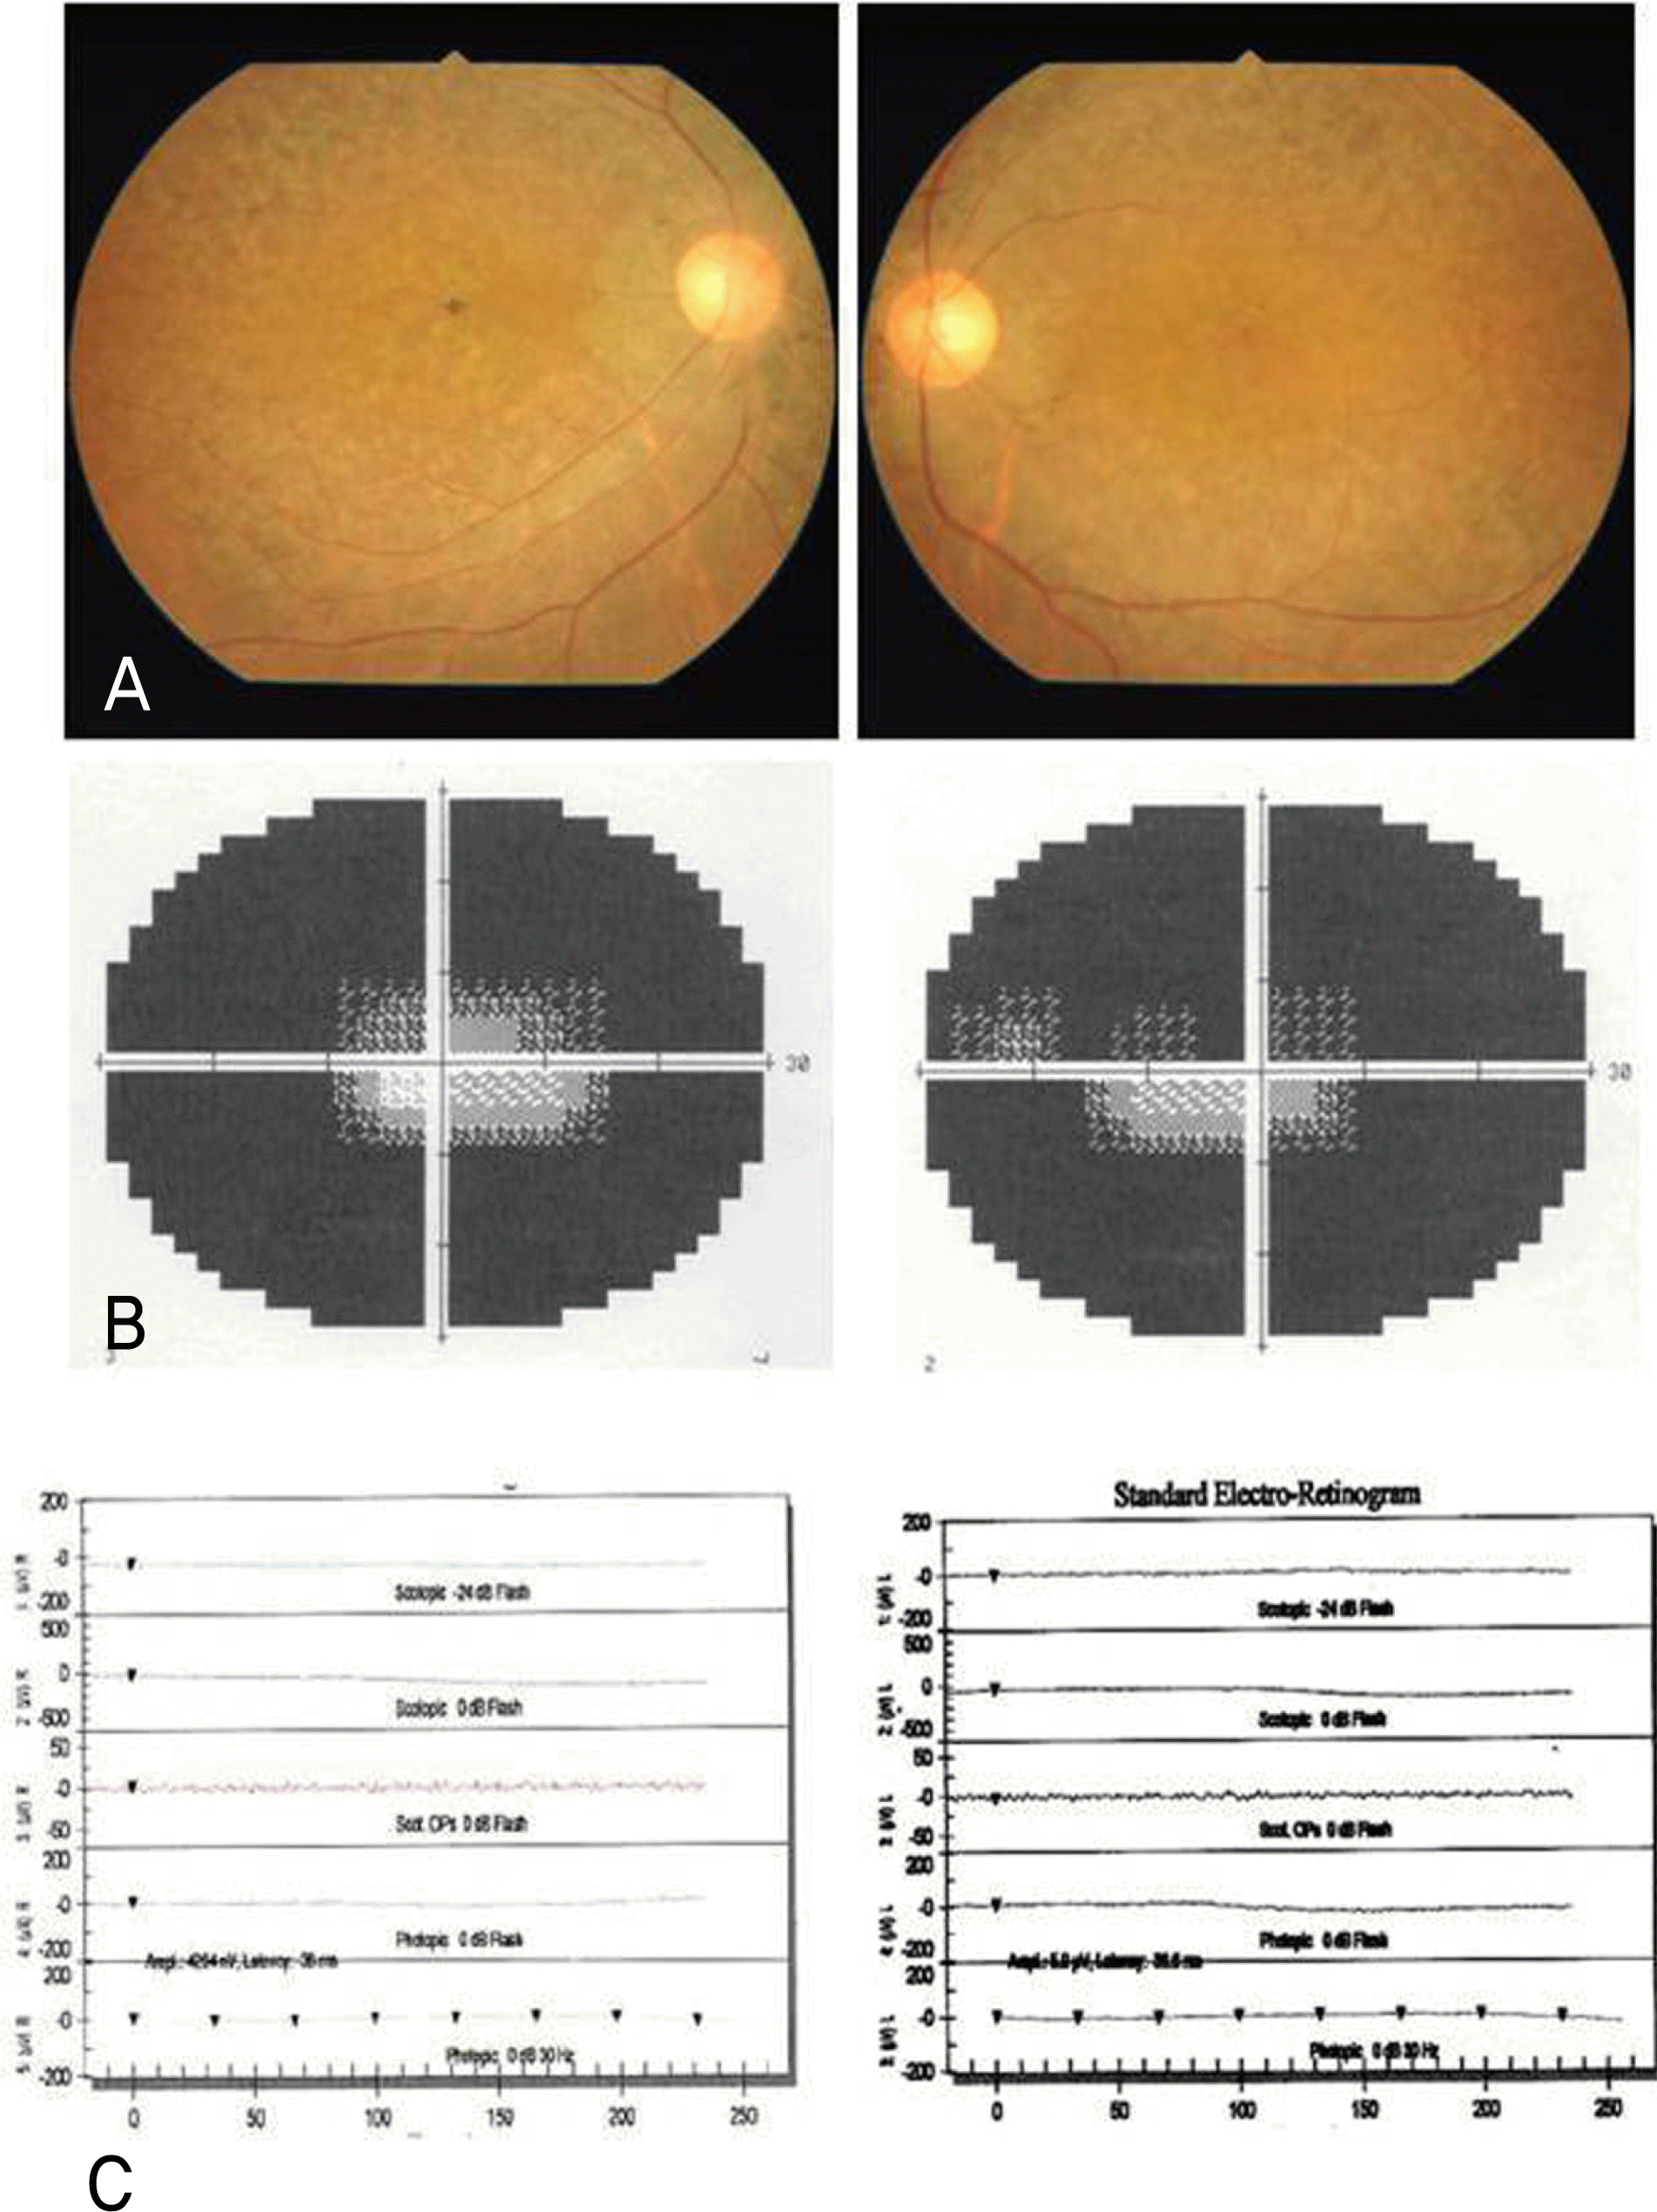
 | Figure 2.A case of a 52-year-old man whose visual acuity was 0.7 in both eyes. A) Typical fundus findings of retinitis pigmentosa. B) Humphrey perimetry (central 30–2 threshold test) discloses the scotomas of affected areas. Note that only central tunnel vision was remained. C) Rod and Cone response were undetectable in full-field ERGs. Note the 30 Hz flicker response (below 10 μV; noise level). |
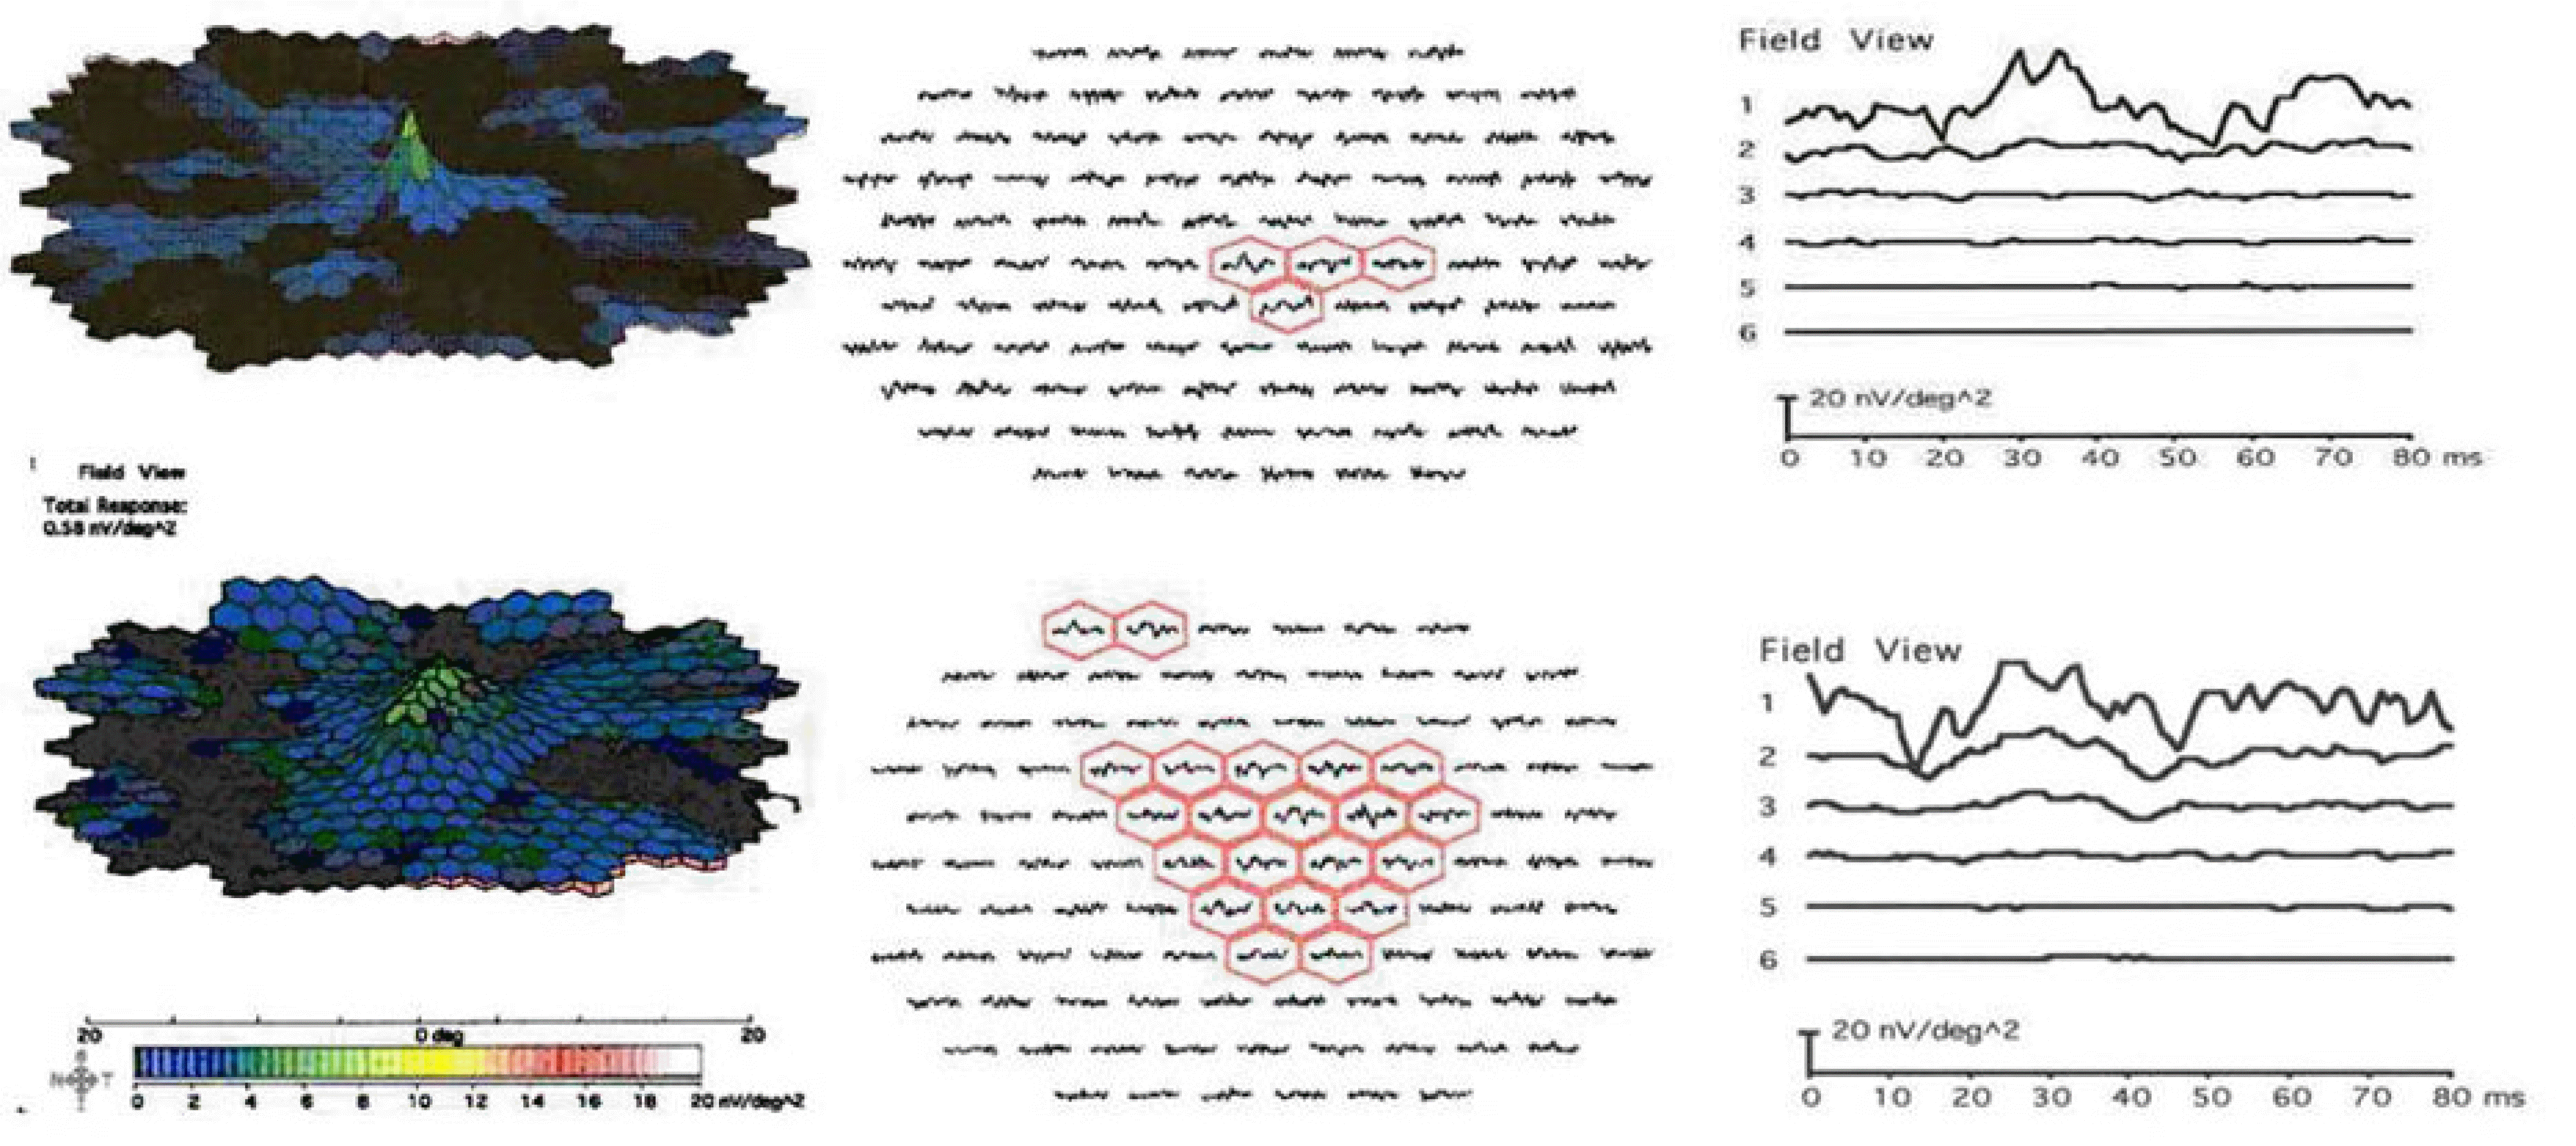
 | Figure 3.Result of multifocal electoretinogram (mf-ERG) of the same patient in Figure 1 (Right eye, first row; Left eye, second row) Three-dimensional plot of response densities, Ring averages in response density scale, Trace arrays (From left to right column). Sizable ERGs were detected within the central ring 1 and ring 2 using mf ERG techniques (The Amplitude of the red hexagons >1 nV, others <1 nV, noise level). Note that the response pattern is different between both eyes of which visual acuity is the same. |
Table 1.
Comparison of amplitude and latency of average N1, P1 responses between study group* and normal control
|
Ring 1 |
Ring 2 |
|||||||
|---|---|---|---|---|---|---|---|---|
|
N1‡ |
P1§ |
N1‡ |
P1§ |
|||||
| Amplitude(nV/deg2) | Latency(msec) | Amplitude | Latency | Amplitude | Latency | Amplitude | Latency | |
| Study group* | −6.35 | 17.02 | 8.504 | 31.78 | −2.273 | 17.10 | 3.56 | 31.82 |
| Normal controls† | −53.4 | 16.3 | 109.9 | 30.0 | −33.6 | 15.3 | 60.9 | 29.3 |
Table 2.
Comparison of average responses (N1, P1) between Group A and B in ring 1 and ring 2. Reduced amplitudes and delayed implicit times are noted in group A compared with Group B
|
Ring 1 |
Ring 2 |
|||||||
|---|---|---|---|---|---|---|---|---|
|
N1‡ |
P1§ |
N1‡ |
P1§ |
|||||
| Amplitude | latency | Amplitude | latency | Amplitude | latency | Amplitude | latency | |
| Group A* | −6.15 | 17.60 | 3.74 | 32.31 | −1.83 | 17.74 | 1.97 | 32.24 |
| Group B† | −6.58 | 16.34 | 14.13 | 31.15 | −2.80 | 16.37 | 5.31 | 31.33 |
| P | 0.037 | 0.029 | 0.032 | 0.039 | 0.006 | 0.055 | 0.023 | 0.013 |
Table 3.
Correlation between best corrected visual acuity (BCVA) and average responses (N1, P1) in Ring 1 and Ring 2
|
Ring 1 |
Ring 2 |
|||||||
|---|---|---|---|---|---|---|---|---|
|
N1‡ |
P1§ |
N1‡ |
P1§ |
|||||
| Amplitude | latency | Amplitude | latency | Amplitude | latency | Amplitude | latency | |
| R* | 0.057 | 0.321† | −0.344† | 0.208 | 0.056 | 0.316† | −0.377† | 0.172 |
| P† | 0.700 | 0.026† | <0.001† | 0.157 | 0.705 | 0.029† | 0.01† | 0.243 |


 PDF
PDF ePub
ePub Citation
 Print
Print


 XML Download