

 PDF
PDF ePub
ePub Citation
 Print
Print


Abstract
Purpose
To evaluate and compare the diagnostic performance of Humphrey Matrix frequency doubling technology perimetry (Matrix) global indices with standard automated perimetry (SAP) for glaucoma discrimination.
Methods
Forty-seven healthy and 63 glaucomatous subjects were included in this study. Glaucoma was defined as having glaucomatous optic disc and glaucomatous visual field defect. Correlations of mean deviation (MD) and pattern standard deviation (PSD) between Matrix and SAP were evaluated. Areas under receiver operating characteristic curves (AUCs) for discriminating healthy from glaucoma, sensitivity, and cut-off value at fixed specificity of MD and PSD were determined in Matrix and SAP.
Results
MD and PSD from Matrix were highly correlated with SAP data in glaucomatous eyes (r =0.80, 0.69 p<0.001, <0.001). The AUCs of MD and PSD from Matrix (0.941, 0.921) were of comparable diagnostic capability to SAP data (0.876, 0.923, p=0.068, 0.927). The sensitivity at 90% specificity of MD was 67.9% in SAP, 76.4% in Matrix, with the cut off value of MD at 90% specificity at −3.10dB in SAP and −3.72dB in Matrix.
Conclusions
MD and PSD data from Matrix and SAP significantly correlated in glaucomatous eyes and showed similar diagnostic performance for discriminating healthy from glaucoma however, both MD and PSD are scaled differently on SAP and Matrix, which suggests that application of these parameters in a manner similar to that used in SAP should be employed with caution.
Go to : 
References
1. Quigley HA, Dunkelberger GR, Green WR. Chronic human glaucoma causing selectively greater loss of large optic nerve fibers. Ophthalmology. 1988; 95:357–63.

2. Brusini P, Busatto P. Frequency doubling perimetry in glaucoma early diagnosis. Acta Ophthalmol Scand Suppl. 1998; 23–4.
3. Cello KE, Nelson-Quigg JM, Johnson CA. Frequency doubling technology perimetry for detection of glaucomatous visual field loss. Am J Ophthalmol. 2000; 129:314–22.
4. Burnstein Y, Ellish NJ, Magbalon M, Higginbotham EJ. Comparison of frequency doubling perimetry with humphrey visual field analysis in a glaucoma practice. Am J Ophthalmol. 2000; 129:328–33.
5. Johnson CA, Samuels SJ. Screening for glaucomatous visual field loss with frequency-doubling perimetry. Invest Ophthalmol Vis Sci. 1997; 38:413–25.
6. Quigley HA. Identification of glaucoma-related visual field abnor-mality with the screening protocol of frequency doubling technology. Am J Ophthalmol. 1998; 125:819–29.
7. Sponsel WE, Arango S, Trigo Y, Mensah J. Clinical classification of glaucomatous visual field loss by frequency doubling perimetry. Am J Ophthalmol. 1998; 125:830–6.
8. Delgado MF, Nguyen NT, Cox TA, et al. Automated perimetry: a report by the American Academy of Ophthalmology. Ophthalmology. 2002; 109:2362–74.
9. Sample PA, Bosworth CF, Blumenthal EZ, et al. Visual function- specific perimetry for indirect comparison of different ganglion cell populations in glaucoma. Invest Ophthalmol Vis Sci. 2000; 41:1783–90.
10. Bowd C, Zangwill LM, Berry CC, et al. Detecting early glaucoma by assessment of retinal nerve fiber layer thickness and visual function. Invest Ophthalmol Vis Sci. 2001; 42:1993–2003.
11. Paczka JA, Friedman DS, Quigley HA, et al. Diagnostic capabilities of frequency-doubling technology, scanning laser polarimetry, and nerve fiber layer photographs to distinguish glaucomatous damage. Am J Ophthalmol. 2001; 131:188–97.
12. Artes PH, Hutchison DM, Nicolela MT, et al. Threshold and variability properties of matrix frequency-doubling technology and standard automated perimetry in glaucoma. Invest Ophthalmol Vis Sci. 2005; 46:2451–7.
13. Leeprechanon N, Giangiacomo A, Fontana H, et al. Frequency-doubling perimetry: comparison with standard automated perimetry to detect glaucoma. Am J Ophthalmol. 2007; 143:263–71.
14. Racette L, Medeiros FA, Zangwill LM, et al. Diagnostic accuracy of the Matrix 24-2 and original N-30 frequency-doubling technology tests compared with standard automated perimetry. Invest Ophthalmol Vis Sci. 2008; 49:954–60.
15. Burgansky-Eliash Z, Wollstein G, Patel A, et al. Glaucoma detection with matrix and standard achromatic perimetry. Br J Ophthalmol. 2007; 91:933–8.
16. Patel A, Wollstein G, Ishikawa H, Schuman JS. Comparison of visual field defects using matrix perimetry and standard achromatic perimetry. Ophthalmology. 2007; 114:480–7.
17. Spry PG, Hussin HM, Sparrow JM. Clinical evaluation of frequency doubling technology perimetry using the Humphrey Matrix 24-2 threshold strategy. Br J Ophthalmol. 2005; 89:1031–5.
18. Brusini P, Salvetat ML, Zeppieri M, Parisi L. Frequency doubling technology perimetry with the Humphrey Matrix 30-2 test. J Glaucoma. 2006; 15:77–83.
19. Mastropasqua L, Brusini P, Carpineto P, et al. Humphrey matrix frequency doubling technology perimetry and optical coherence tomography measurement of the retinal nerve fiber layer thickness in both normal and ocular hypertensive subjects. J Glaucoma. 2006; 15:328–35.
20. Hong S, Ahn H, Ha SJ, et al. Early glaucoma detection using the Humphrey Matrix Perimeter, GDx VCC, Stratus OCT, and retinal nerve fiber layer photography. Ophthalmology. 2007; 114:210–5.
21. Bozkurt B, Yilmaz PT, Irkec M. Relationship between Humphrey 30-2 SITA Standard Test, Matrix 30-2 threshold test, and Heidelberg retina tomograph in ocular hypertensive and glaucoma patients. J Glaucoma. 2008; 17:203–10.
22. Clement CI, Goldberg I, Healey PR, Graham S. Humphrey matrix frequency doubling perimetry for detection of visual field defects in open-angle glaucoma. Br J Ophthalmol. 2009; 93:582–8.
23. Cheon HC, Jeung WJ, Rho SH. The comparison of the matrix perimetry and humphrey standard perimetry in various patients group. J Korean Ophthalmol Soc. 2007; 48:678–65.
24. DeLong ER, DeLong DM, Clarke-Pearson DL. Comparing the areas under two or more correlated receiver operating characteristic curves: a nonparametric approach. Biometrics. 1988; 44:837–45.
Go to :
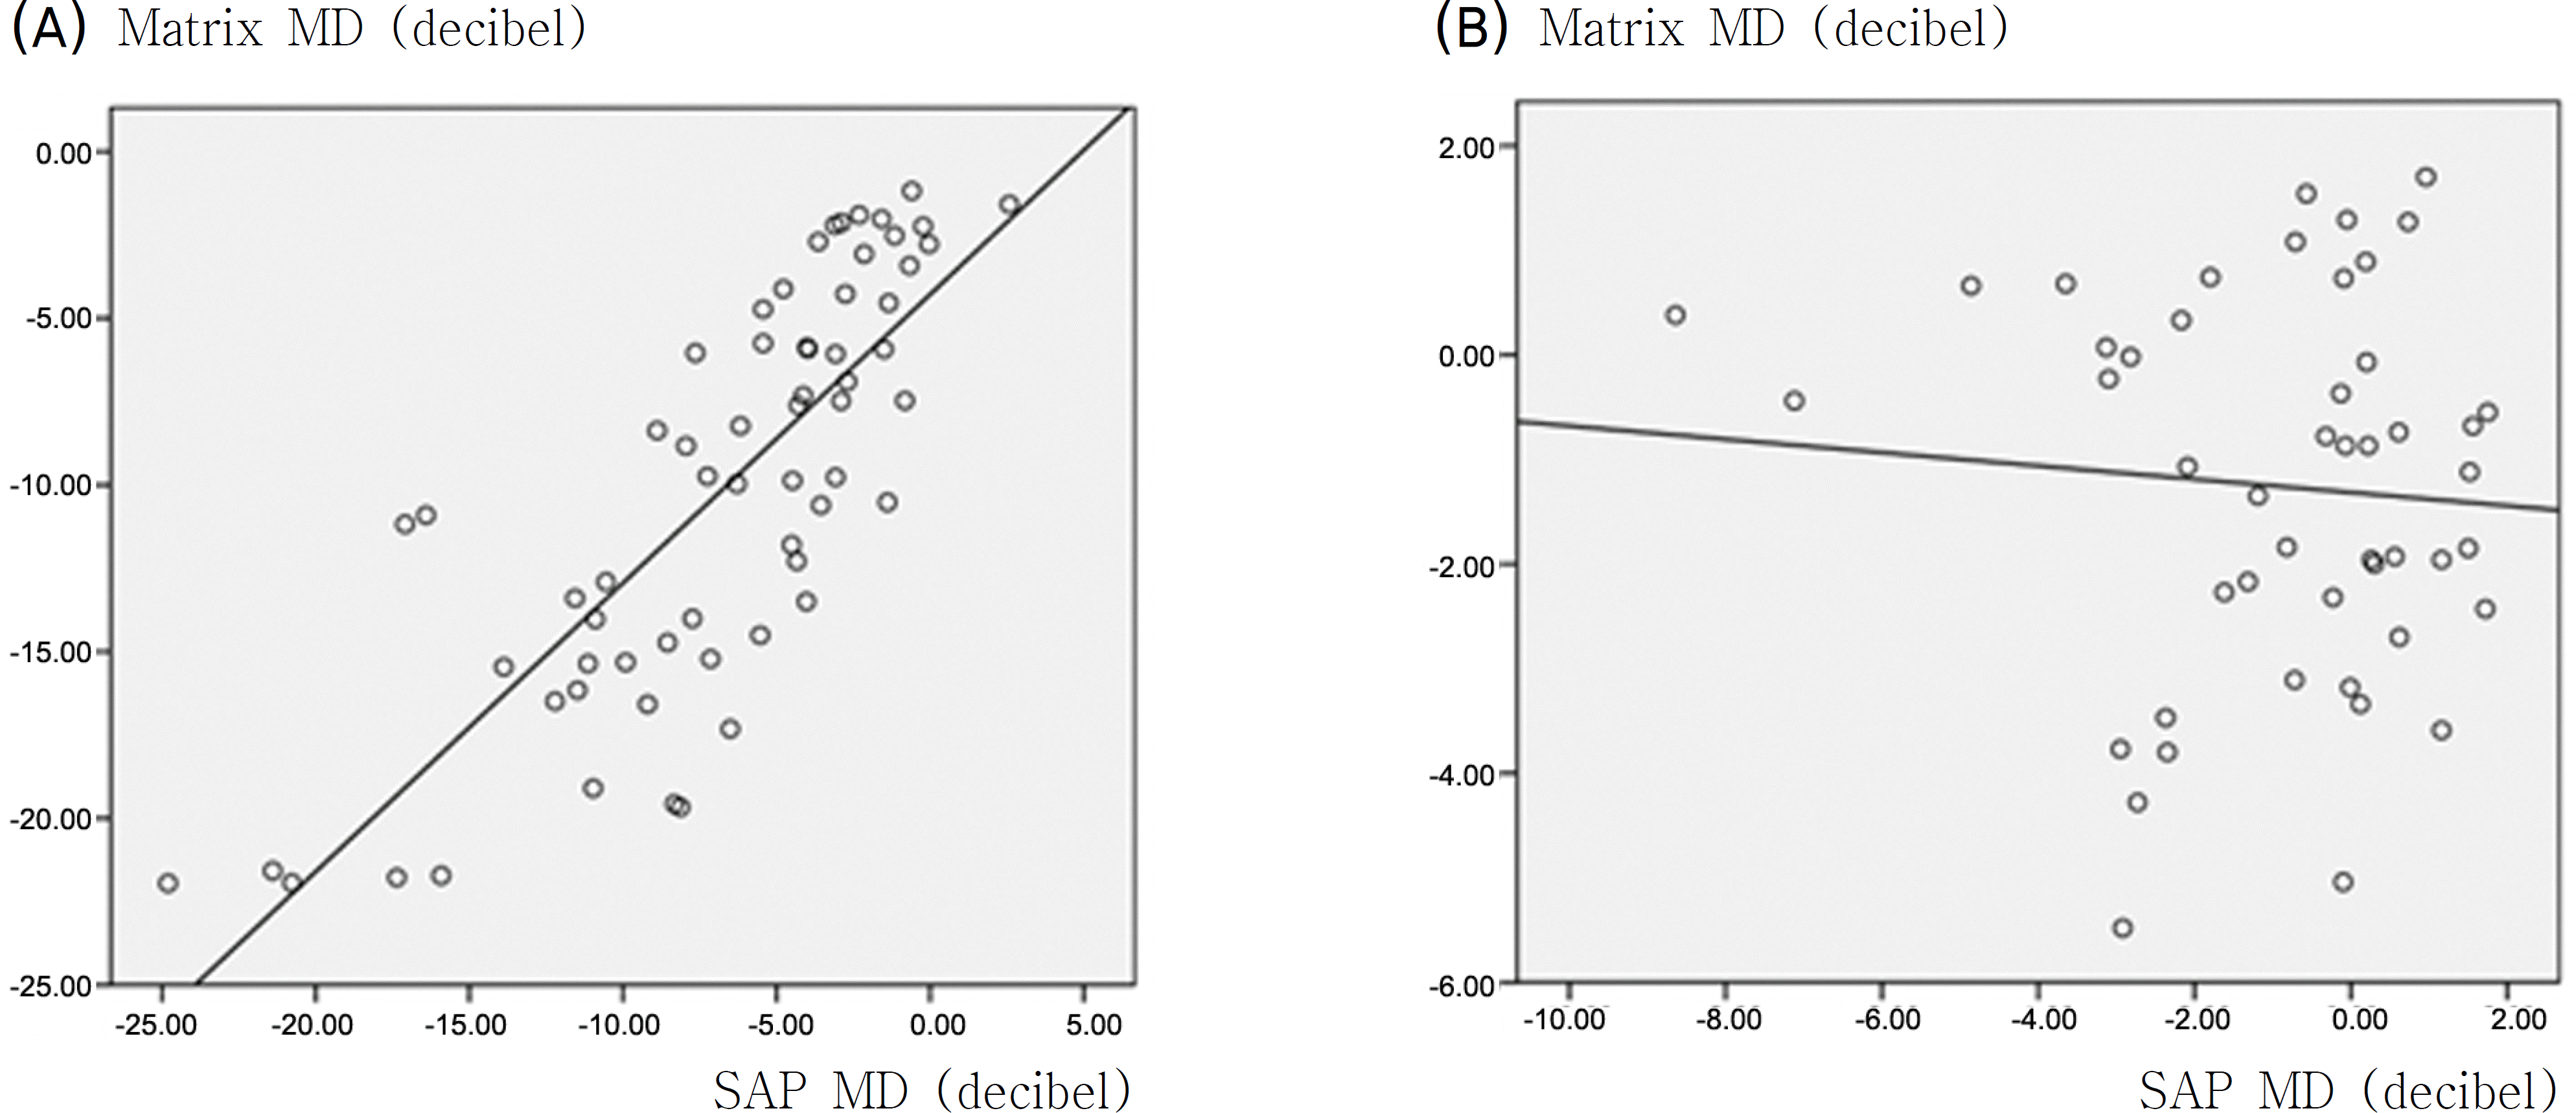 | Figure 1.Correlation of mean deviation (MD) between standard automated perimetry (SAP) and Humphrey Matrix (Matrix).(A) In glaucomatous eyes, MD of SAP and Matrix showed strong correlation (r=0.80, p<0.001). (B) In healthy eyes, MD of SAP and Matrix did not show statistically significant correlation (r=0.077, p=0.607) by Pearson correlation analysis. |
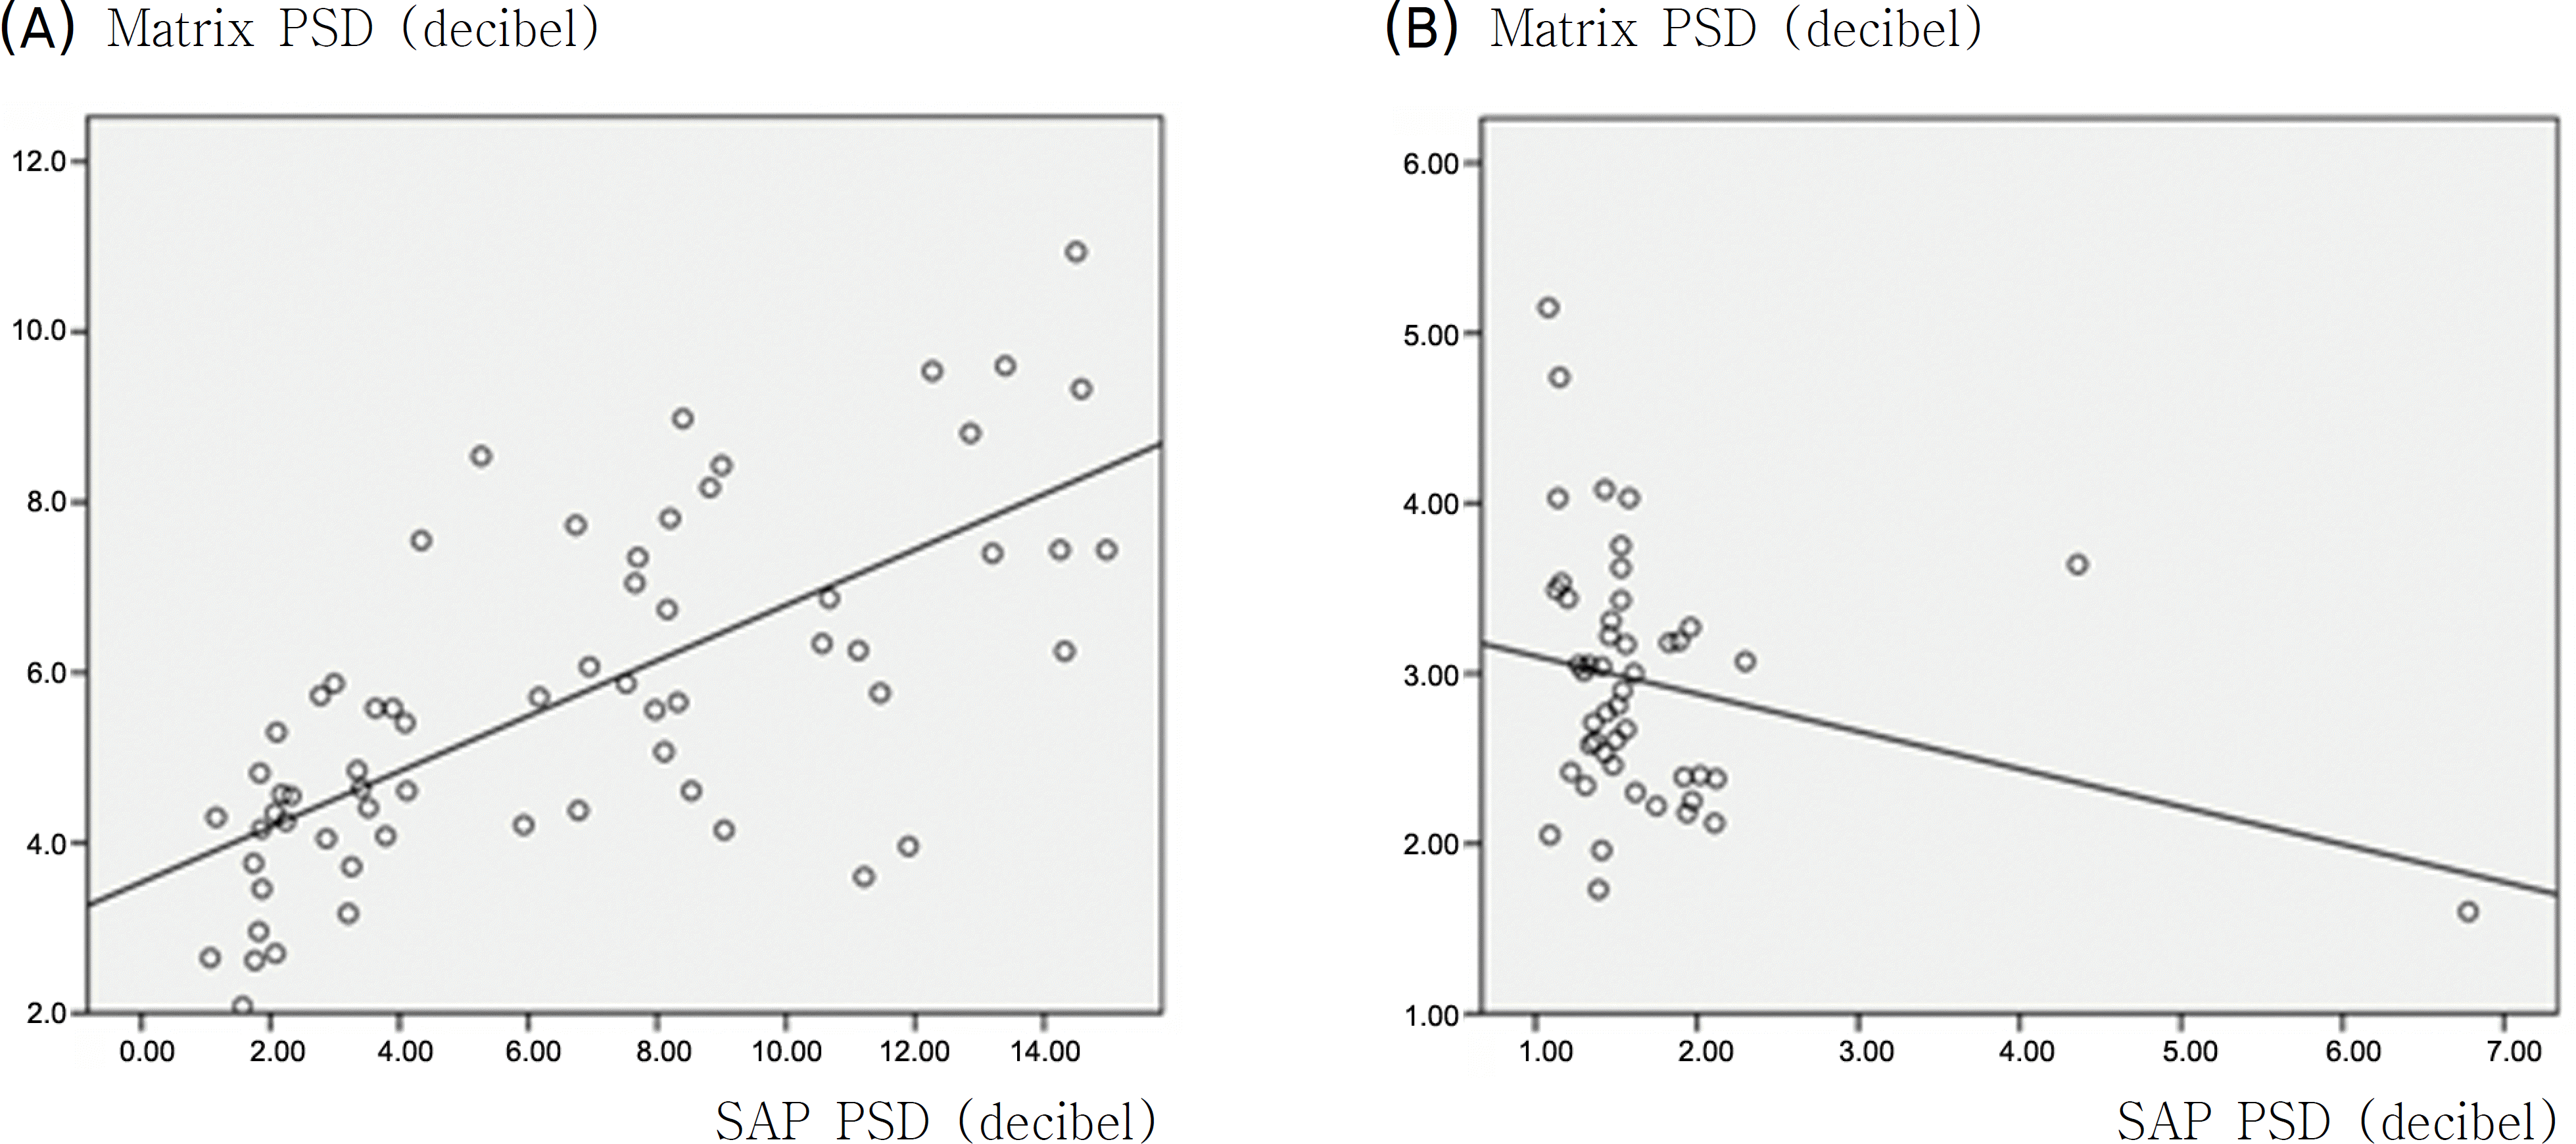 | Figure 2.Correlation of pattern standard deviation (PSD) between standard automated perimetry (SAP) and Humphrey Matrix (Matrix). (A) In glaucomatous eyes, PSD of SAP and Matrix showed strong correlation (r=0.69, p<0.001) (B) In healthy eyes, PSD of SAP and Matrix did not show statistically significant correlation (r=0.074, p=0.272) by Pearson correlation analysis. |
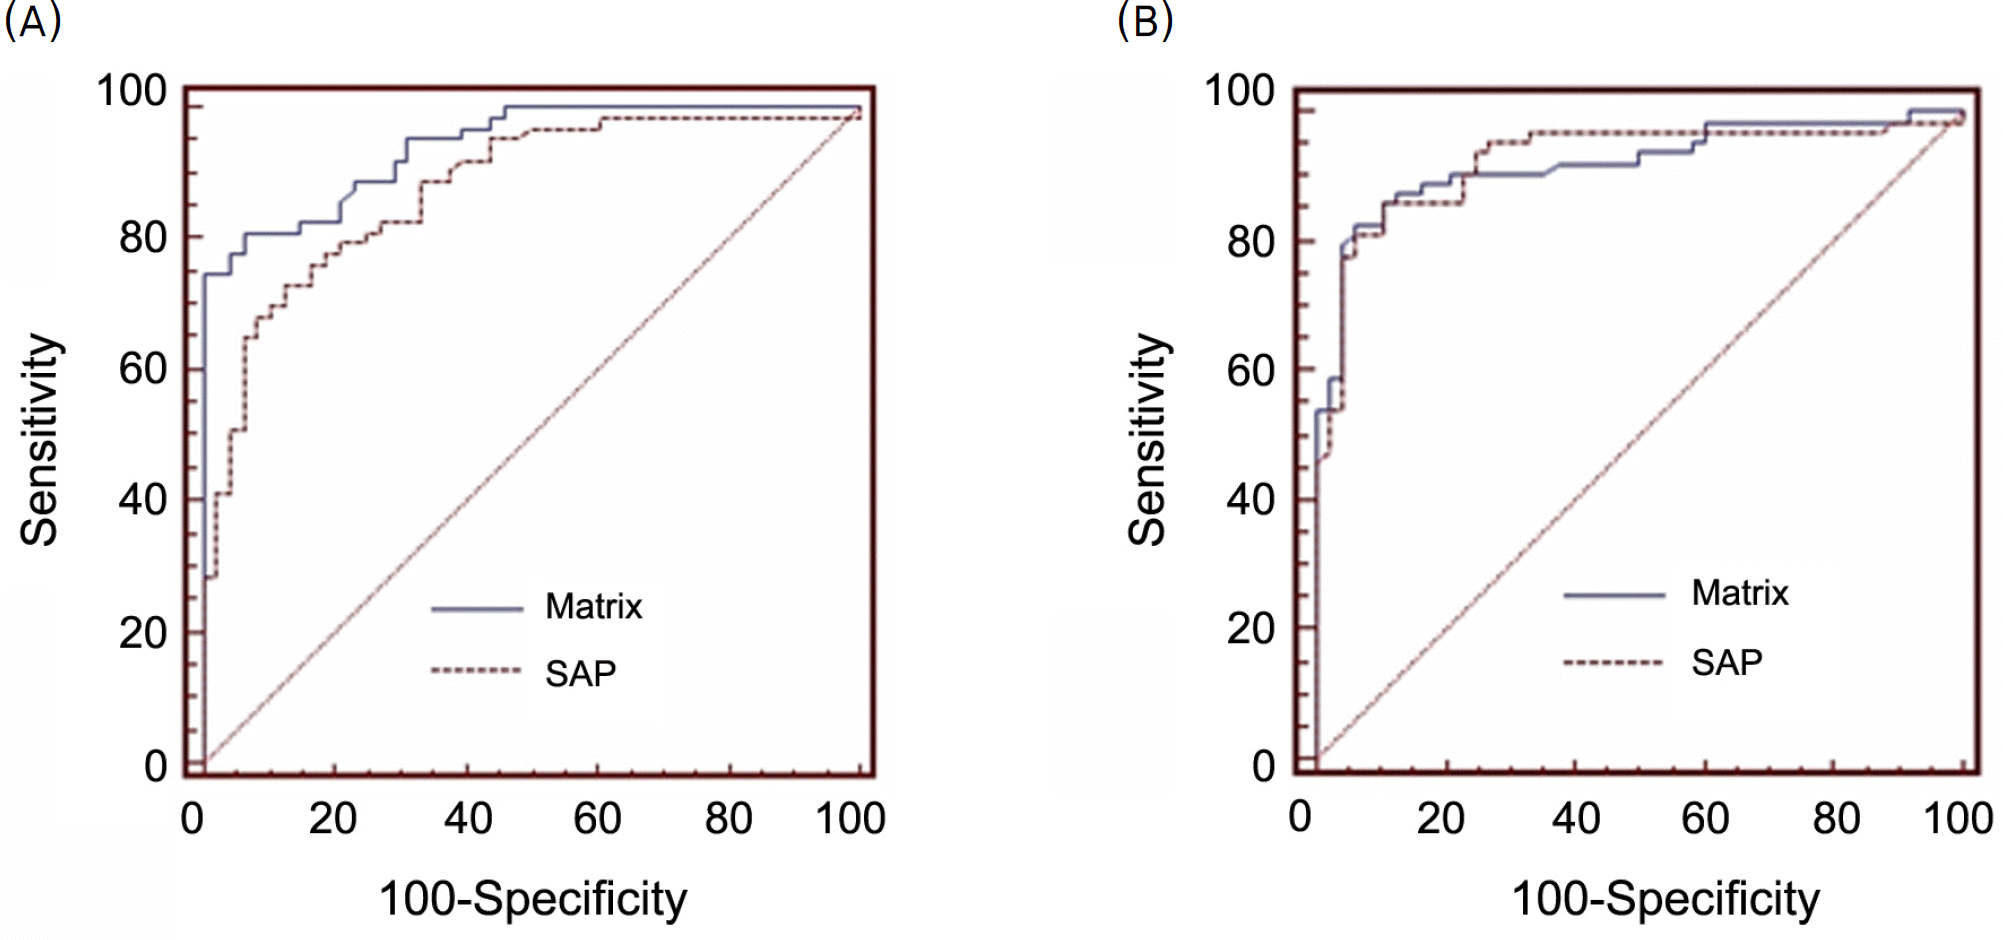 | Figure 3.The receiver operating characteristics curves (ROC) for discriminating between healthy and glaucomatous eyes. (A) Area under ROC value of mean deviation for Humphrey Matrix (Matrix, 0.941) and standard automated perimetry (SAP, 0.876) were not significantly different (p=0.068). (B) Area under ROC value of pattern standard deviation for Humphrey Matrix (Matrix, 0.921) and standard automated perimetry (SAP, 0.923) were not significantly different (p=0.927). |
Table 1.
Sensitivity and cutoff value at 80% and 90% specificity of standard automated perimetry (SAP), Humphrey Matrix (Matrix) mean deviation (MD), and pattern standard deviation (PSD) for discriminating between healthy and glaucomatous eyes
 XML Download