Abstract
Purpose
To determine the cross sections of extraocular muscles in patients with orbital fracture and to demonstrate a relationship among the cross sections, the size of orbital fracture, the soft tissue, and fat herniation and limitation of ocular movement.
Methods
The study included 87 patients (87 eyes) with orbital fracture. The cross section was defined as multiplication of the long axis and short axis. The ratio of the cross section in normal and injured eyes was calculated at preoperative and post-operative periods.
Results
The cross sections of all rectus muscles, except for the superior, increased in injured eyes and subsequently decreased postoperatively. After surgery, the cross sections of lateral and medial rectus muscles recovered to near normal but the inferior remained enlarged. The increased ratio of the short and long axis was significant but not the difference of the cross sections related to the short and long axis ratio. There was a preoperative difference between injured/normal cross section ratio in relation to the size of inferior fracture. There was postoperative normalization for the cross sections of inferior rectus muscles with the restrictive limitation due to inferior fracture.
Conclusions
The cross sections increased mostly after orbital fracture and subsequently decreased postoperatively. There was a change in the cross section ratio with the size of inferior fracture at preoperative period but there was no change in the cross sections related to the restrictive or paralytic limitation, except for eyes with the restriction secondary to inferior fracture. These were significantly normalized postoperatively in cross section.
Go to : 
References
1. Paek SH, Kim YS, Lee TS. A clinical study of blowout fracture. J Korean Ophthalmol Soc. 1993; 34:1194–8.
2. Lee SY, Kim SY, Kim HB. Orbital fractures evaluated by computed tomography. J Korean Ophthalmol Soc. 1990; 31:249–53.
3. Ahn SK, Jung SW. The clinical aspects of orbital fractures proven by computed tomography. J Korean Ophthalmol Soc. 1997; 38:2077–83.
4. Lee MS, Ahn JH, Kim HY, Lee SY. Clinical study of orbital wall fracture. J Korean Ophthalmol Soc. 1997; 38:1687–93.
5. Kwon YH, Park DW, Chung JY, Ahn HB. A clinical study of pediatric orbital wall fracture. J Korean Ophthalmol Soc. 2006; 47:7–12.
6. Park SH, Rah SH, Kim YH. Clinical evaluation of the associated ocular injuries of orbital wall fracture patients. J Korean Ophthalmol Soc. 2002; 43:1474–81.
7. Gilbard SM, Mafee MF, Lagouros PA, Langer BG. The prognostic significance of computed tomography. Ophthalmology. 1985; 92:1523–8.
8. Harris GJ, Garcia GH, Logani SC, Murphy ML. Correlation of preoperative computed tomography and postoperative ocular motility in orbital blowout fractures. Ophthalmic Plast Reconstr Surg. 2000; 16:179–87.

9. Lee SH, Lew H, Yun YS. Ocular motility disturbances in orbital wall fracture patients. Yonsei Med J. 2005; 46:359–67.

10. Raskin EM, Millman AL, Lubkin V, et al. Prediction of late enophthalmos by volumetric analysis of orbital fractures. Ophthalmic Plast Reconstr Surg. 1998; 14:19–26.

11. Schuknecht B, Carls F, Valavanis A, Sailer HF. CT assessment of orbital volume in late post-traumatic enophthalmos. Neuroradiology. 1996; 38:470–5.

12. Levine LM, Sires BS, Gentry LR, Dortzbach RK. Rounding of the inferior rectus muscle: A helpful radiologic finding in the manage –ment of orbital floor fractures. Ophthalmic Plast Reconstr Surg. 1998; 14:141–3.
13. Matic DB, Tse R, Banerjee A, Moore CC. Rounding of the inferior rectus muscle as a predictor of enophthalmos in orbital floor fractures. J Craniofac Surg. 2007; 18:127–32.

14. Smith B, Lisman RD, Simonton J, Della Rocca R. Volkmann's contracture of the extraocular muscles following blowout fracture. Ophthalmic Plast Reconstr Surg. 1984; 74:200–16.

15. Baldeschi L, Lupetti A, Vu P, et al. Reactivation of Graves'– orbitopathy after rebabilitative orbital decompression. Ophthal– mology. 2007; 114:1395–402.
Go to : 
 | Figure 1.The measurement of extraocular muscles in preoperative normal (A), postoperative normal (B), preoperative injured (C) and postoperative injured eye (D). |
 | Figure 2.The size of orbital wall fracture (arrow) classified into small (A, D), medium (B, E) and large (C, F) at inferior (A, B, C) and medial (D, E, F) orbital wall fracture. |
 | Figure 3.The soft tissue and fat herniation (arrow) classified into small (A, D), medium (B, E) and large (C, F) at inferior (A, B, C) and medial (D, E, F) orbital wall fracture. |
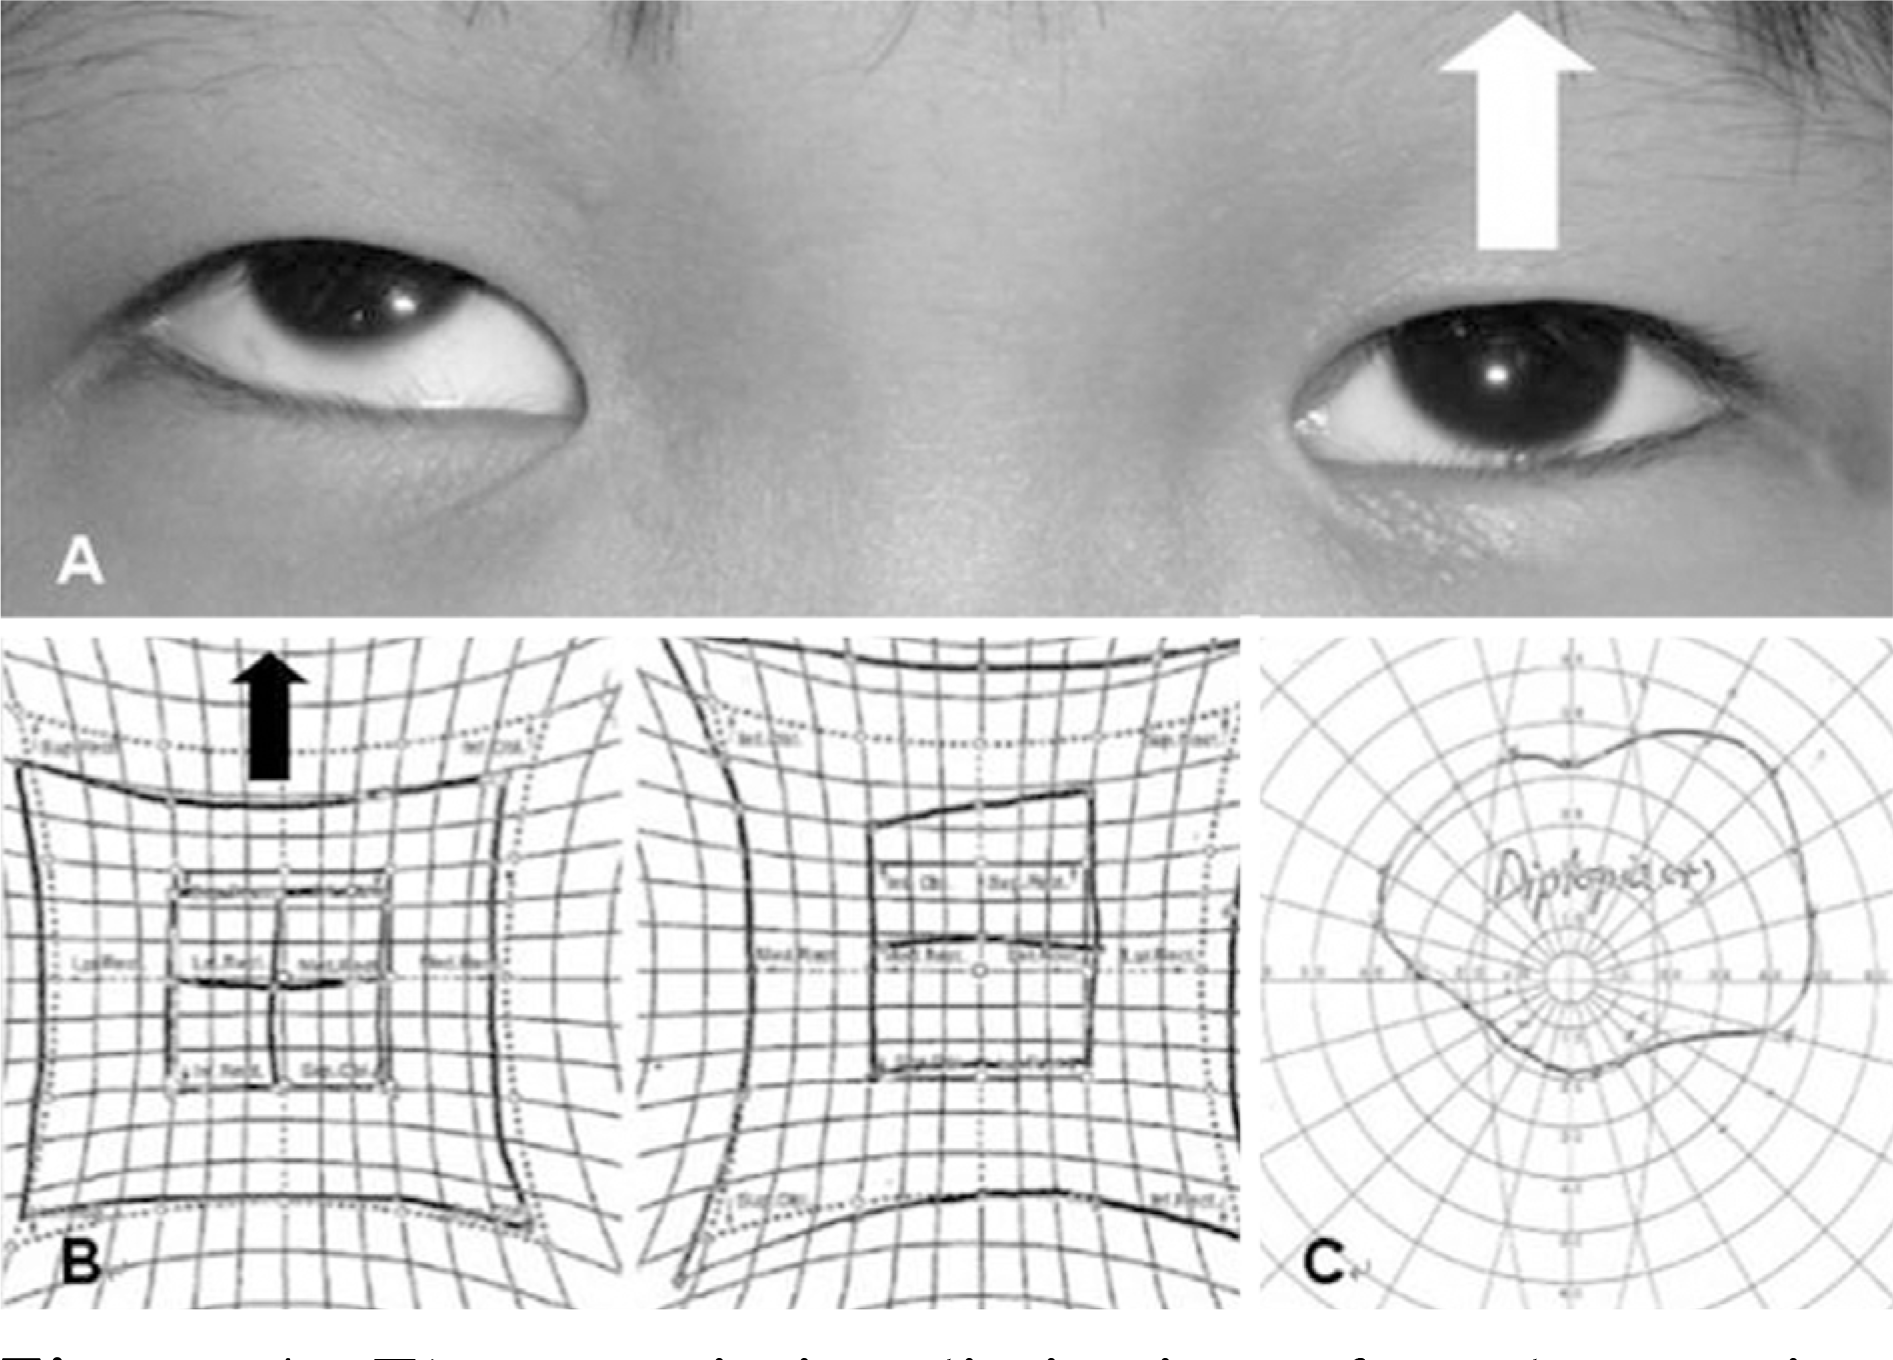 | Figure 4.The restrictive limitation of ocular motion demonstrates the limitation of supraduction (white arrow)(A), restriction on HESS screen (black arrow) (B) and diplopia at binocular single vision test (C) in patient with inferior orbital wall fracture. |
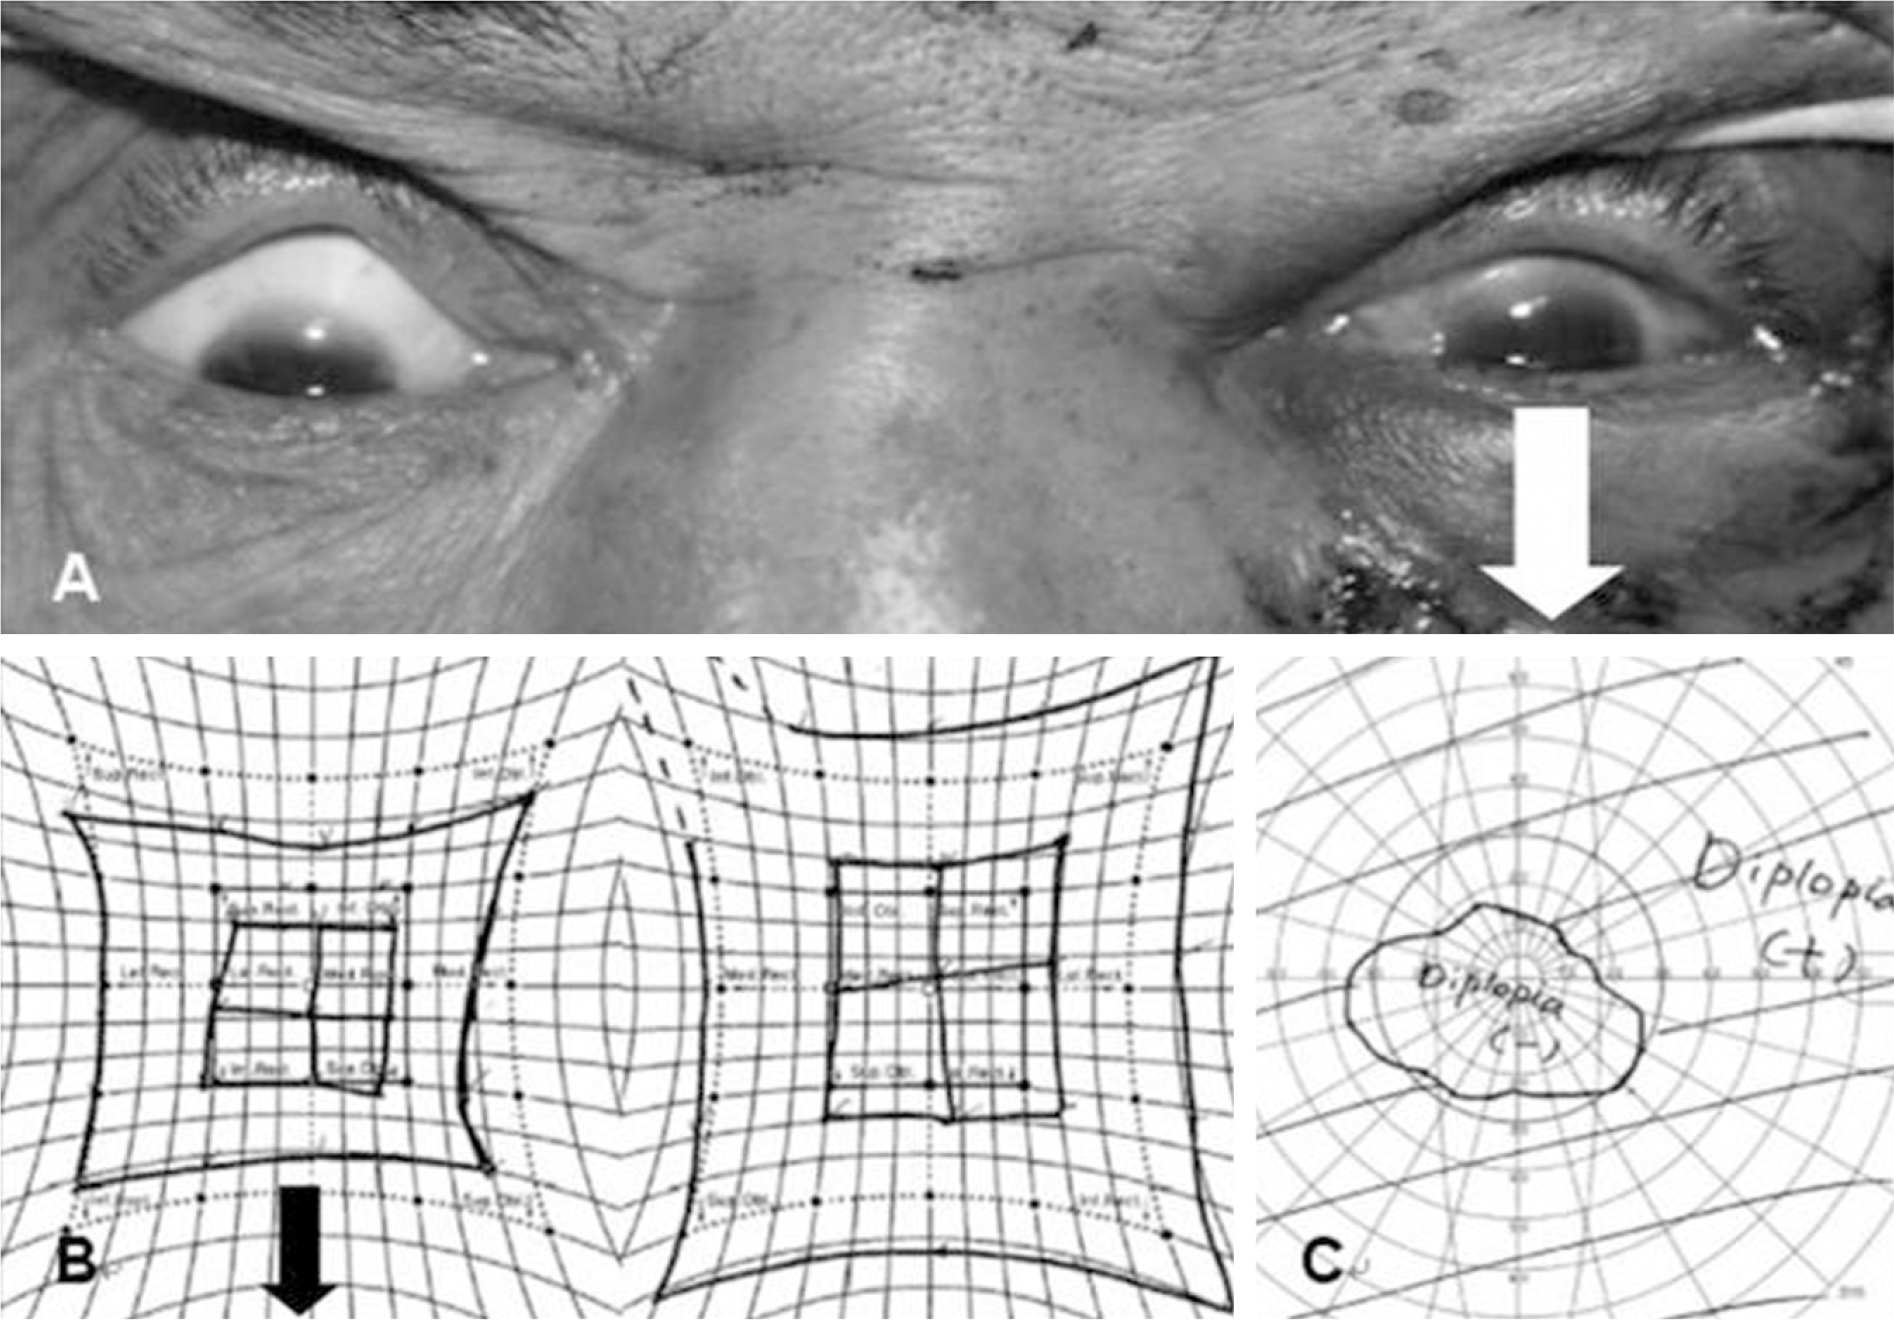 | Figure 5.The paralytic limitation of ocular motion demonstrates the limitation of infraduction (white arrow)(A), restriction on HESS screen (black arrow) (B) and diplopia at binocular single vision test (C) in patient with inferior orbital wall fracture. |
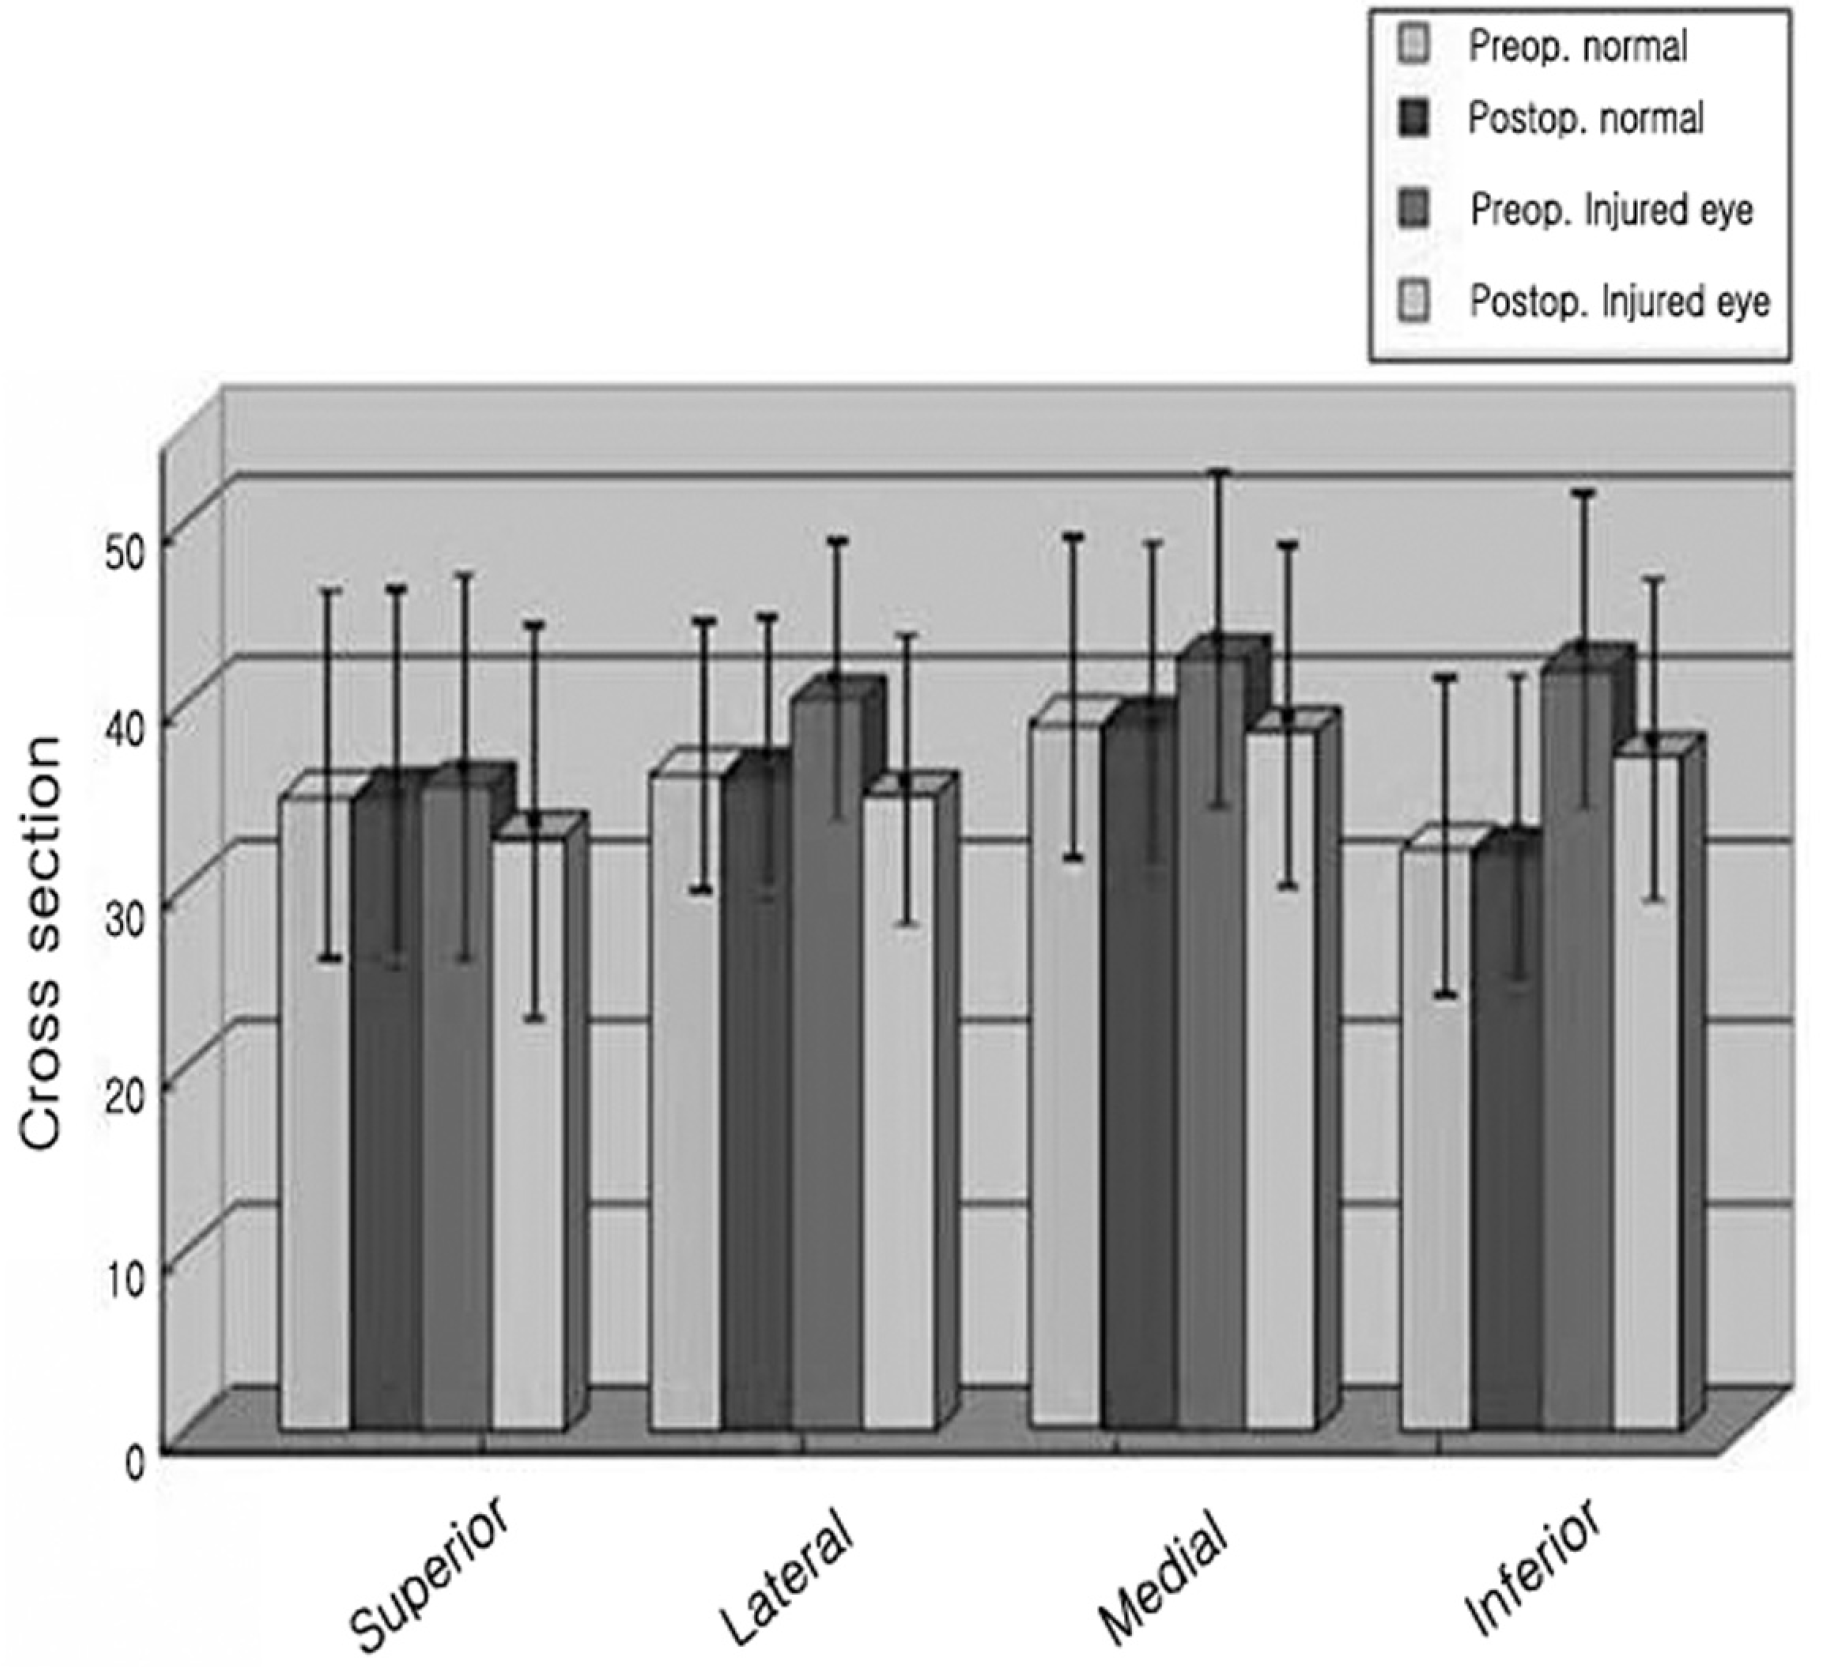 | Figure 6.The cross section value in preoperative normal, postoperative normal, preoperative injuredand postoperative injured eyes of the extraocular muscles before and after open reduction of orbital wall fracture. |
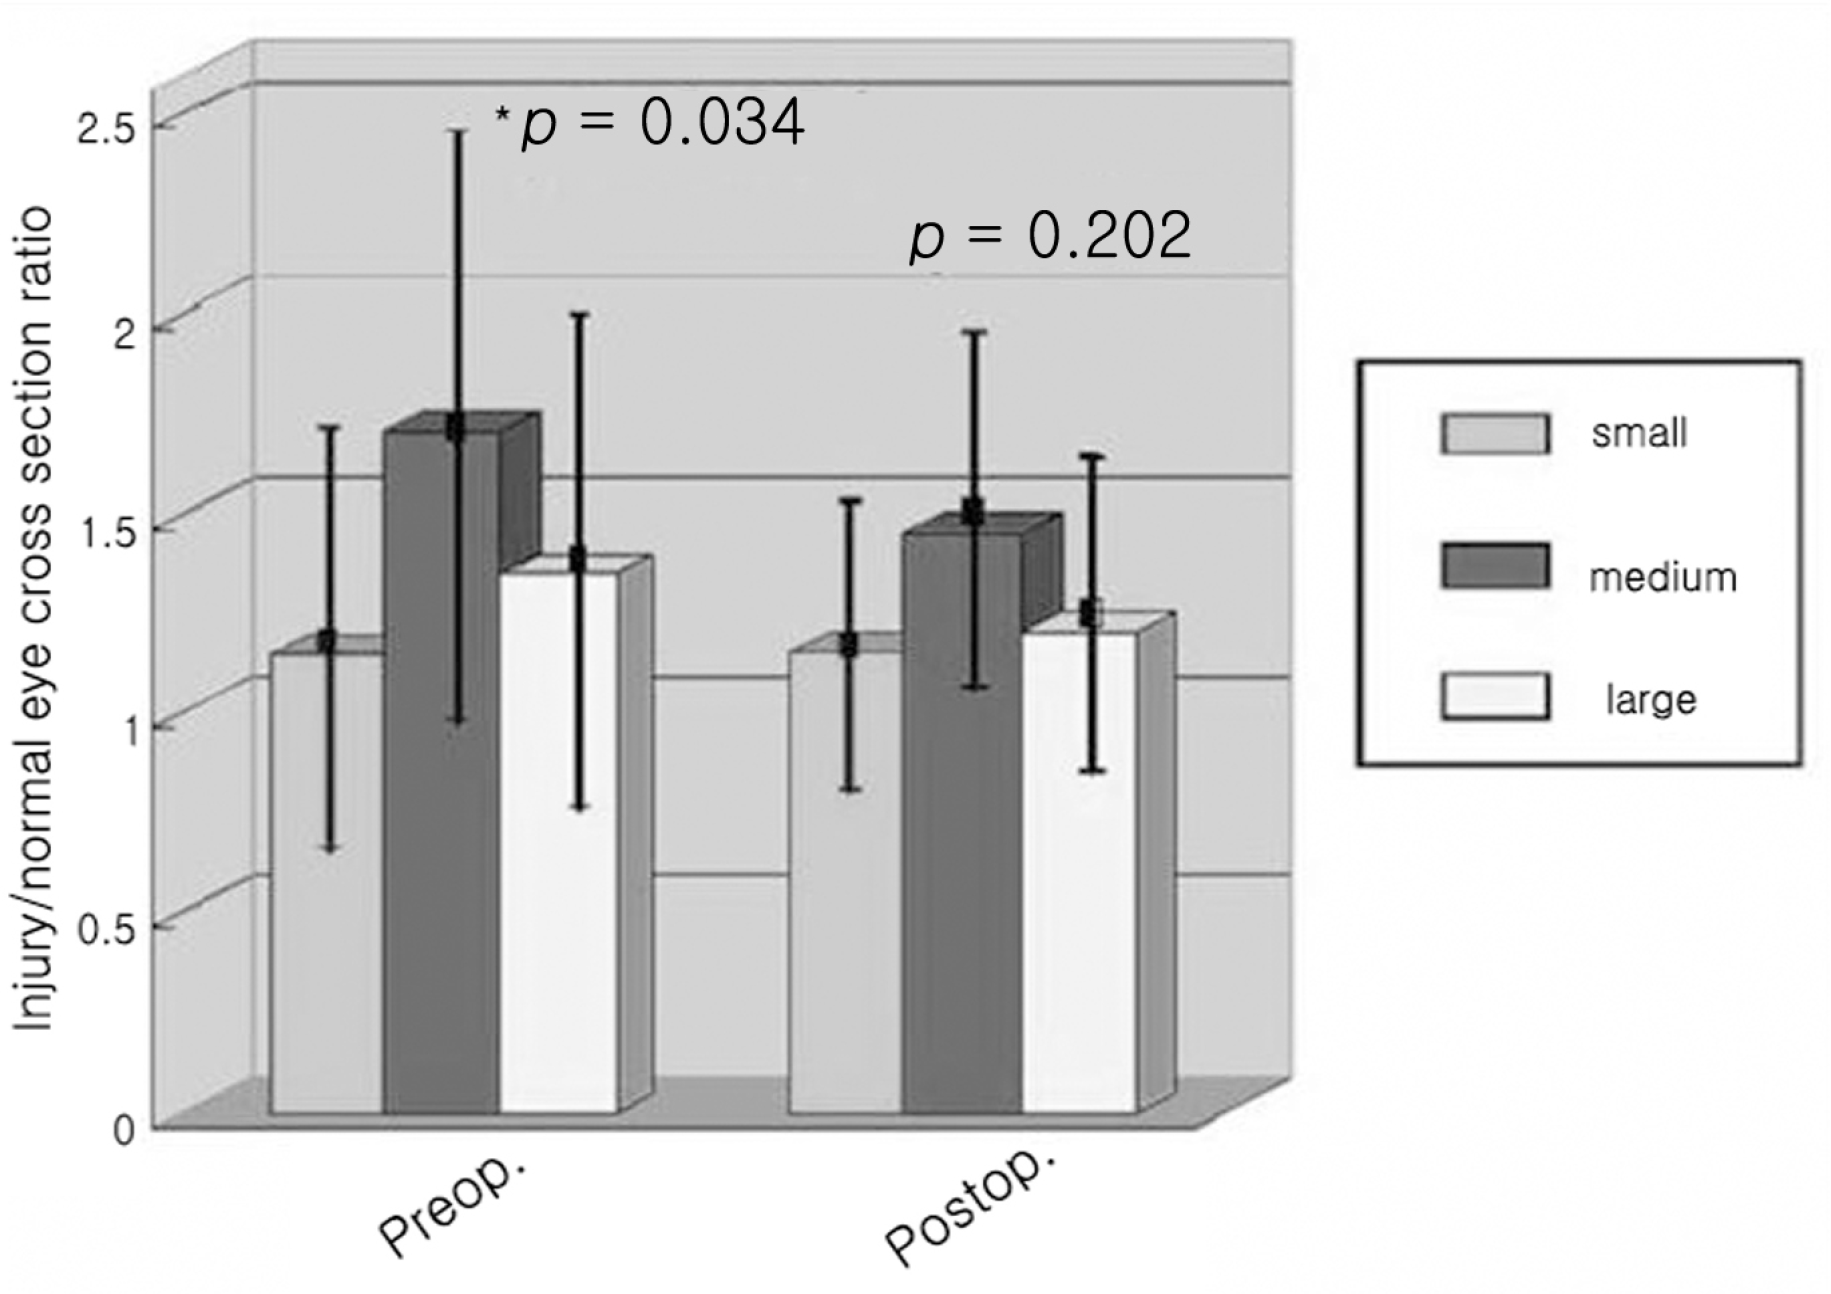 | Figure 7.The cross section ratio between injuredand normal eyes in relation to the size of inferior orbital wall fracture at preoperative and postoperative period (* p value<0.05). |
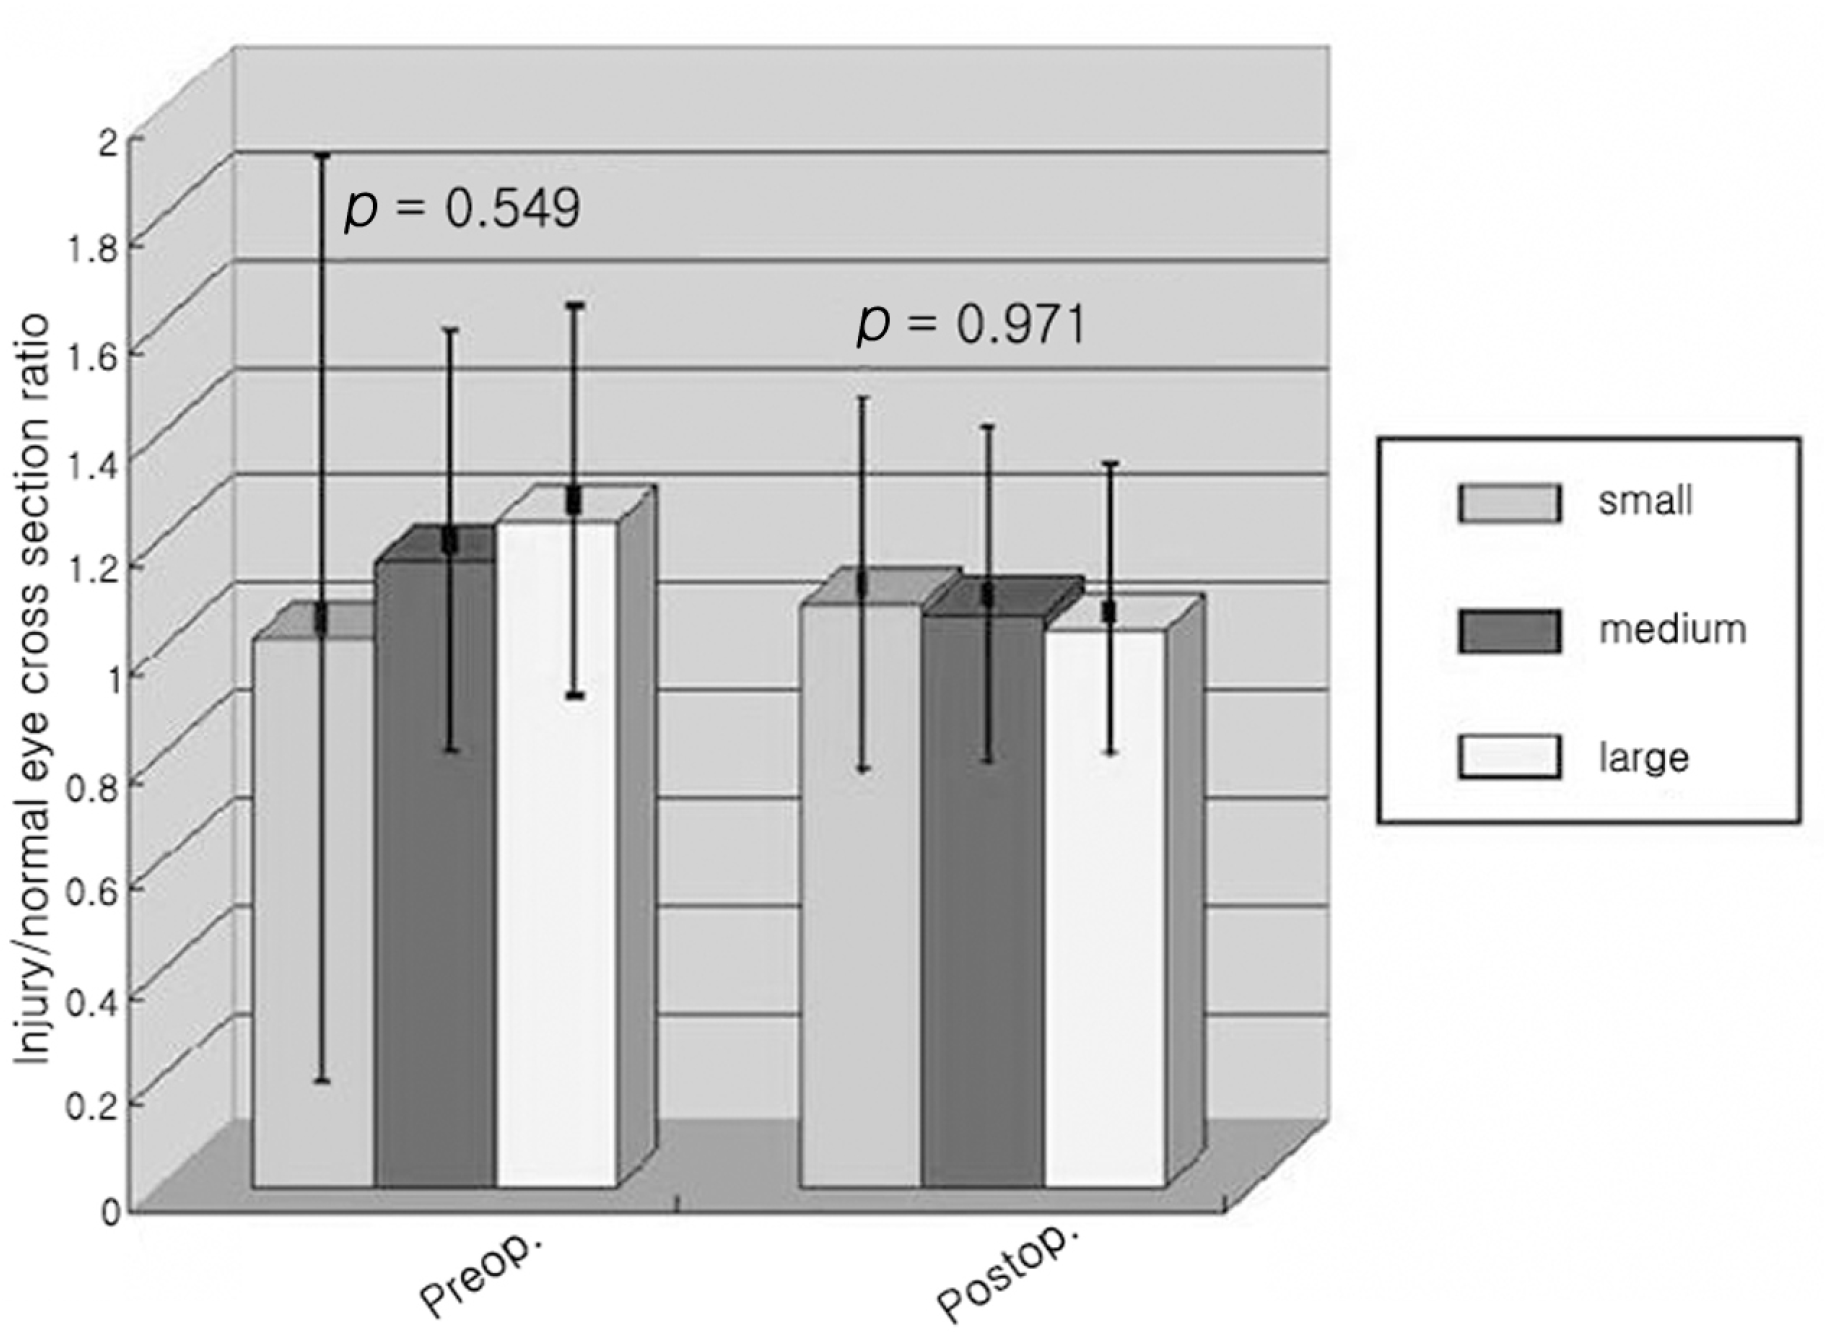 | Figure 8.The cross section ratio between injured and normal eyes in relation to the size of medial orbital wall fracture at preoperative and postoperative period. |
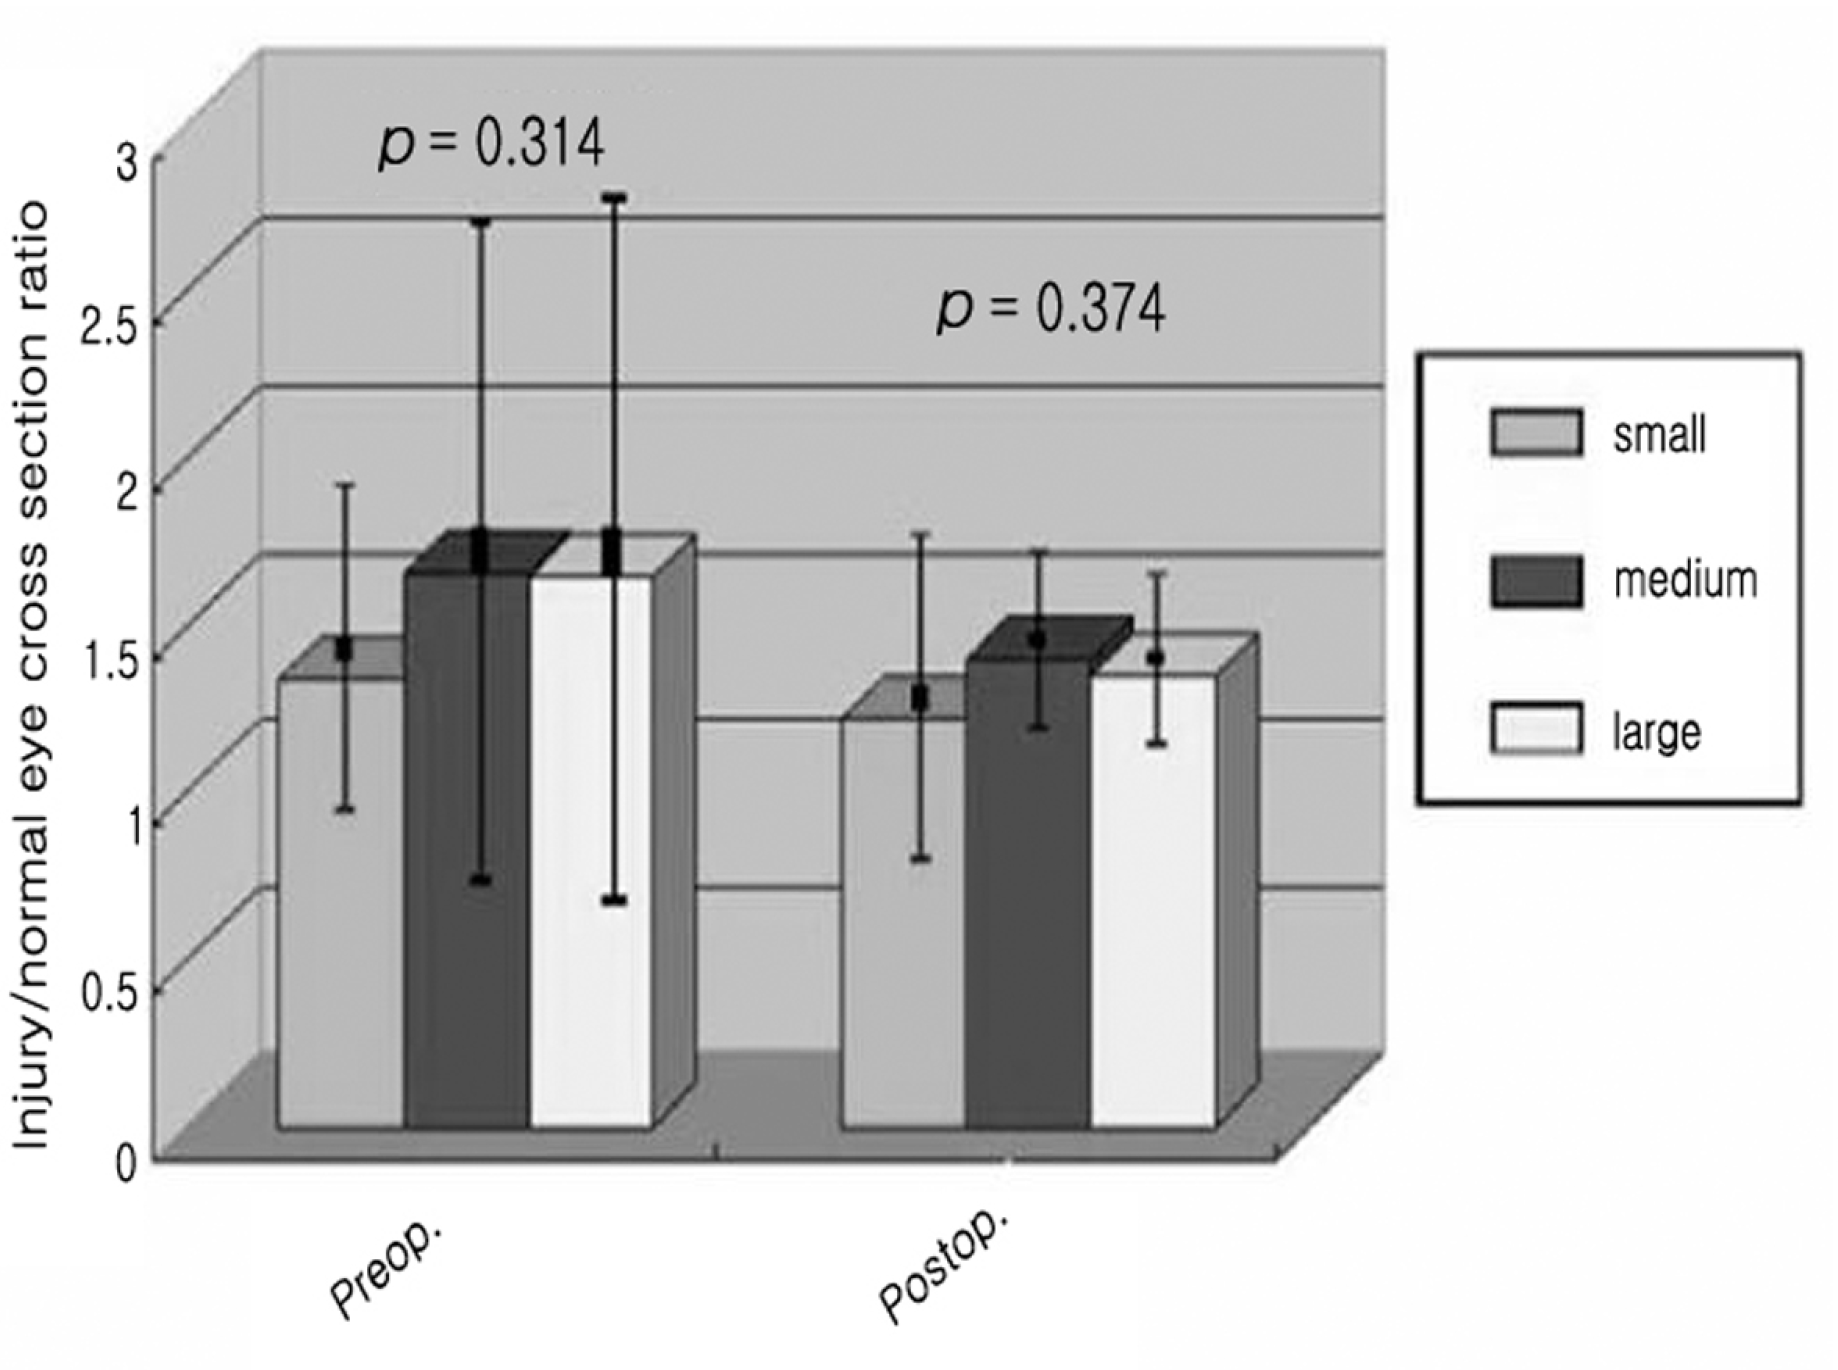 | Figure 9.The cross section ratio between injured and normal eyes in relation to the extension of the soft tissue and fat herniation in patients with inferior orbital wall fracture at preoperative and postoperative period. |
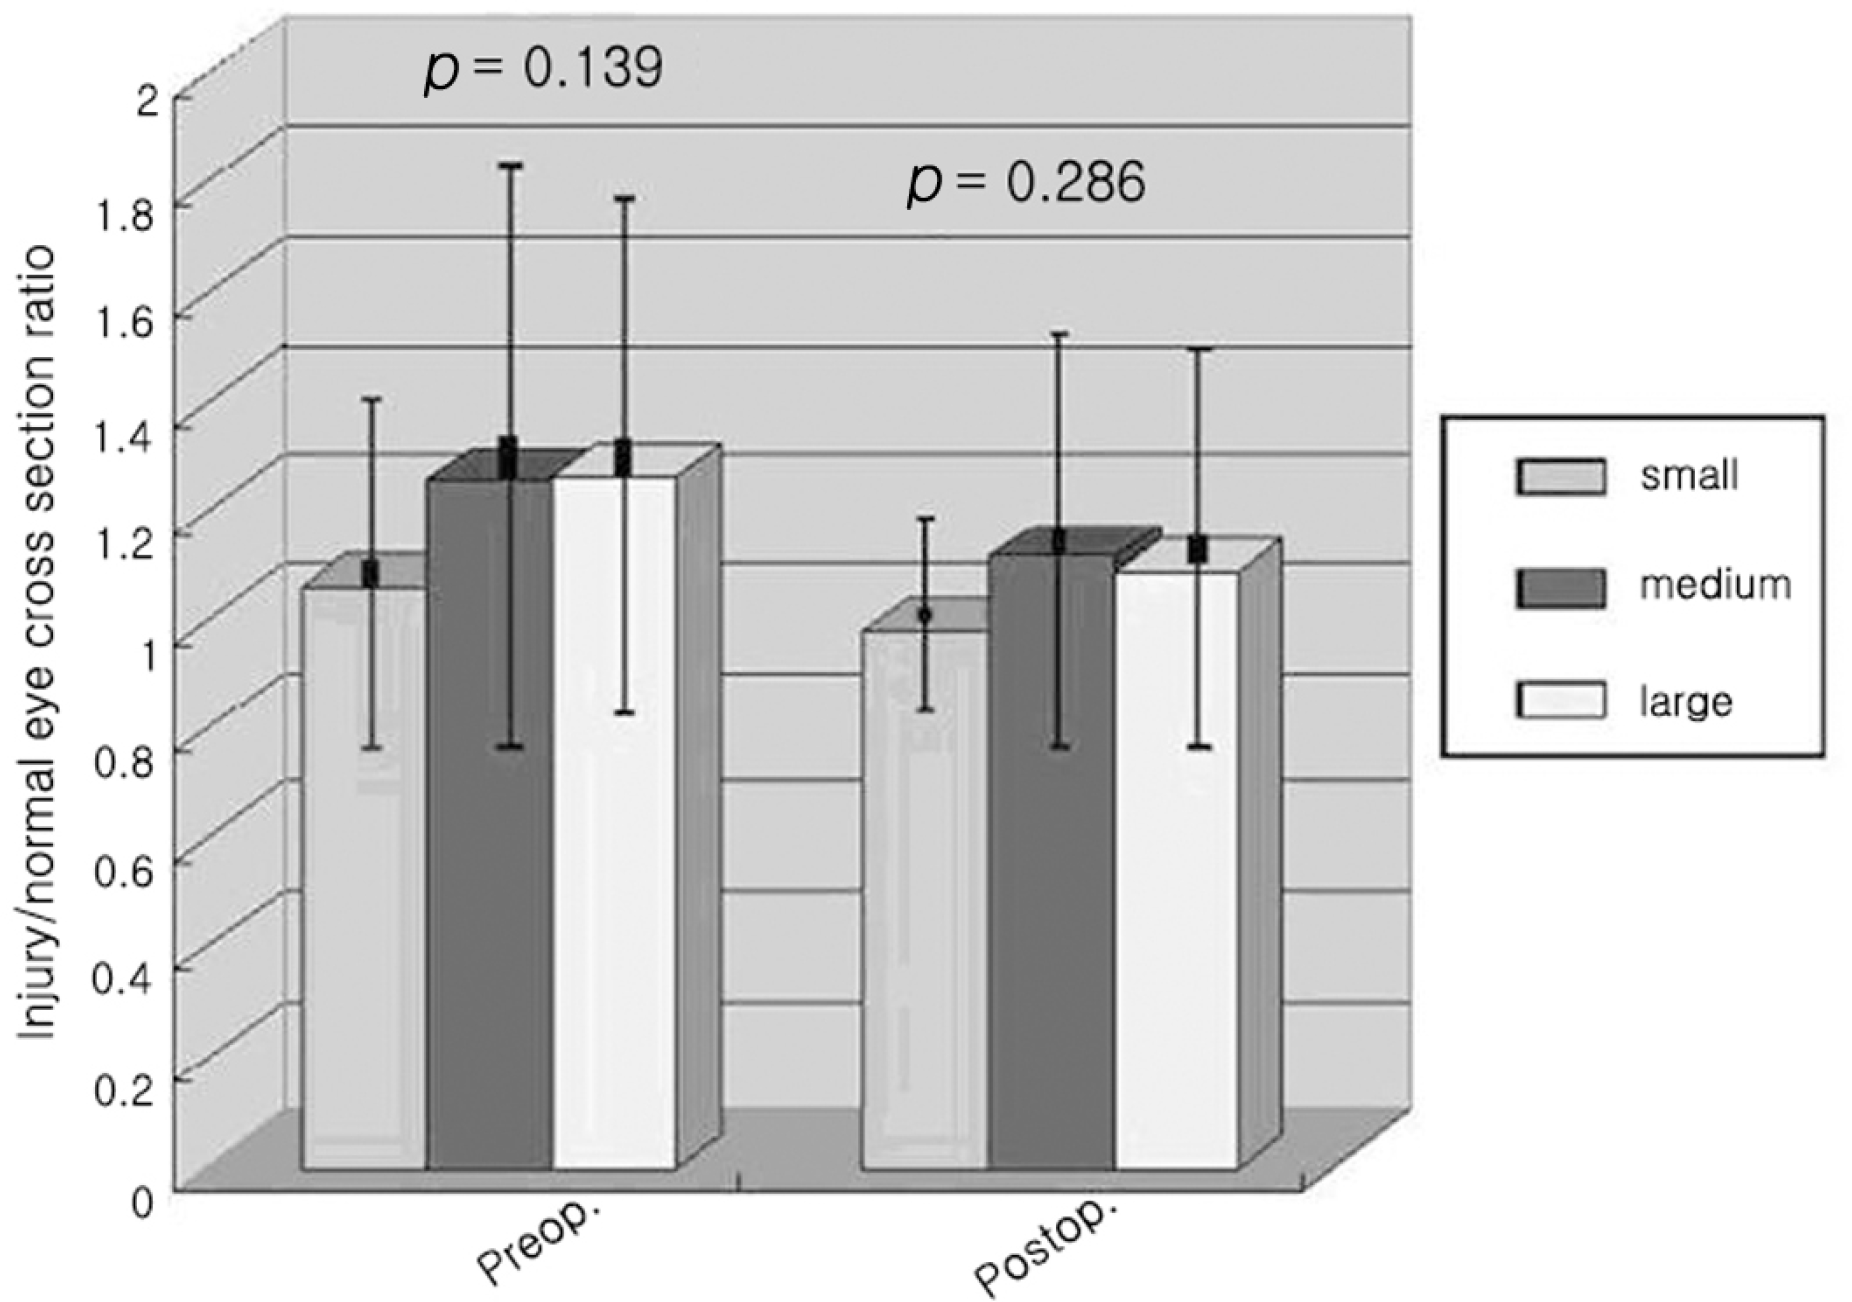 | Figure 10.The cross section ratio between injured and normal eyes in relation to the extension of the soft tissue and fat herniation in patients with medial orbital wall fracture at preoperative and postoperative period. |
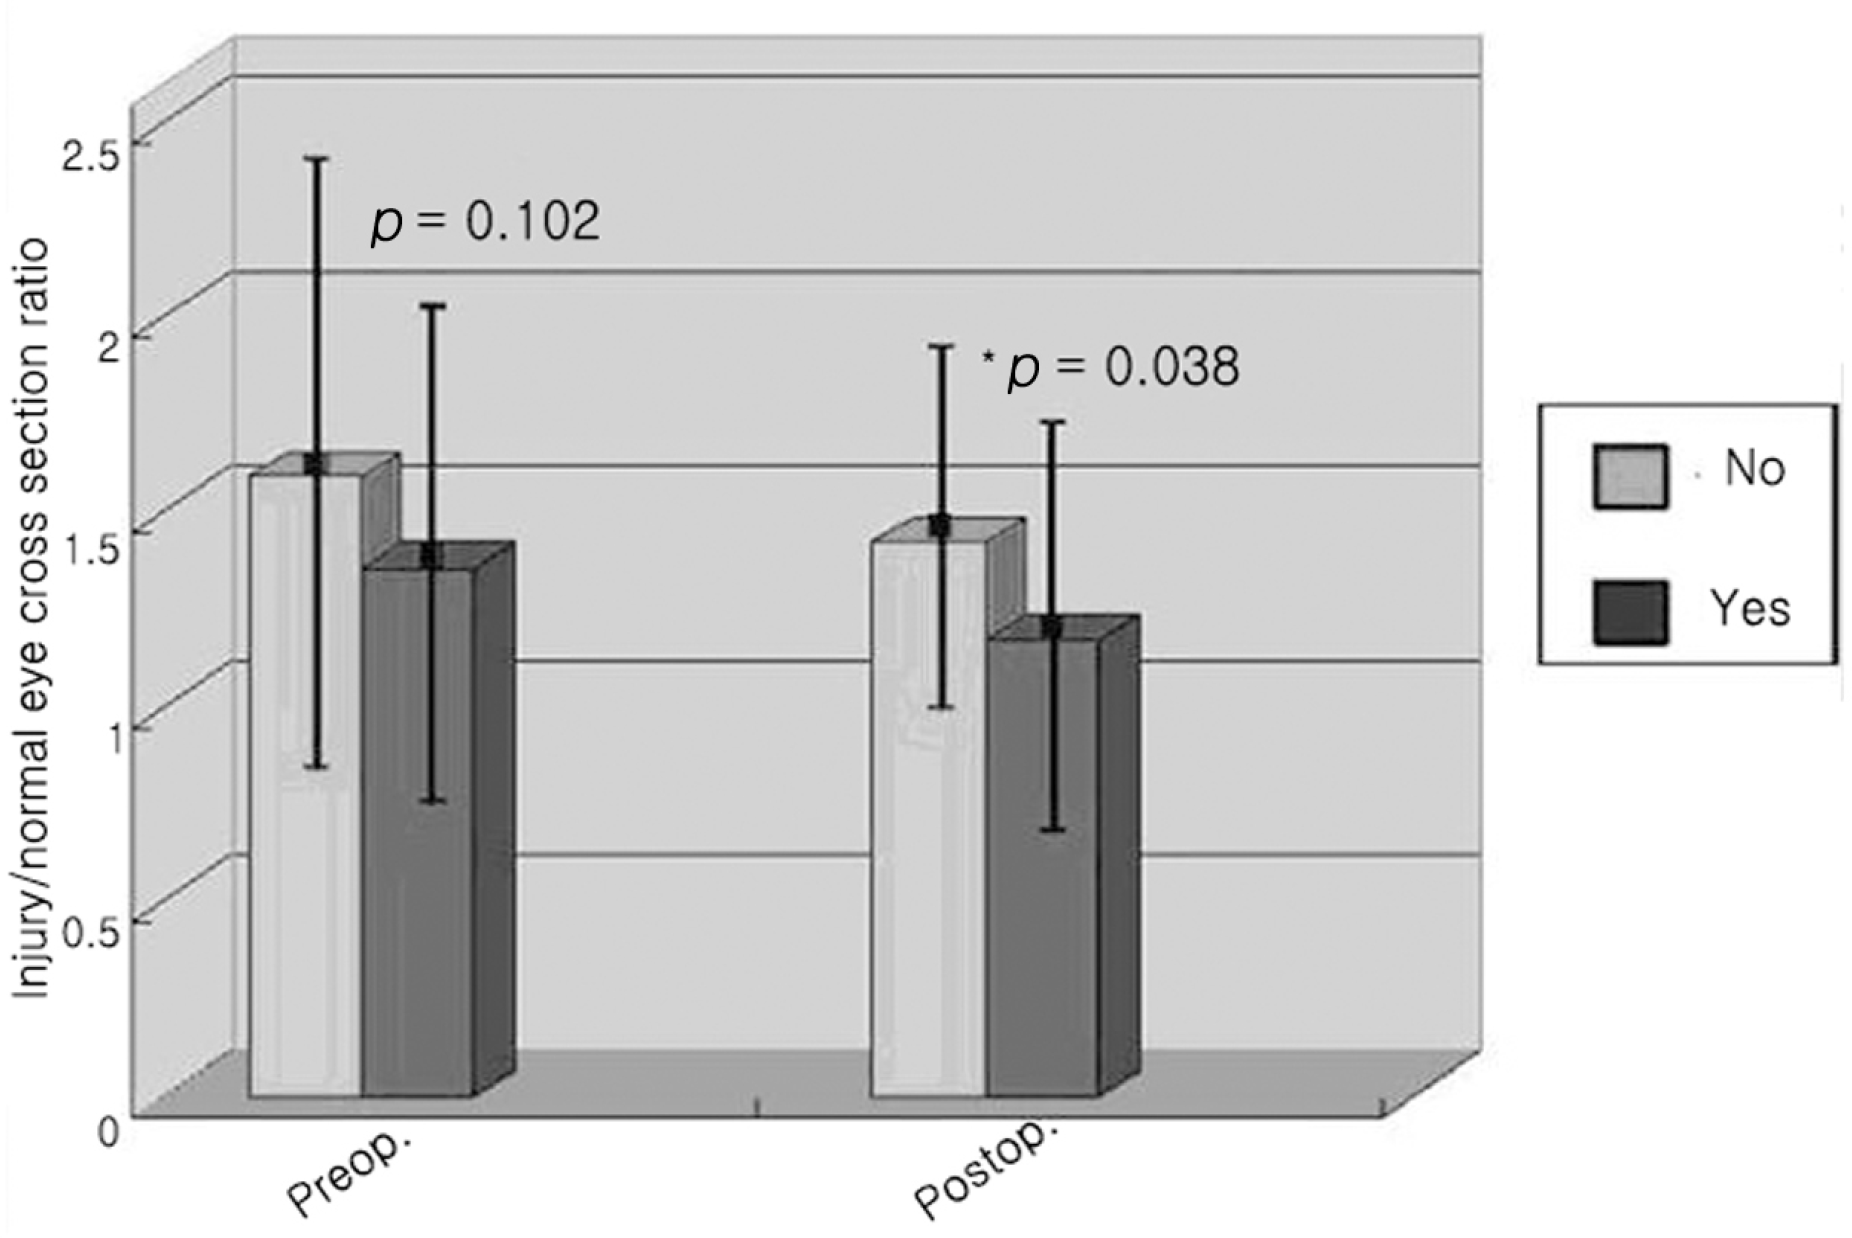 | Figure 11.The cross section ratio between injured and normal eyes in relation to the restrictive limitation of ocular motion in patients with inferior orbital wall fracture at preoperative and postoperative period(*p value<0.05). |
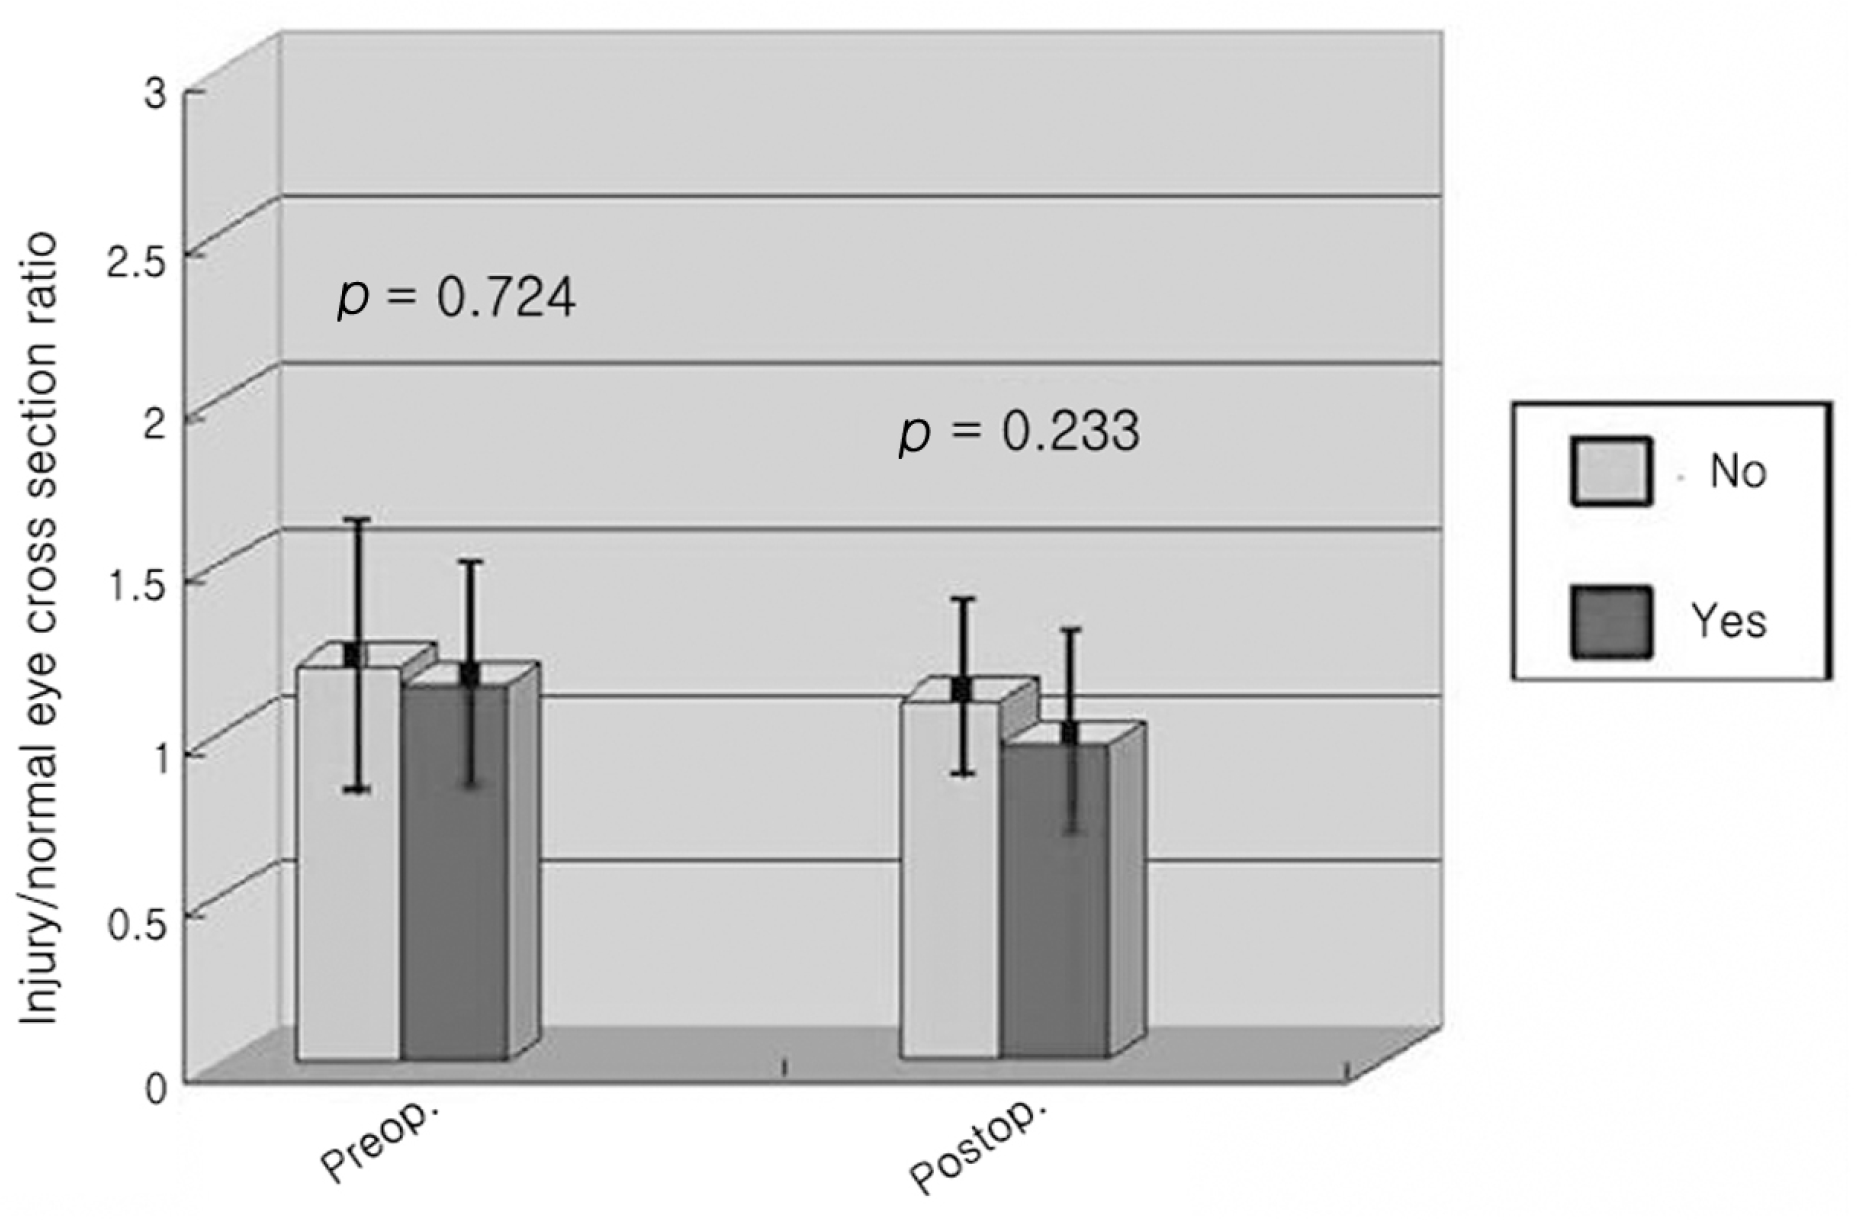 | Figure 12.The cross section ratio between injured and normal eyes in relation to the restrictive limitation of ocular motion in patients with medial orbital wall fracture at preoperative and postoperative period. |
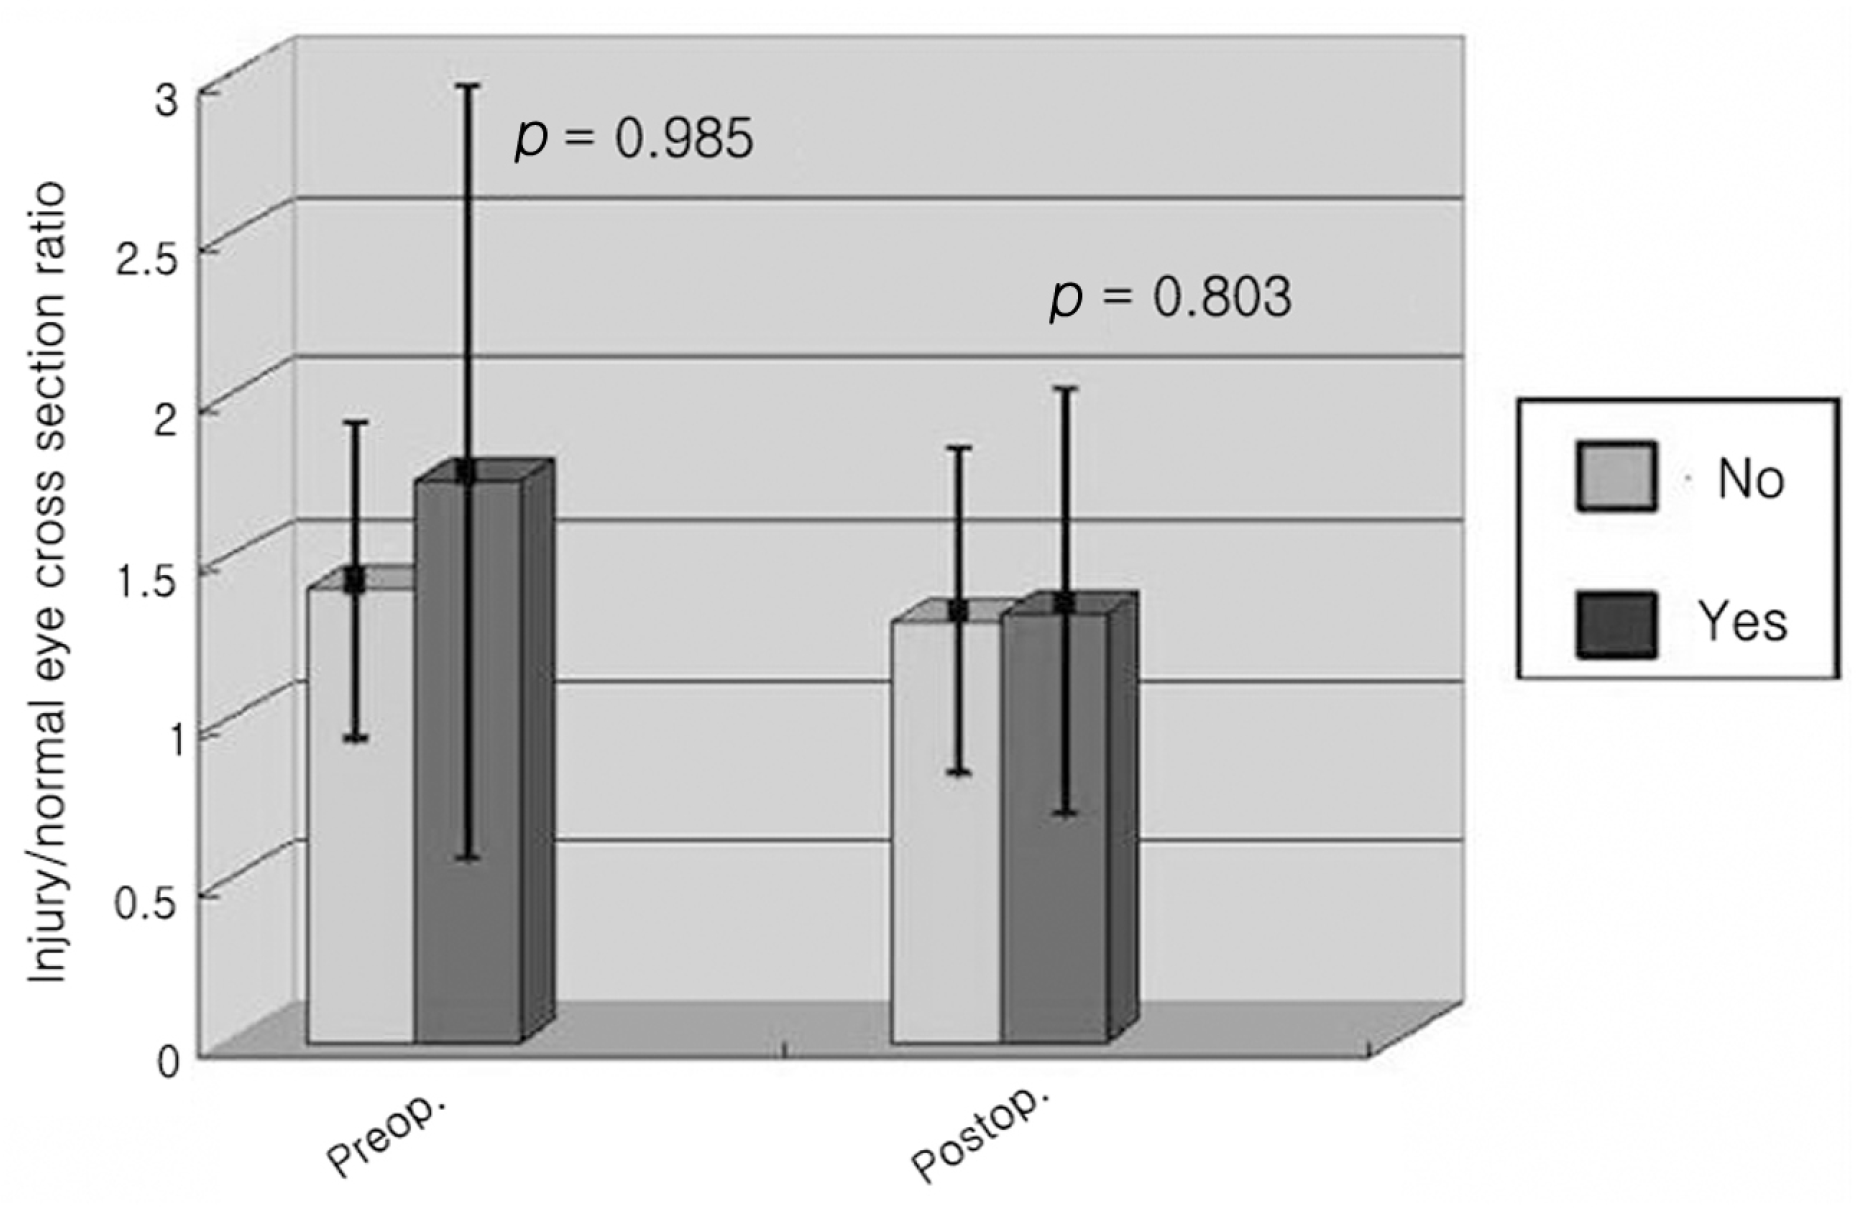 | Figure 13.The cross section ratio between injured and normal eyes in relation to the paralytic limitation of ocular motion in patients with inferior orbital wall fracture at preoperative and postoperative period. |
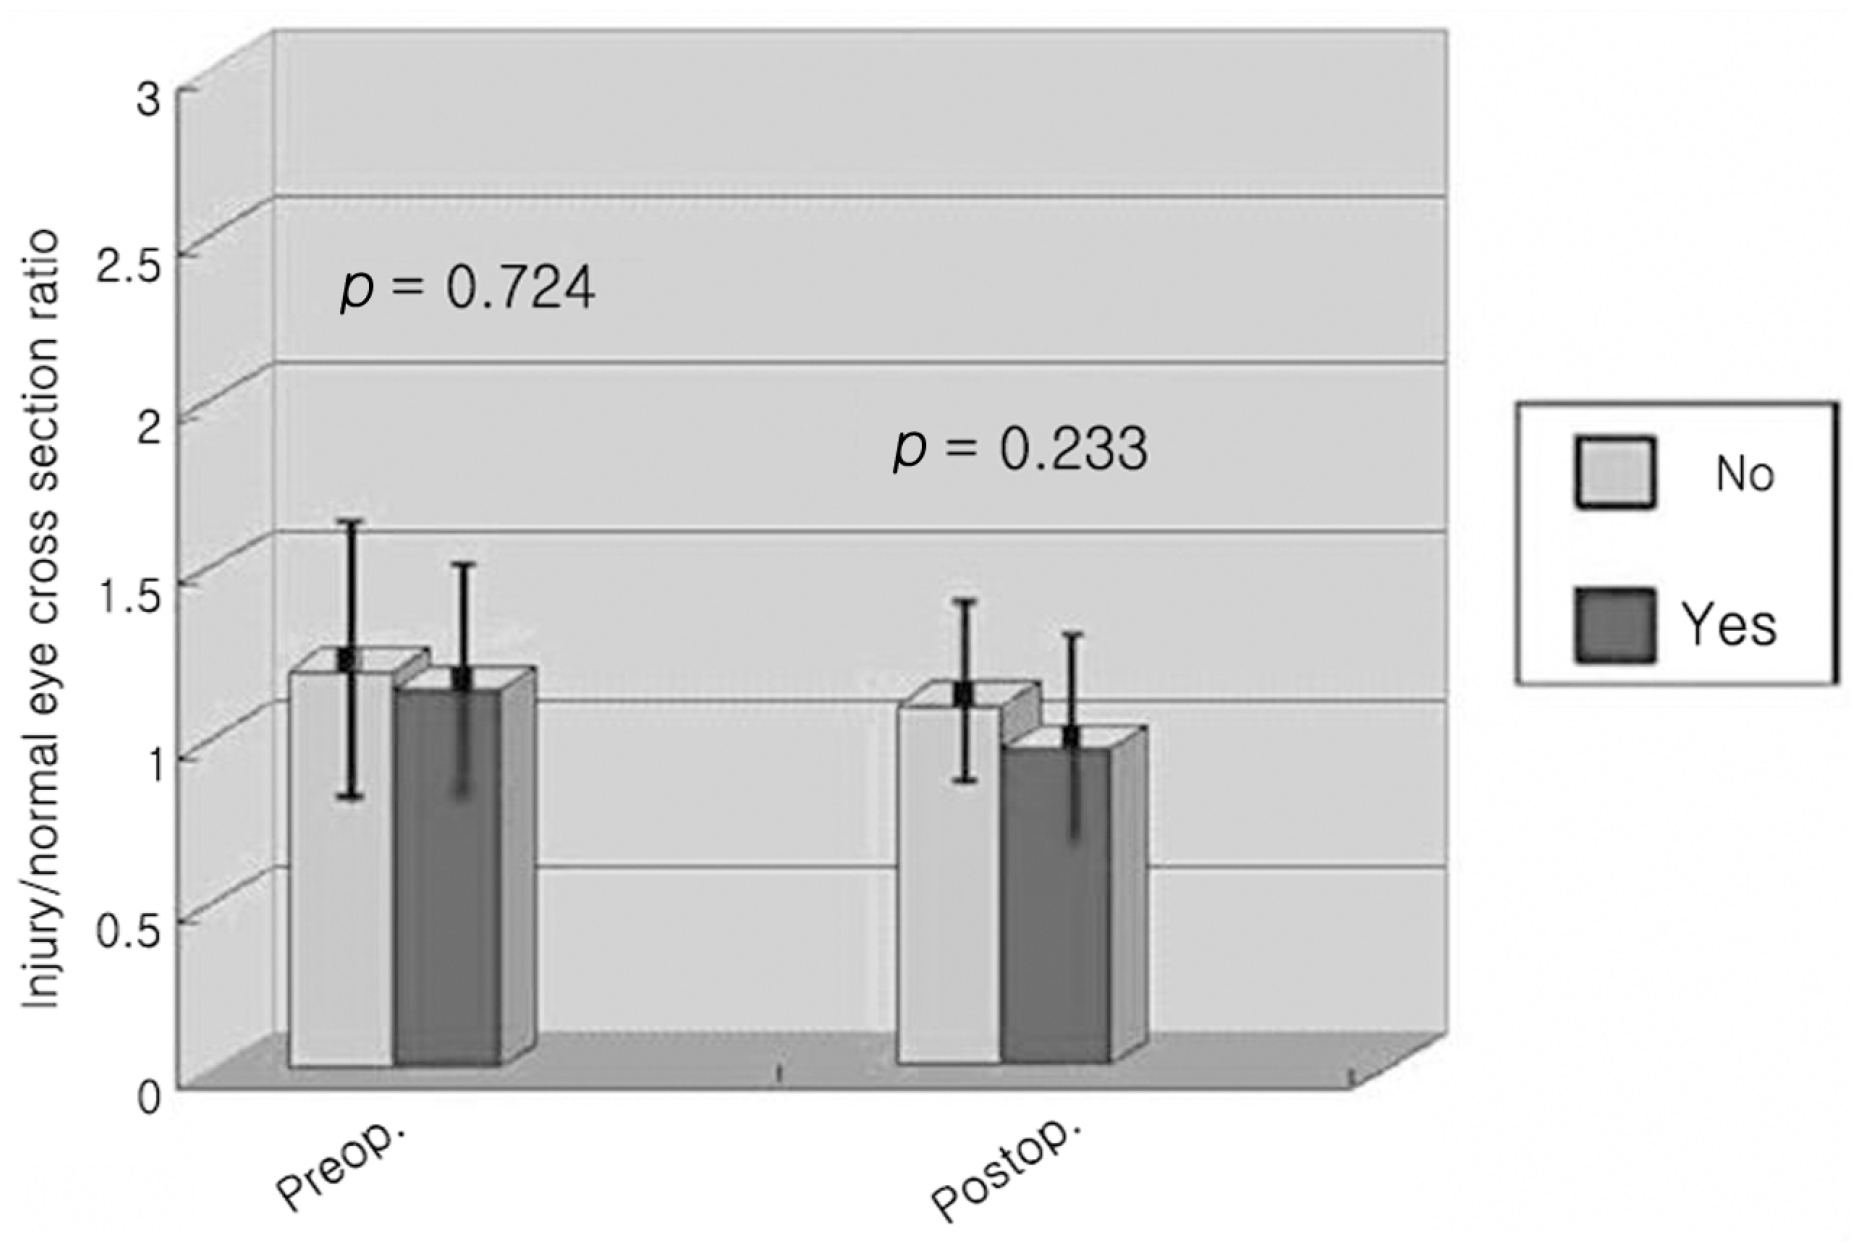 | Figure 14.The cross section ratio between injuredand normal eyes in relation to the paralytic limitation of ocular motion in patient with medial orbital wall fracture at preoperative and postoperative period. |
Table 1.
The comparison of short axis/long axis ratio of inferior rectus muscles at normal and injured eye in patients with inferior orbital wall fracture
| No | Short axis/long axis ratio | |
|---|---|---|
| Normal eye | 87 | 0.43±0.11 |
| Injured eye | 59 | 0.54±0.17 |
| p value | 0.001 |
Table 2.
The comparison of cross section ratio accor-ding to the mean value of short axis/long axis ratio of inferior rectus muscles at injured eye in patients with inferior orbital wall fracture
| Short axis/long axis ratio | No | Cross section ratio |
|---|---|---|
| <0.54* | 36 | 1.52±0.81 |
| ≥0.54* | 22 | 1.41±0.53 |
| p value | 0.949 |
Table 3.
The comparison of short axis/long axis ratio of medial rectus muscles at normal and injured eye in patients with medial orbital wall fracture
| No | Short axis/long axis ratio | |
|---|---|---|
| Normal eye | 87 | 0.41±0.10 |
| Injured eye | 53 | 0.58±0.19 |
| p value | 0.000 |


 PDF
PDF ePub
ePub Citation
 Print
Print


 XML Download