

 PDF
PDF ePub
ePub Citation
 Print
Print


Abstract
Purpose:
To evaluate the differences between IOLMasterⓇ and A-scans in changes in axial length after vitrectomy in patients with macular disease.
Methods:
Using IOLMasterⓇ and A-scans, we measured preoperative and postoperative axial length in 12 eyes with epiretinal membranes (ERM) and in 8 eyes with macular holes (MH). The relationship between the absolute error in axial length after vitrec-tomy and both methods was assessed using Mann-Whitney U test. The correlation to central macular thickness was evaluated by Spearman’ s correlation coefficient.
Results:
In eyes with ERM and MH, preoperative and postoperative axial lengths obtained with both methods had no significant difference (p>0.05). The absolute error in axial length after vitrectomy was not significant using IOLMasterⓇ (ERM: 0.07±0.05 mm, MH: 0.04±0.02 mm, p>0.05) but was significant using A-scan (ERM: 0.20±0.11 mm, MH: 0.30±0.07 mm, p<0.05). The correlation between the change of axial length after vitrectomy and the central macular thickness was poor (IOLMasterⓇ: ERM; correlation coefficient = −0.182, p>0.05, MH; correlation coefficient = −0.054, p>0.05, A-scan: ERM; correlation coefficient = −0.210, p >0.05, MH; correlation coefficient = −0.156, p >0.05).
References
1. McDonald HR, Verre WP, Aaberg TM. Surgical management of idiopathic epiretinal membranes. Ophthamology. 1986; 93:978–83.

2. Brooks HL Jr. Macular hole surgery with and without internal limiting membrane peeling. Ophthalmology. 2000; 107:1939–48.
3. Holladay JT, Prager TC, Ruiz RS, et al. Improving the predicta-bility of intraocular lens power calculations. Arch Ophthalmol. 1986; 104:539–41.
4. Olsen T. Sources of error in intraocular lens power calculation. J Cataract Refract Surg. 1992; 18:125–9.
5. Kim HJ, Kim HJ, Joo CK. Comparison of IOL Master, A-scan and Orbscan II for measurement of axial length and anterior chamber depth. J Korean Ophthalmol Soc. 2003; 44:1519–27.
6. Tehrani M, Krummenauer F, Blom E, Dick HB. Evaluation of the practicality of optical biometry and applanation ultrasound in 253 eyes. J Cataract Refract Surg. 2003; 29:741–6.
7. Song BY, Yang KJ, Yoon KC. Accuracy of partial coherence interferometry in intraocular lens power calculation. J Korean Ophthalmol Soc. 2005; 46:775–80.
8. Hwang JS, Lee JH. Comparison of the IOL master and A-scan ultrasound: refractive results of 96 consecutive cases. J Korean Ophthalmol Soc. 2007; 48:27–32.
9. Drexler W, Findl O, Menapace R, et al. Partial coherence inter-ferometry: a novel approach to biometry in cataract surgery. Am J Ophthalmol. 1998; 126:524–34.
10. Findl O, Drexler W, Menapace R, et al. High precision biometry of pseudophakic eyes using partial coherence interferometry. J Cataract Refract Surg. 1998; 24:1087–93.
11. Haigis W, Lege B, Miller N, Schneider B. Comparison of immersion ultrasound biometry and partial coherence interferometry for intraocular lens calculation according to Haigis. Graefes Arch Clin Exp Ophthalmol. 2000; 238:765–73.
12. Vogel A, Dick HB, Krummenauer F. Reproducibility of optical biometry using partial coherence interferometry: intraobserver and interobserver reliability. J Cataract Refract Surg. 2001; 27:1961–8.
13. Kiss B, Findl O, Menapace R, et al. Biometry of cataractous eyes using partial coherence interferometry: clinical feasibility study of a commercial prototype I. J Cataract Refract Surg. 2002; 28:224–9.
14. Tehrani M, Krummenauer F, Kumar R, Dick HB. Comparison of biometric measurements using partial coherence interferometry and applanation ultrasound. J Cataract Refract Surg. 2003; 29:747–52.
15. Carpineto P, Ciancaglini M, Di Antonio L, et al. Fundus micro-perimetry patterns of fixation in type 2 diabetic patients with diffuse macular edema. Retina. 2007; 27:21–9.
16. Goebel W, Franke R. Retinal thickness in diabetic retinopathy: comparison of optical coherence tomography, the retinal thickness analyzer, and fundus photography. Retina. 2006; 26:49–57.
17. Lege BA, Haigis W. Laser interference biometry versus ultra-sound biometry in certain clinical conditions. Graefes Arch Clin Exp Ophthalmol. 2004; 242:8–12.
18. Ueda T, Nawa Y, Hara Y. Relationship between the retinal thickness of the macula and the difference in axial length. Graefes Arch Clin Exp Ophthalmol. 2006; 244:498–501.
19. Attas-Fox L, Zadok D, Gerber Y, et al. Axial length measurement in eyes with diabetic macular edema: A-scan ultrasound versus IOLMaster. Ophthalmology. 2007; 114:1499–504.
20. Goebel W, Kretzchmar-Gross T. Retinal thickness in diabetic retinopathy: a study using optical coherence tomography (OCT). Retina. 2002; 22:759–67.
21. Rose LT, Moshegov CN. Comparison of the Zeiss IOLMaster and applanation A-scan ultrasound: biometry for intraocular lens calculation. Clin Experiment Ophthalmol. 2003; 31:121–4.
22. Nemeth J, Fekete O, Pesztenlehrer N. Optical and ultrasound measurement of axial length and anterior chamber depth for intraocular lens power calculation. J Cataract Refract Surg. 2003; 29:85–8.
23. Chan A, Duker JS, Ko TH, et al. Normal macular thickness measurements in healthy eyes using Stratus optical coherence tomography. Arch Ophthalmol. 2006; 124:193–8.
Figure 1.
Scatter plot demonstrating the difference in the absolute error in axial length using IOLMasterⓇ and A− scan versus change in central macular thickness using optical coherence tomography after vitrectomy in epiretinal membrane and macular hole eyes (IOLMasterⓇ: Epiretinal Membrane; correlation coefficient=−0.182, p>0.05, Macular Hole; correlation coefficient=−0.054, p>0.05, A-scan: Epiretinal Membrane; correlation coefficient=−0.210, p>0.05, Macular Hole; correlation coefficient=−0.156, p>0.05).
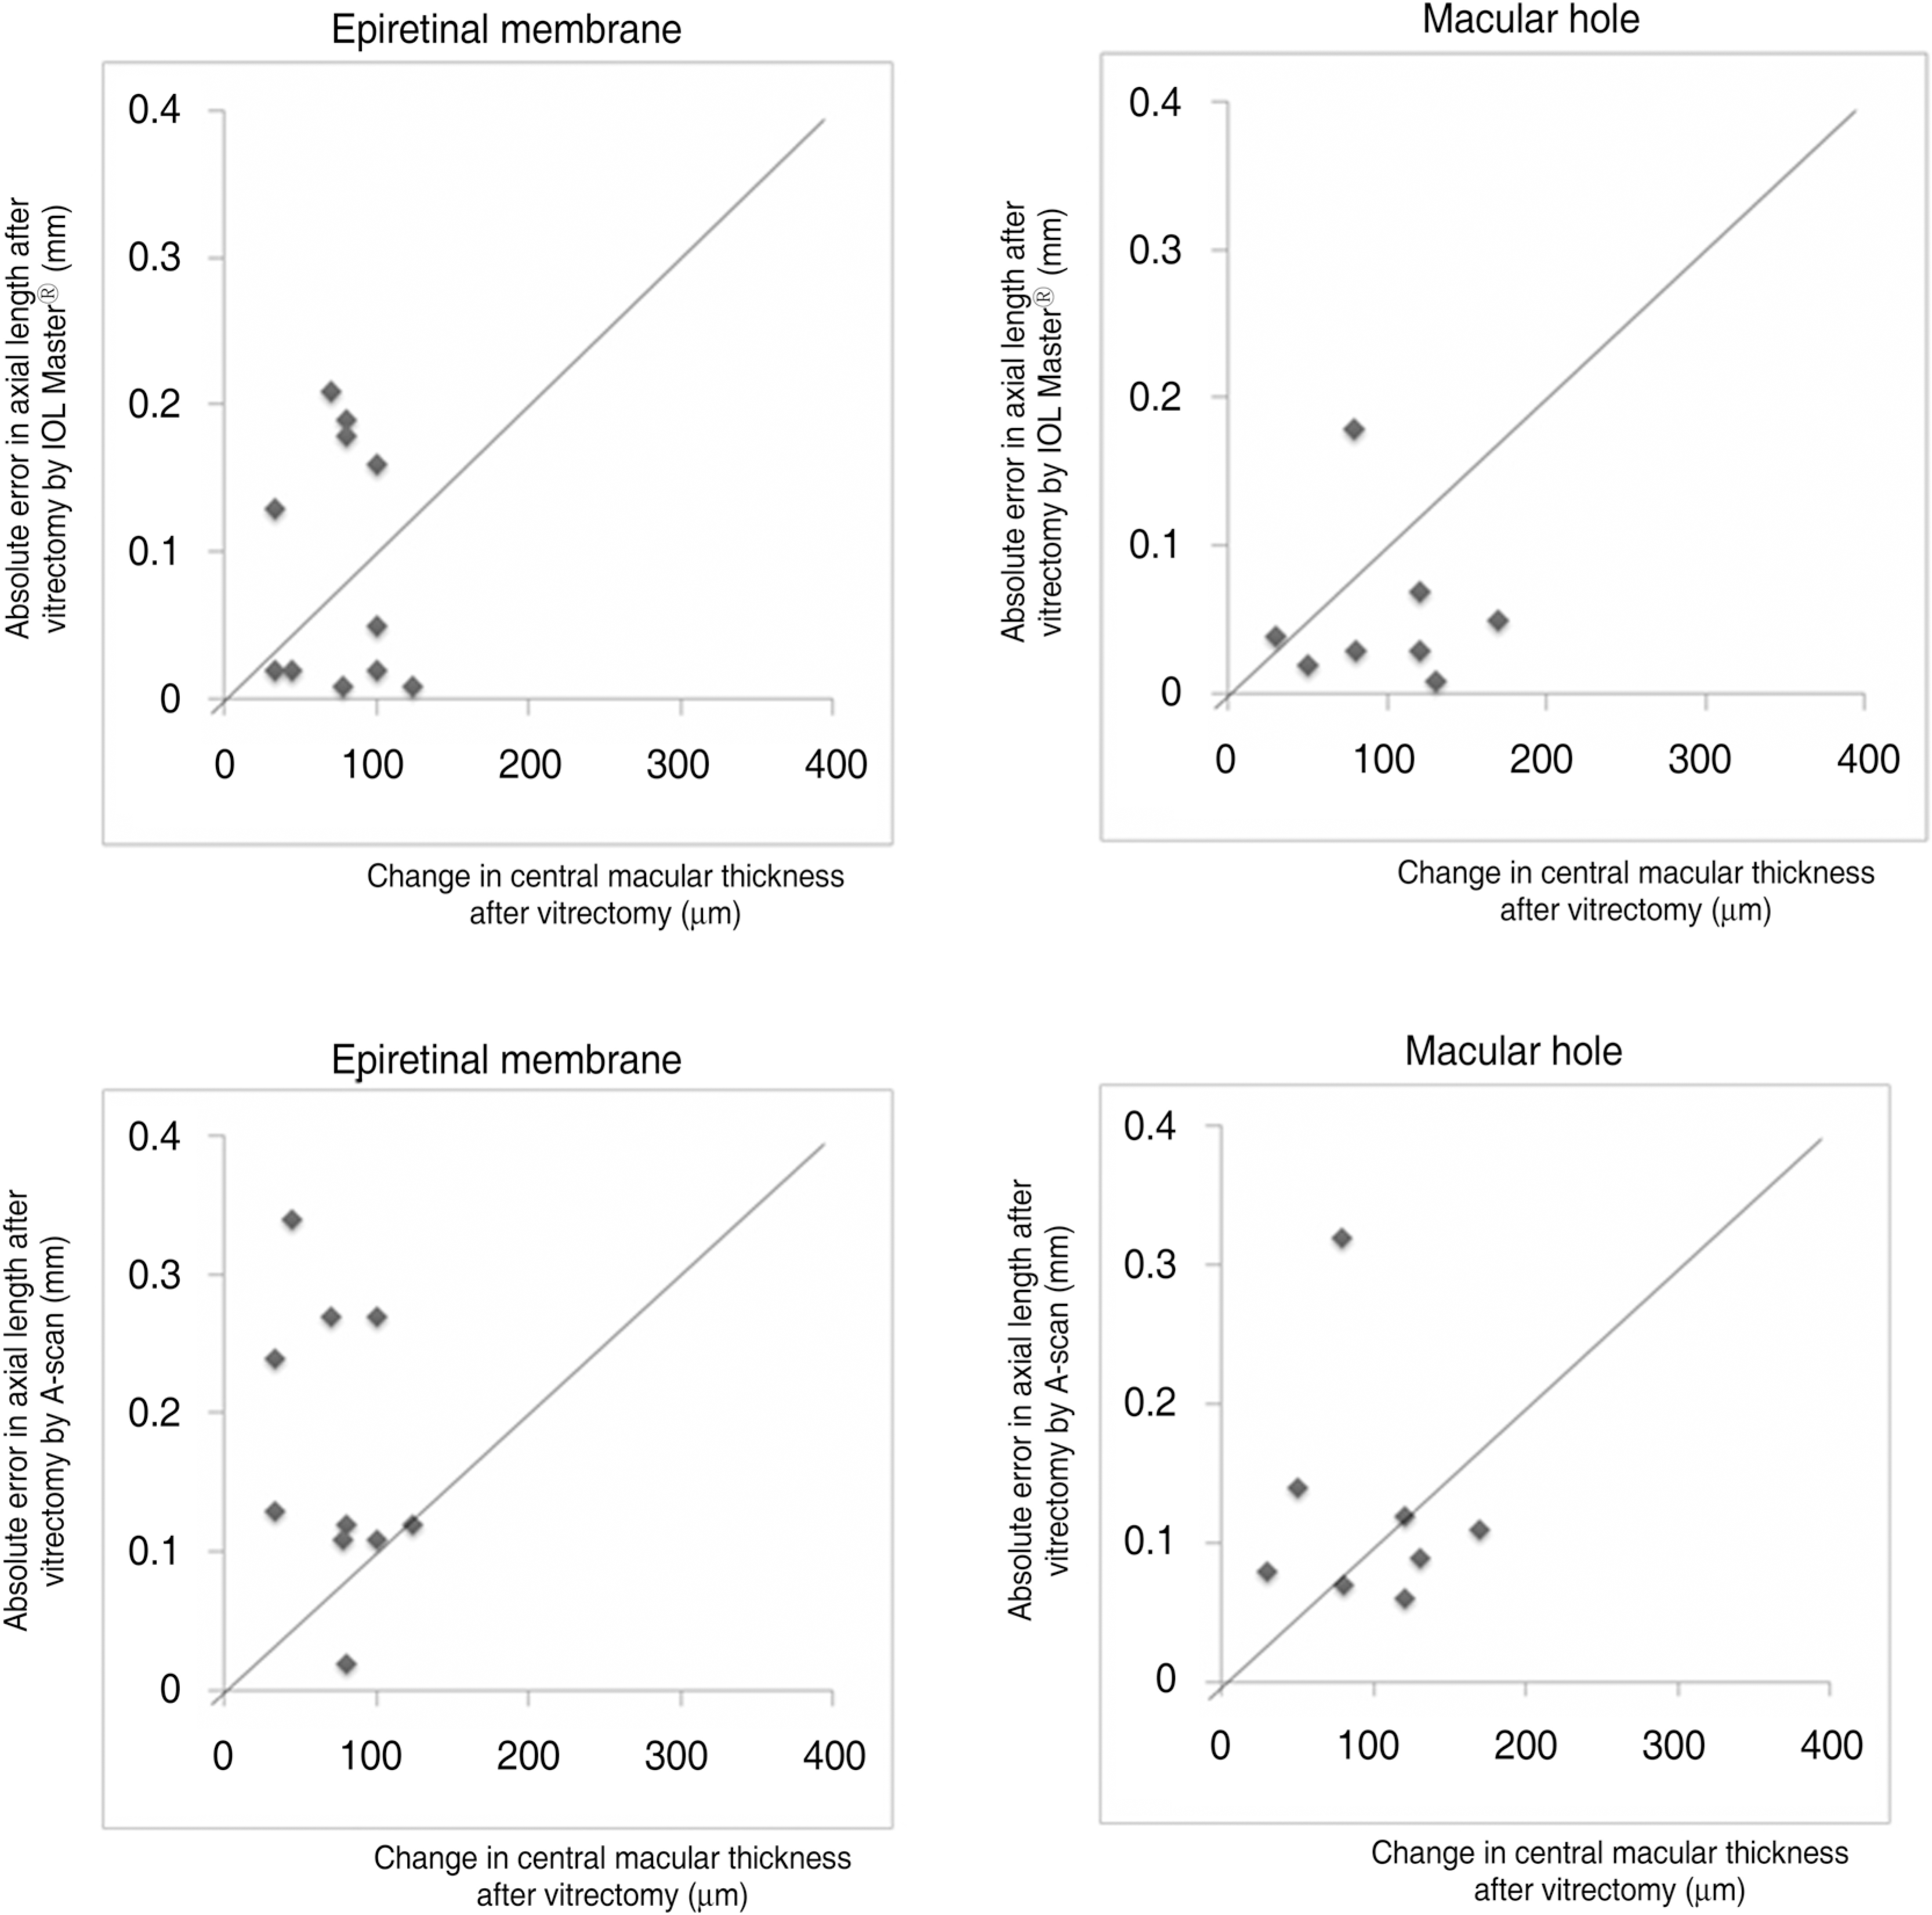
Table 1.
Demographics of patients
Table 2.
Comparison of IOLMaster® and A-scan in axial length measurement before and after vitrectomy
|
Epiretinal membrane |
Macular hole |
|||
|---|---|---|---|---|
| Preoperative axial length measurements | Postoperative axial length measurements | Preoperative axial length measurements | Postoperative axial length measurements | |
| IOL MasterⓇ | 23.11±0.87 | 23.16±0.88 | 22.71±0.55 | 22.71±0.54 |
| A-scan | 23.04±0.95 | 23.18±0.96 | 23.00±0.60 | 22.85±0.61 |
| p>0.05∗ | p>0.05∗ | p>0.05∗ | p>0.05∗ | |
 XML Download