Abstract
Purpose
To evaluate the relationship between focal aggravation of the macular edema on retinal thickness change analysis (RTCA) of optical coherence tomography (OCT) and fluorescein angiographic findings in patients after an intravitreal triamcinolone injection (IVTA).
Methods
From May 2004 to April 2005, RTCA in a fast macular thickness map (FMTM) of OCT was performed before and 4 weeks after IVTA in patients who had macular edemas caused by diabetic retinopathy and retinal vein occlusion. Patients underwent IVTA, and focal aggravation of the edema was detected. After overlapping the OCT findings onto angiographic pictures, the relationship between the focal aggravation on OCT and the leaking point on angiography was investigated.
References
1. Ferris FL 3rd, Patz A. Macular edema: a complication of diabetic retinopathy. Surv Ophthalmol. 1984; 28:452–61.

2. Pelzek C, Lim JI. Diabetic macular edema: review and update. Ophthalmol Clin North Am. 2002; 15:555–63.

3. Shahidi M, Ogura Y, Blair NP, et al. Retinal thickness analysis for quantitative assessment of diabetic macular edema. Arch Ophthalmol. 1991; 109:1115–9.

4. Early Treatment Diabetic Retinopathy Study Research Group. Grading diabetic retinopathy from stereoscopic color fundus photographs an extension of the modified Airlie House classification. ETDRS report number 10. Ophthalmology. 1991; 98:S786–806.
5. Choi CU, Seo SW, Yang YS. Different effect of IVTA in the management of macula edema secondary to perfusion and ischemic type BRVO. J Korean Ophthalmol Soc. 2007; 48:49–54.
6. Hwang YH, Moon SW. Intravitreal and additional posterior subtenon triamcinolone injection in diabetic macular edema. J Korean Ophthalmol Soc. 2007; 48:506–12.
7. Martidis A, Duker JS, Greenberg PB, et al. Intravitreal triamcinolone for refractory diabetic macular edema. Ophthalmology. 2002; 109:920–7.

8. Massin P, Vicaut E, Haouchine B, et al. Reproducibility of retinal mapping using optical coherence tomography. Arch Ophthalmol. 2001; 119:1135–42.

9. Hee MR, Puliafito CA, Wong C, et al. Quantitative assessment of macular edema with optical coherence tomography. Arch Ophthalmol. 1995; 113:1019–29.

10. Hee MR, Izatt JA, Swanson EA, et al. Optical coherence tomography of the human retina. Arch Ophthalmol. 1995; 113:325–32.

11. Hee MR, Puliafito CA, Duker JS, et al. Topography of diabetic macular edema with optical coherence tomography. Ophthalmology. 1998; 105:360–70.

12. Hee MR. Artifacts in optical coherence tomography topographic maps. Am J Ophthalmol. 2004; 104:154–5.

13. Ray R, Stinnett SS, Jaffe GJ. Evaluation of image artifact produced by optical coherence tomography of retinal pathology. Am J Ophthalmol. 2005; 139:18–29.

14. Sadda SR, Tan O, Walsh AC, et al. Automated detection of clinically significant macular edema by grid scanning optical coherence tomography. Ophthalmology. 2006; 113:1187–96.

15. Swanson EA, Izatt JA, Hee MR, et al. In vivo retinal imaging by optical coherence tomography. Opt Lett. 1993; 18:1864–6.

16. Huang D, Wang J, Lin CP, et al. Micron-resolution ranging of cornea and anterior chamber by optical reflectometry. Laser Surg Med. 1991; 11:419–25.
17. Swanson EA, Huang D, Hee MR, et al. High-speed optical coherence domain reflectometry. Opt Lett. 1992; 17:151–3.

18. Hee MR, Huang D, Swanson EA, et al. Polarization-sensitive low coherence reflectometer for birefringence characterization and ranging. J Opt Soc Am B. 1992; 9:903–8.
19. Yamaguchi Y, Otani T, Kishi S. Serous macular detachment in branch retinal vein occlusion. Retina. 2006; 26:1029–33.

20. Catier A, Tadayoni R, Paques M, et al. Characterization of macular edema from various etiologies by optical coherence tomography. Am J Ophthalmol. 2005; 140:200–6.

21. Gibran SK, Cullinane A, Jungkim S, Cleary PE. Intravitreal triamcinolone for diffuse diabetic macular oedema. Eye. 2006; 20:720–4.

22. Polito A, Shah SM, Haller JA, et al. Comparison between retinal thickness analyzer and optical coherence tomography for assessment of foveal thickness in eyes with macular disease. Am J Ophthalmol. 2002; 134:240–51.

23. Sanchez-Tocino H, Alvarez Vidal A, Maldonado MJ, et al. Retinal thickness study with optical coherehce tomography in patients with diabetes. Invest Ophthalmol Vis Sci. 2002; 43:1588–94.
24. Finkelstein D. Ischemic macular edema. Recognition and favorable natural history in branch vein occlusion. Arch Ophthalmol. 1992; 110:1427–34.

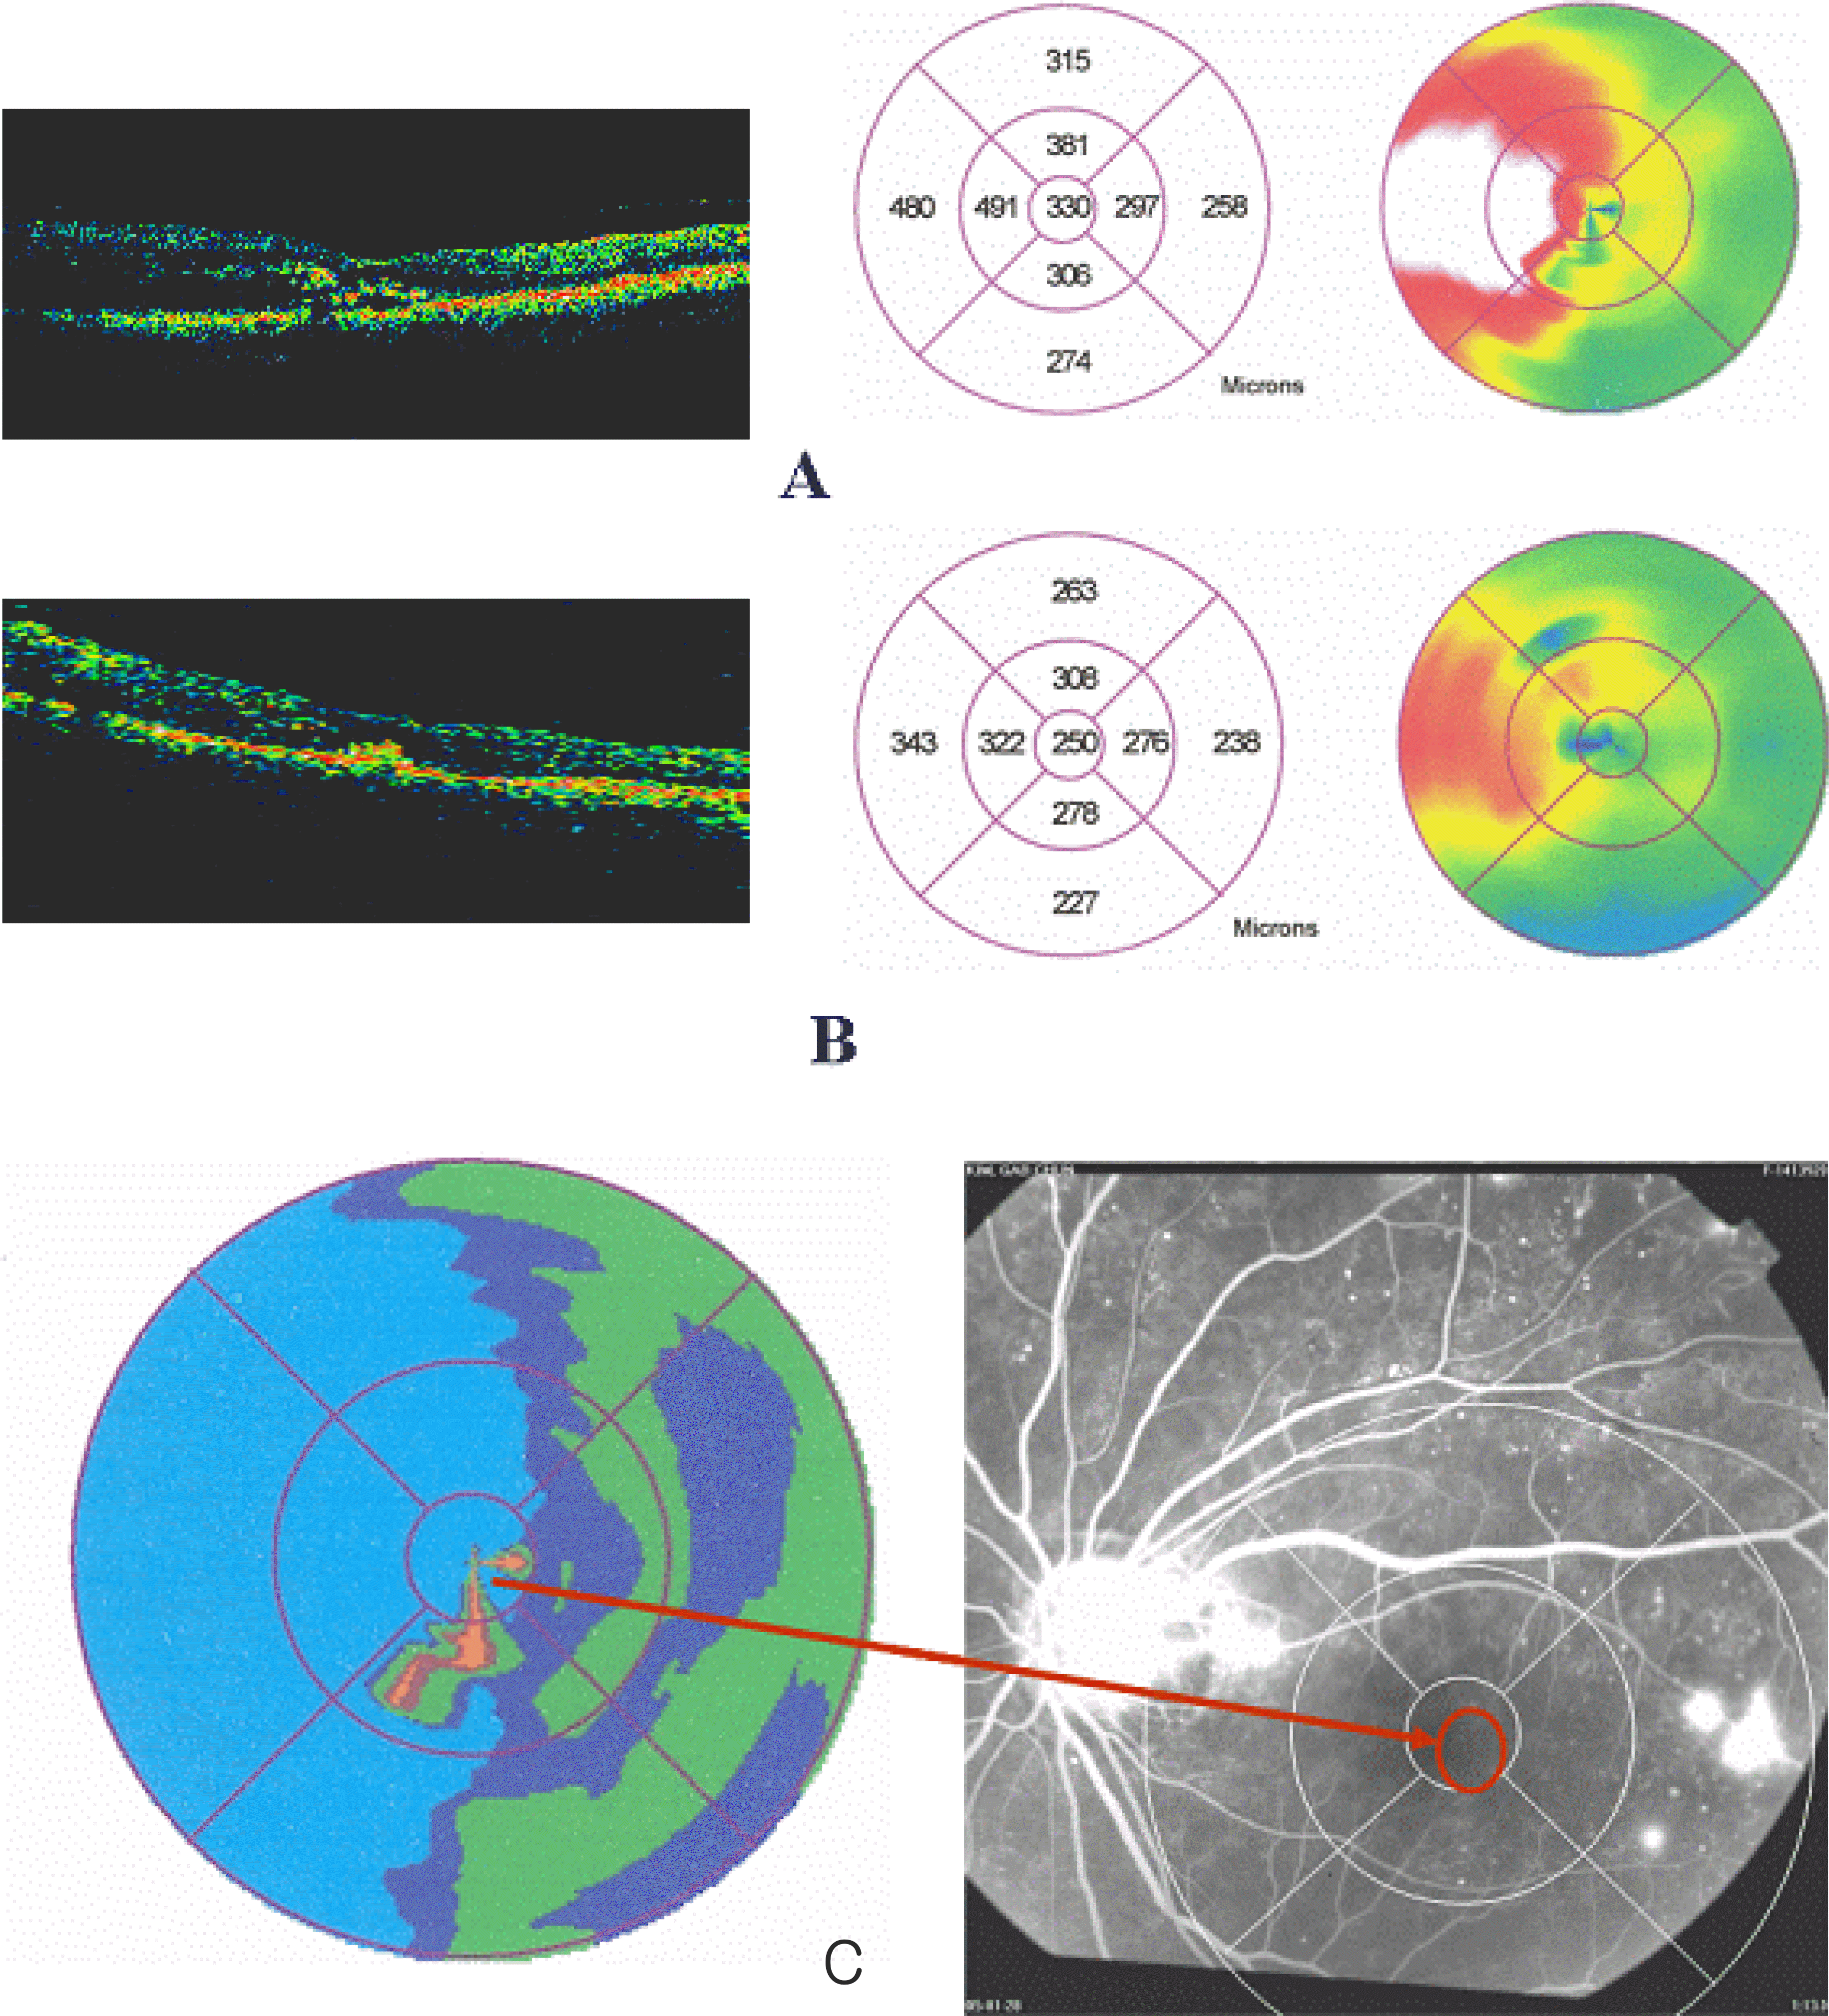
Figure 1.
Case 1. Preinjetion (A) and postinjection (B) OCT fast macular thickness map (FMTM) findings. Retinal thickness change analysis change (RTCA, C left) shows peripheral abnormal thickening after IVTA. There is no correlation between focal aggravation on RTCA and fluorescein angiographic image (C right).

Figure 2.
Case 2. Preinjetion (A) and postinjection (B) OCT fast macular thickness map (FMTM) findings. There is a mismatch between average thickness value (B center) and focal aggravation area on retinal thickness change analysis (RTCA, C left). RTCA shows central abnormal thickening after IVTA. There is no correlation between focal aggravation on RTCA and fluorescein angiographic image (C right).

Figure 3.
Case 3. Preinjetion (A) and postinjection (B) OCT fast macular thickness map (FMTM) findings. Thickness value between preinjection and postinjection FMTM is mismatched with RTCA color change and it might be an error of OCT. Retinal thickness change analysis change (RTCA, C left) shows central abnormal thickening after IVTA. There is some correlation between focal aggravation on RTCA and fluorescein angiographic image (C right).

Figure 4.
Case 4. Preinjetion (A) and postinjection (B) OCT fast macular thickness map (FMTM) findings. Retinal thickness change analysis change (RTCA, C left) shows peripheral abnormal thickening after IVTA. There is no correlation between focal aggravation on RTCA and fluorescein angiographic image (C right).

Figure 5.
Case 5. Preinjetion (A) and postinjection (B) OCT fast macular thickness map (FMTM) findings. Retinal thickness change analysis change (RTCA, C left) shows peripheral abnormal thickening. There is no correlation between focal aggravation on RTCA and fluorescein angiographic image (C right).


 PDF
PDF ePub
ePub Citation
 Print
Print


 XML Download