Abstract
Methods
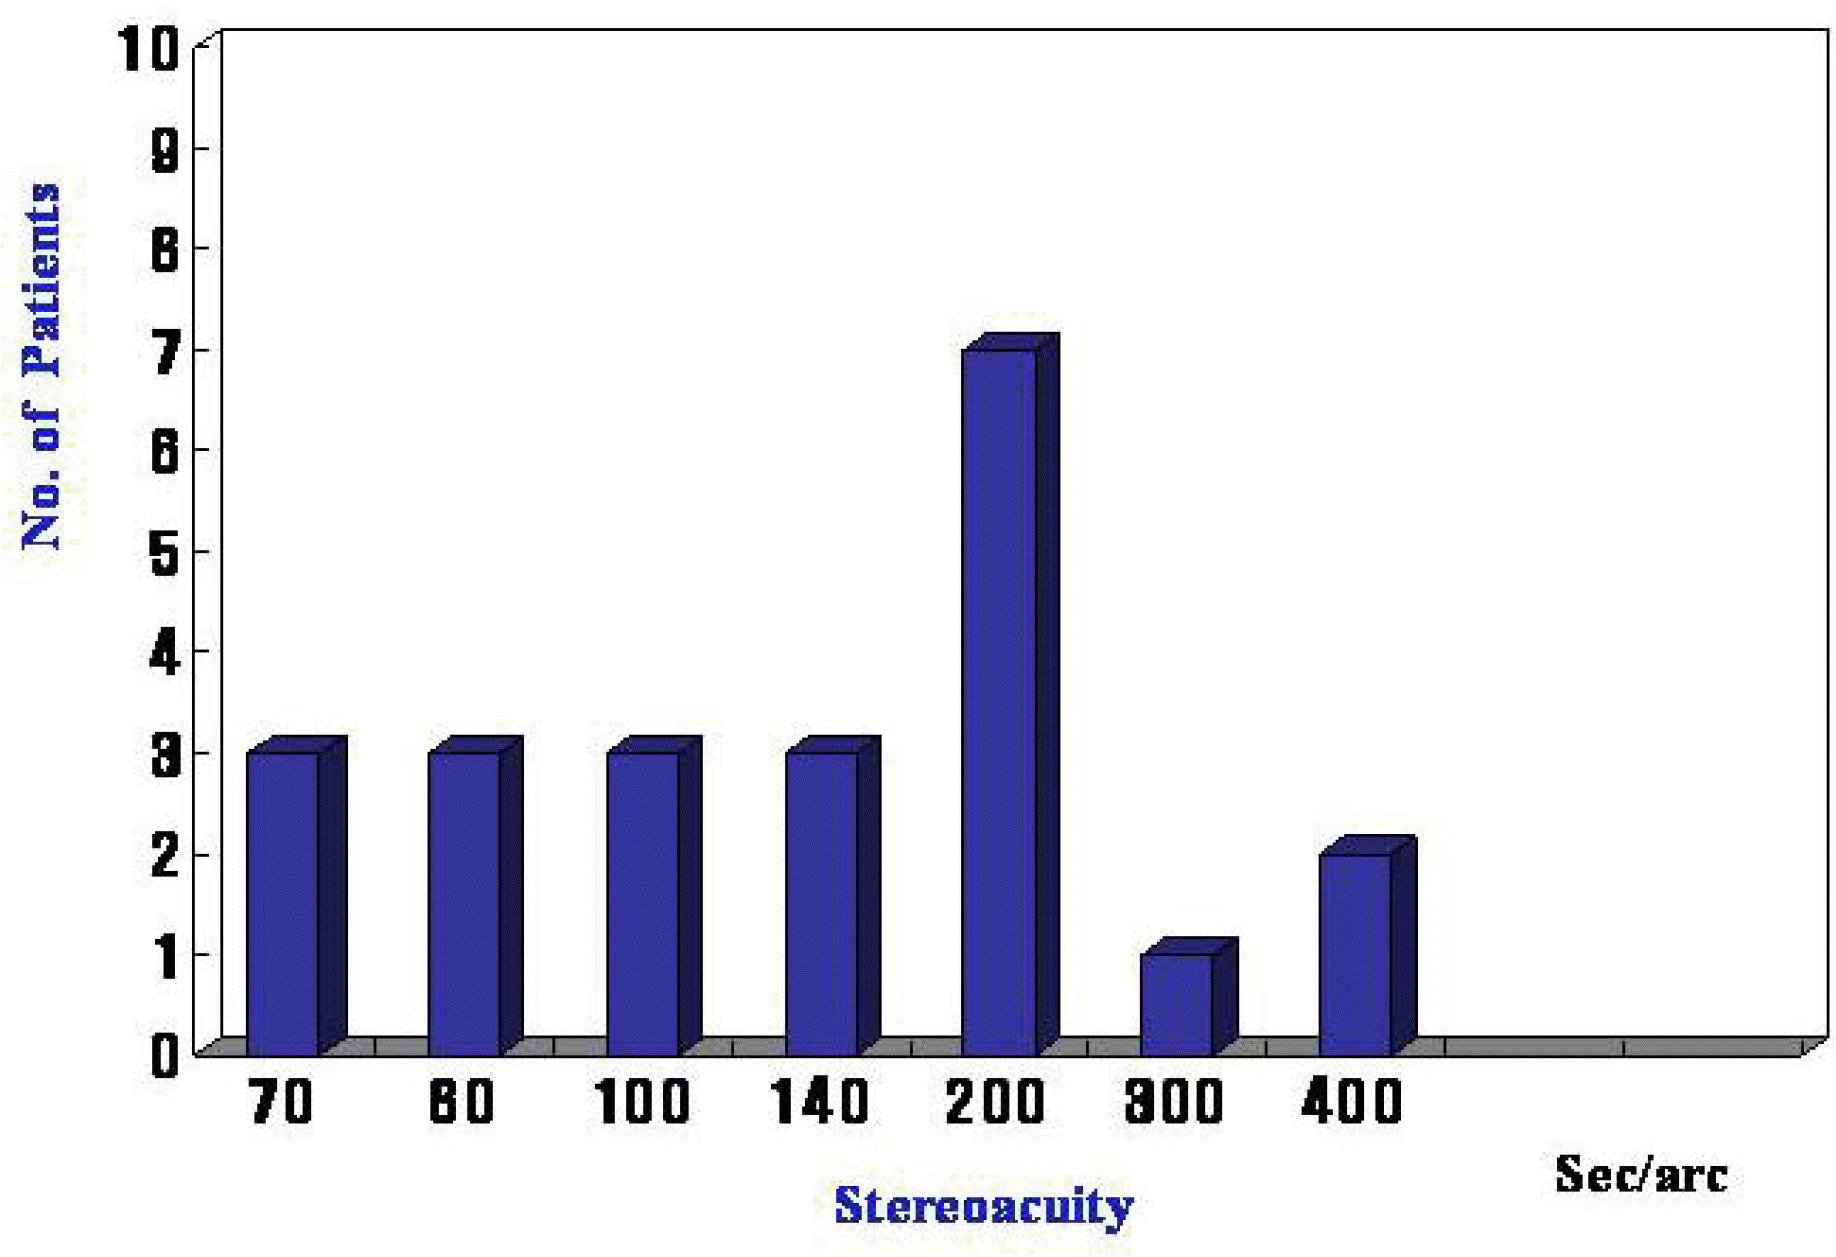
We retrospectively reviewed 38 eyes of 22 patients who had undergone irrigation and aspiration of cataracts and primary posterior chamber intraocular lens implantation from February 1992 to July 2006. In all patients, stereoacuity was assessed with the Titmus stereo test. Patients were divided into two groups according to stereoacuity: group 1 (n=9) had a stereoacuity less than 100 sec/arc; group 2 (n=13) had a stereoacuity more than 100 sec/arc. Nine variables associated with stereoacuity were evaluated in each group.
Results
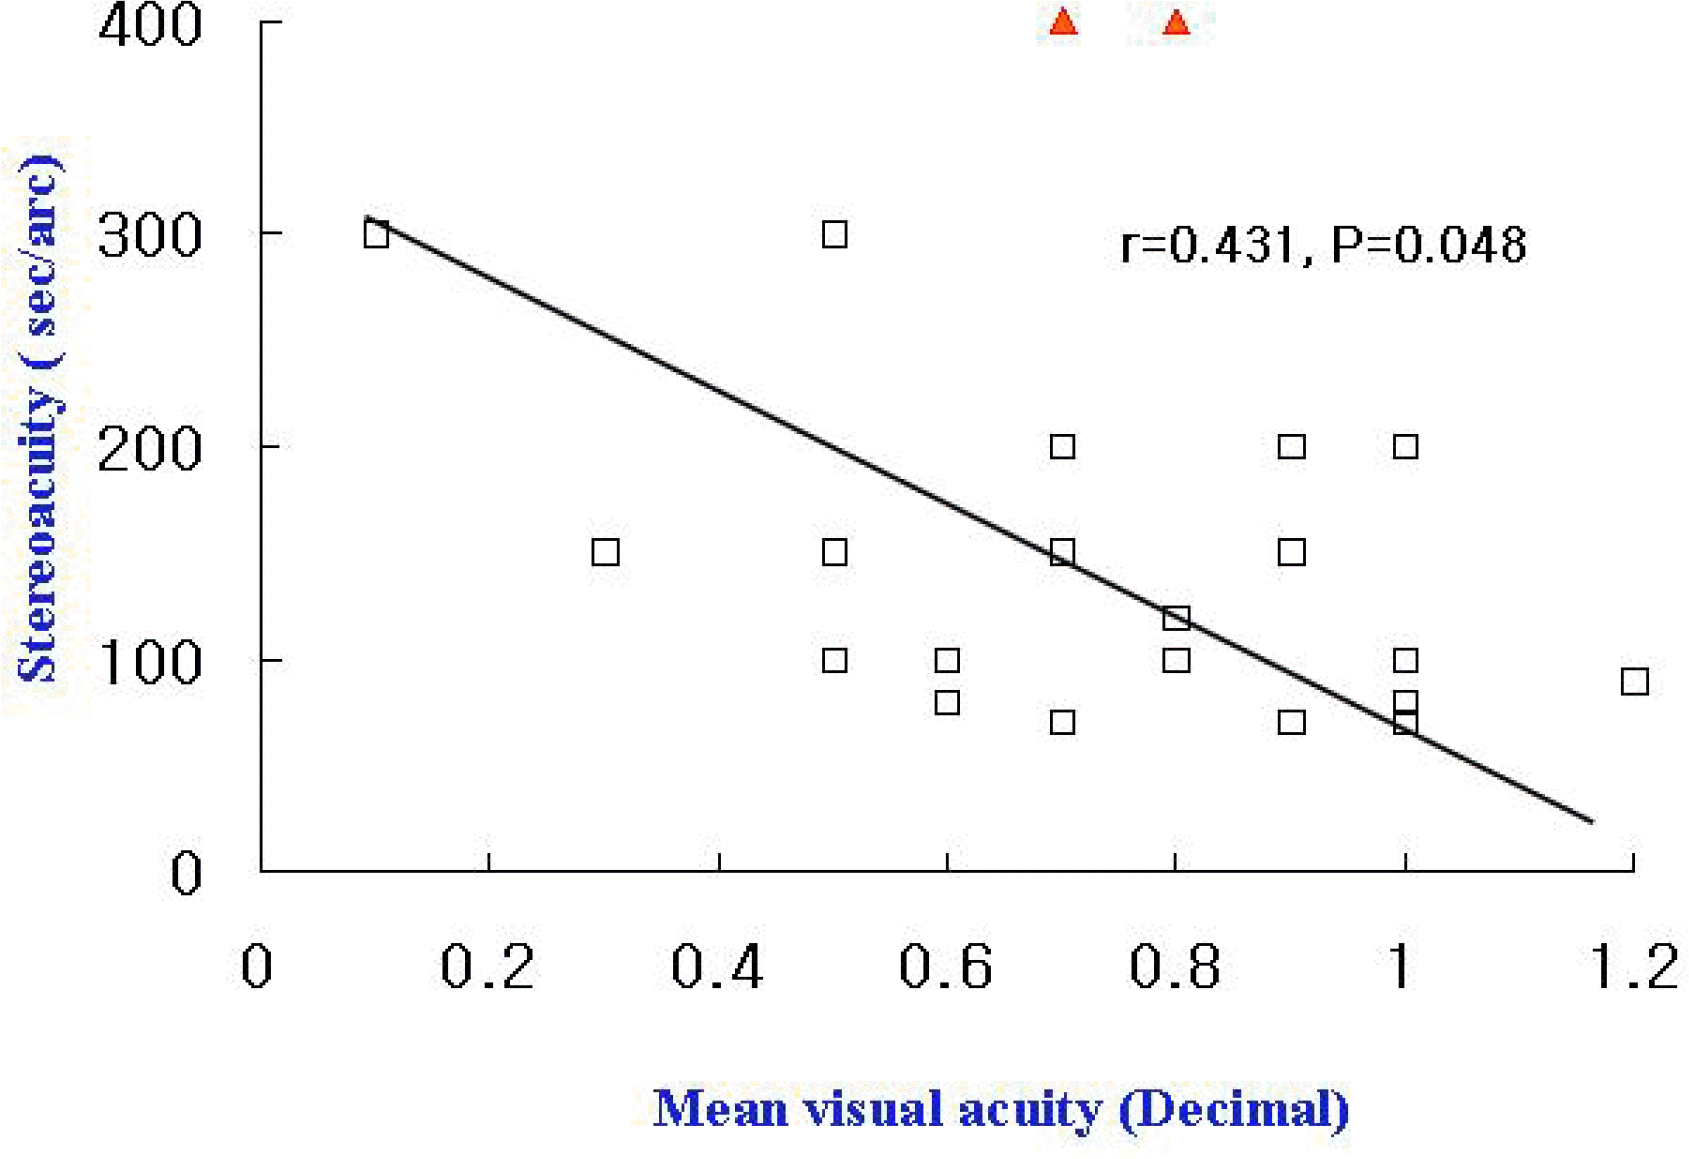
Postoperative strabismus was the strongest factor influencing the stereoacuity level. Good postoperative mean visual acuity was related with good stereoacuity. Though mean visual acuity in two children with exodeviation over 30PD was 0.7 and 0.8, their stereoacuity was 400 sec/arc. Showing little difference in the spherical equivalent between the eyes was also related to good stereoacuity.
Go to : 
References
1. Tytla ME, Lewis TL, Maurer D, Brent HP. Stereopsis after congenital cataract. Invest Ophthalmol Vis Sci. 1993; 34:1767–73.
2. Hayashi K, Hayashi H. Stereopsis in bilaterally pseudophakic patients. J Cataract Refract Surg. 2004; 30:1466–70.

3. Suzuki R, Katayama T, Egi K, et al. Binocular function in unilateral pseudophakia. Jpn IOL Soc J. 1989; 3:47–52.
4. Kwapiszeski BR, Gallagher CC, Holmes JM. Improved stereoacuity: an indication for unilateral cataract surgery. J Cataract Refract Surg. 1996; 22:441–5.

6. Lightholder PA, Phillips LJ. Evaluation of the binocularity of 147 unilateral and bilateral pseudophakic patients. Am J Optom Physiol Opt. 1979; 56:451–9.

8. Katsumi O, Tanino T, Hirose T. Effect of aniseikonia on binocular function. Invest Ophthalmol Vis Sci. 1986; 27:601–4.
9. Katsumi O, Miyajima H, Ogawa T, Hirose T. Ansiseikonia and stereoacuity in pseudophakic patients; unilateral and bilateral cases. Ophthalmology. 1992; 99:1270–7.
10. Robb RM, Petersen RA. Outcome of treatment for bilateral congenital cataracts. Ophthalmic Surg. 1992; 23:650–6.

11. Hong SW, Park SC. Stereoacuity of normal subjects assessed by Fisby Davis Distance Stereotest. J Korean Ophthalmol Soc. 2006; 47:154–9.
12. Hodgetts DJ. Functional Outcome of monocular and binocular congenital cataract. Part II: Binocularity. Am Orthoptic J. 1997; 47:39–44.

13. Fred MG, Marshall MP. Stereopsis after congenital monocular cataract extraction. Am J Ophthalmol. 1992; 114:314–7.
14. Von Noorden GK. Binocular vision and space perception. von Noorden GK, Campos EC, editors. Binocular vision and ocular motility. 6th ed.St. Louis: Mosby;2002. chap. 2.
15. Levy NS, Glick EB. Stereoscopic perception and Snellen visual acuity. Am J Ophthalmol. 1974; 78:722–4.

16. Fawcett SL, Wang YZ, Birch EE. The critical period for susceptibility of human stereopsis. Invest Ophthalmol Vis Sci. 2005; 46:521–5.

17. Hosal BM, Biglan AW, Elhan AH. High levels of binocular function are achievable after removal of monocular cataracts in children before 8 years of age. Ophthlamology. 2000; 107:1647–55.

18. Daw NW. Visual development. New York: Plenum Press;1995. p. 228.
Go to : 
 | Figure 2.Relationship between postoperative mean visual acuity between fellow eyes and stereopsis. Mean visual acuity in two children with exodeviation over 30PD was 0.7 and 0.8, respectively. But stereoacuity was lower than that of children without strabismus with the same level of mean visual acuity (red triangle). |
Table 1.
Associations of laterality of cataract with stereoacuity
| Group I (≤100 sec/arc) n=9 (40.9%) | Group II (>100 sec/arc) n=13 (59.1%) | ||
|---|---|---|---|
| Bilateral cataract | 2 (33.3%) | 4 (66.7%) | P=0.196* |
| Unilateral cataract | 7 (43.8%) | 9 (56.3%) |
Table 2.
Associations of surgical methods with stereoacuity
| Group I (≤100 sec/arc) n=9 (40.9%) | Group II (>100 sec/arc) n=13 (59.1%) | ||
|---|---|---|---|
| Intact posterior capsule | 0 (0%) | 4 (100%) | P=0.110* |
| Optic capture through PCCC† | 5 (41.7%) | 7 (58.3%) | |
| Anterior vitrectomy | 4 (66.7%) | 2 (33.3%) |
Table 3.
Associations of after cataract with stereoacuity
| Group I (≤100 sec/arc) n=9 (40.9%) | Group II (>100 sec/arc) n=13 (59.1%) | ||
|---|---|---|---|
| Presence of after cataract | 2 (28.6%) | 5 (71.4%) | P=0.421* |
| Absence of after cataract | 7 (46.7%) | 8 (53.3%) |
Table 4.
Associations of postoperative onset of strabismus with stereoacuity
| Group I (≤100 sec/arc) n=9 (40.9%) | Group II (>100 sec/arc) n=13 (59.1%) | ||
|---|---|---|---|
| Presence of strabismus (>10PD†) | 0 (0%) | 5 (100%) | P=0.049* |
| Absence of strabismus (≤10PD†) | 9 (52.9%) | 8 (47.1%) |
Table 5.
Associations of sensory fusion with stereoacuity
| Group I (≤100 sec/arc) n=9 (40.9%) | Group II (>100 sec/arc) n=13 (59.1%) | ||
|---|---|---|---|
| Presence of fusion | 9 (56.2%) | 7 (43.8%) | P=0.017* |
| Absence of fusion | 0 (0%) | 6 (100%) |
Table 6.
Simple associations of visual acuity difference, mean visual acuity, spherical equivalent difference between fellow eyes, and age at surgery with stereoacuity
| Correlation Coefficient | P-Value* | |
|---|---|---|
| Visual acuity difference | 0.116 | 0.608 |
| Mean visual acuity | 0.233 | 0.297 |
| Spherical equivalent difference | 0.423 | 0.042 |
| Age at surgery | −0.02 | 0.929 |


 PDF
PDF ePub
ePub Citation
 Print
Print


 XML Download