Abstract
Purpose
To assess macular function by multifocal electroretinography after reattachment of macula-off retinal detachment and to evaluate relationship between duration of macular detachment (DMD) and functional recovery.
Methods
Nineteen patients (19 eyes) with macula-off rhegmatogenous retinal detachment underwent pneumatic retinopexy or scleral buckling. Retinal reattachment was obtained successfully in all patients. Duration of follow-up of all patients is at least more than 12 months. Eyes were divided into 2 groups, corresponding to the DMD: Group A (within 7 days, n=9 eyes), Group B (>7 days, n=10 eyes). The amplitudes and implicit times of N1-wave and P1-wave of mfERGs in Area 1 (Ring 1), Area 2 (Ring 1+2) were compared between Group A and B and between Group A and control group.
Results
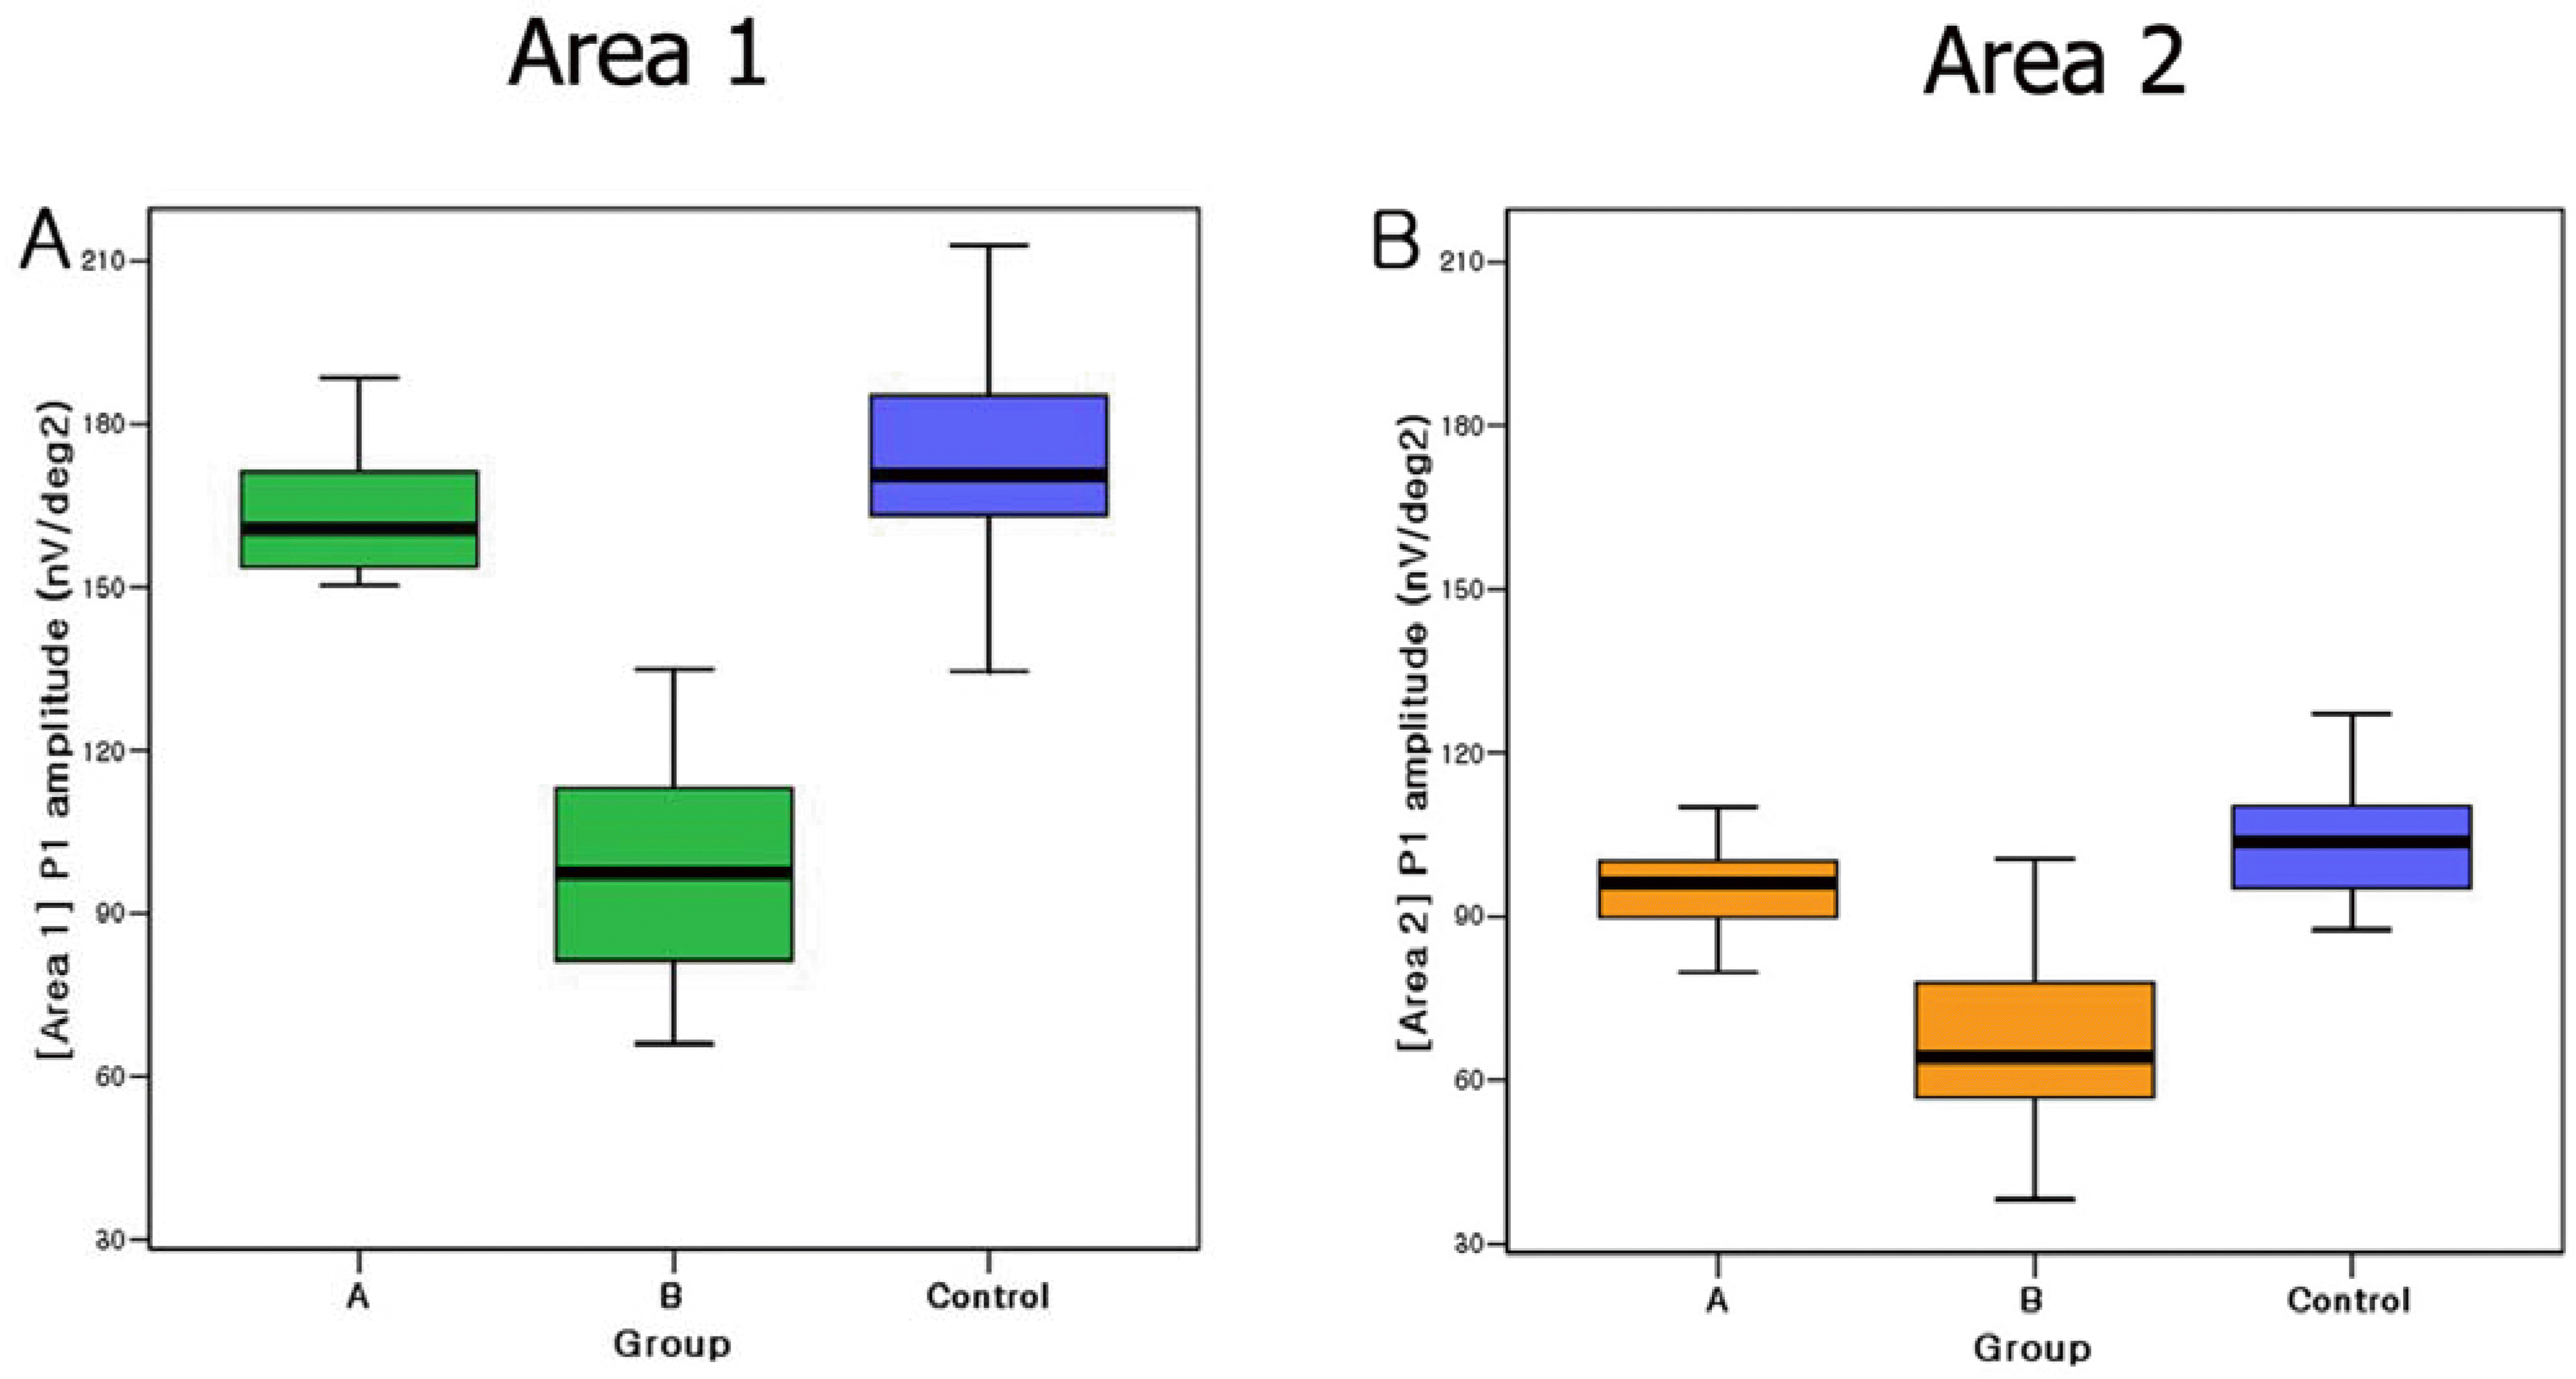
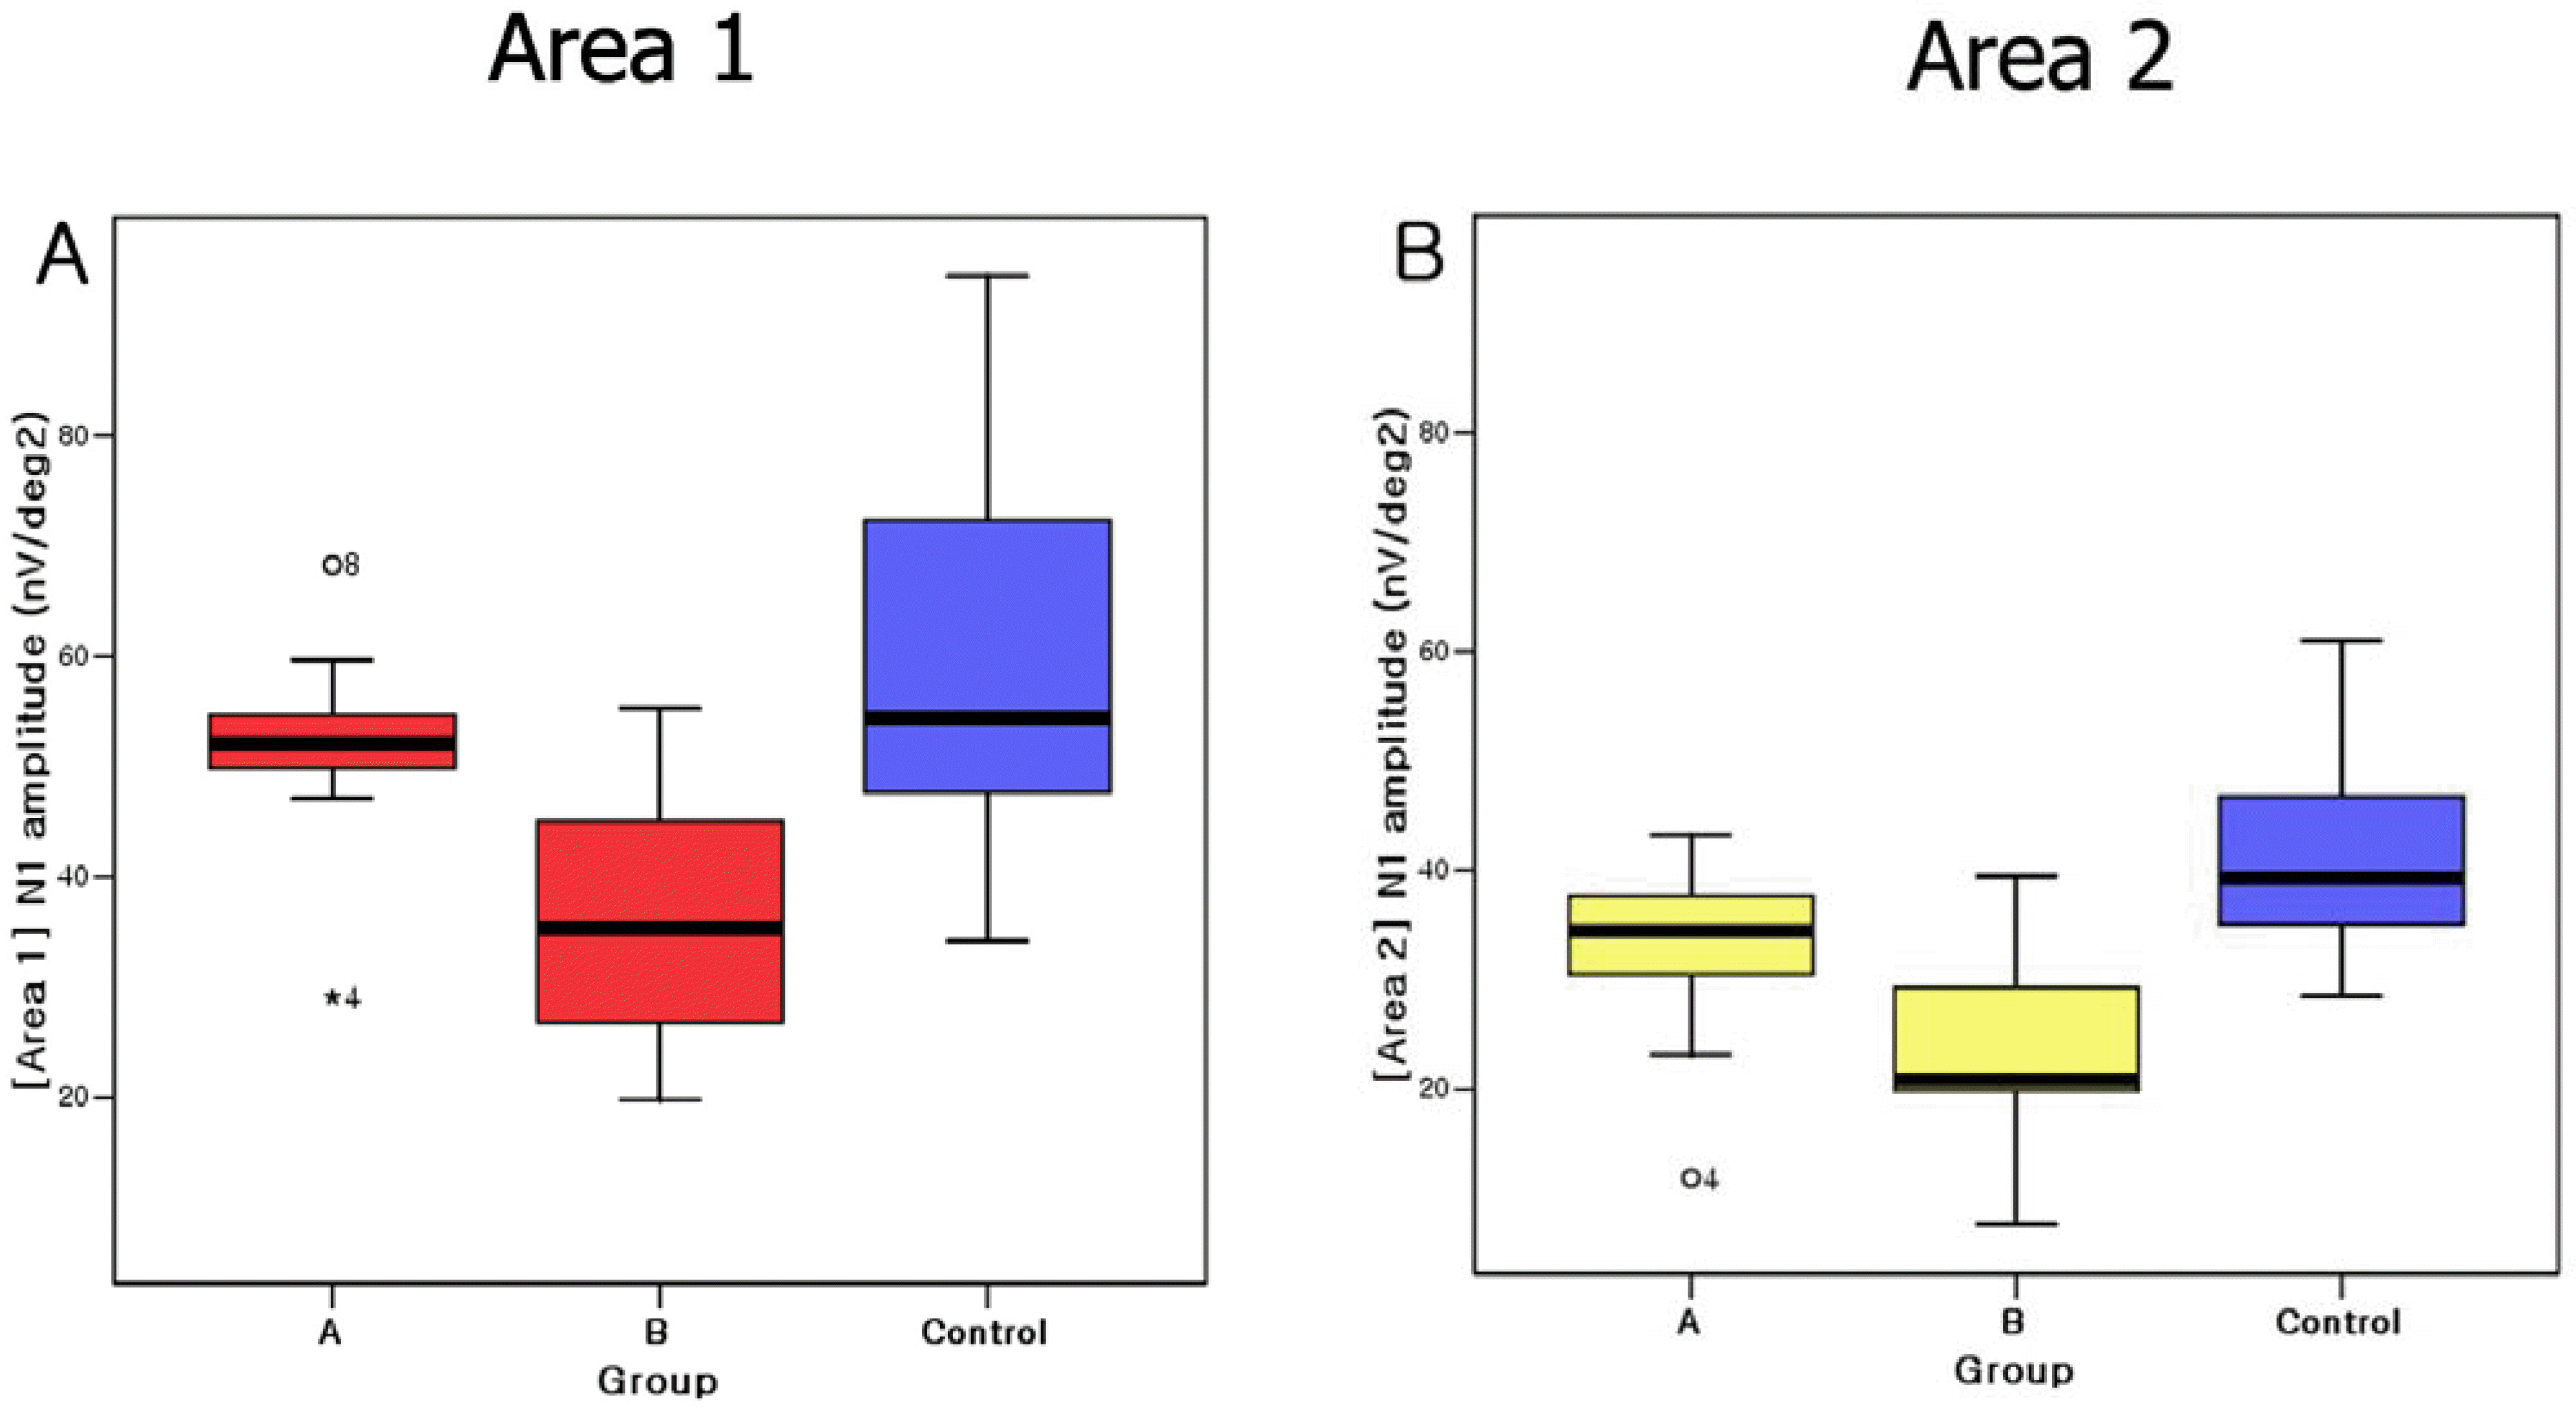
The P1 amplitudes in Area 1 and 2 were significantly different between Group A and B (P<0.05). N1 amplitudes in Area 1 were significantly different between Group A and B (P<0.05), but no significant difference of P1 amplitudes in Area 2 between Group A and B (P>0.05). There were no significant difference of all data between Group A and control in Area 1 and 2 (P>0.05) The implicit times of N1, P1 were not significantly different between Group A and B.
Go to : 
References
1. Burton TC. Recovery of visual acuity after retinal detachments involving the macula. Trans Am Ophthalmol Soc. 1982; 80:475–97.
2. Berson EL. Electrical phenomena in the retina. In: Hart WM. Adler's Physiology of the Eye. 9th ed.St, Louis: Mosby Year Book;1992. chap. 21.
3. Sutter EE, Tran D. The field topography of ERG components in man-1. The photopic luminance response. Vision Res. 1992; 32:433–46.
4. Min WK. Clinical electroretinography in the retinal detachment. J Korean Ophthalmol Soc. 1983; 24:157–64.
5. Kim IT, Ha SM, Yoon KC. Electroretinographic studies in rhegmatogenous retinal detachment before and after reattachment surgery. Korean J Ophthalmol. 2001; 15:118–27.

6. Kim SD, Maruiwa F, Nao-I N, Sawada A. Focal ERG changes during experimental retinal detachment and spontaneous reattachment in the rabbit. J Korean Ophthalmol Soc. 1992; 33:698–703.
7. Anderson DH, Stern WH, Fisher SK, et al. Retinal detachment in the cat: the pigment epithelial-photoreceptor interface. Invest Ophthalmol Vis Sci. 1983; 24:906–26.
8. Anderson DH, Stern WH, Fisher SK, et al. The onset of pigment epithelial proliferation after retinal detachment. Invest Ophthalmol Vis Sci. 1981; 21:10–6.
9. Anderson DH, Guerin CJ, Erickson PA, et al. Morphological recovery in the reattached retina. Invest Ophthalmol Vis Sci. 1986; 27:168–83.

10. Kroll AJ, Machemer R. Experimental retinal detachment in the owl monkey. III. Electron microscopy of retina and pigment epithelium. Am J Ophthalmol. 1968; 66:410–27.
11. Cunha-Vaz JG, Fonseca JR, Vieira R. Retinal blood flow in retinal detachment. Mod Probl Ophthalmol. 1979; 20:89–91.
12. Tagawa H, Feke GT, Goger DG, et al. Retinal blood flow changes in eyes with rhegmatogenous retinal detachments and scleral buckling procedures. Nippon Ganka Gakkai Zasshi. 1992; 96:259–64.
13. Lewis GP, Charteris DG, Sethi CS, et al. The ability of rapid retinal reattachment to stop or reverse the cellular and molecular events initiated by detachment. Invest Ophthalmol Vis Sci. 2002; 43:2412–20.
14. Lewis GP, Sethi CS, Linberg KA, et al. Experimental retinal reattachment: a new perspective. Mol Neurobiol. 2003; 28:159–75.

15. Kretschmann U, Bock M, Gockeln R, Zrenner E. Clinical applications of multifocal electroretinography. Doc Ophthalmol. 2000; 100:99–113.
16. Schatz P, Holm K, Andreasson S. Retinal function after scleral buckling for recent onset rhegmatogenous retinal detachment: assessment with electroretinography and optical coherence tomography. Retina. 2007; 27:30–6.
17. Wu D, Gao R, Zhang G, Wu L. Comparison of pre- and post-operational multifocal electroretinograms of retinal detachment. Chin Med J. 2002; 115:1560–3.
18. Moschos M, Mallias J, Ladas I, et al. Multifocal ERG in retinal detachment surgery. Eur J Ophthalmol. 2001; 11:296–300.
19. Davies EW. Factors affecting recovery of visual acuity following detachment of the retina. Trans Ophthalmol Soc U K. 1972; 92:335–44.
20. Gundry MF, Davies EW. Recovery of visual acuity after retinal detachment surgery. Am J Ophthalmol. 1974; 77:310–4.

21. Kreissig I. Prognosis of return of macular function after retinal reattachment. Mod Probl Ophthalmol. 1977; 18:415–29.
22. Grupposo SS. Visual acuity following surgery for retinal detachment. Arch Ophthalmol. 1975; 93:327–30.

23. Ross WH, Kozy DW. Visual recovery in macula-off rhegmatogenous retinal detachments. Ophthalmology. 1998; 105:2149–53.

24. Lee YD, Bae SR. Normal values of positive wave in the multifocal electroretinography in Korean. J Korean Ophthalmol Soc. 2000; 44:850–6.
Go to : 
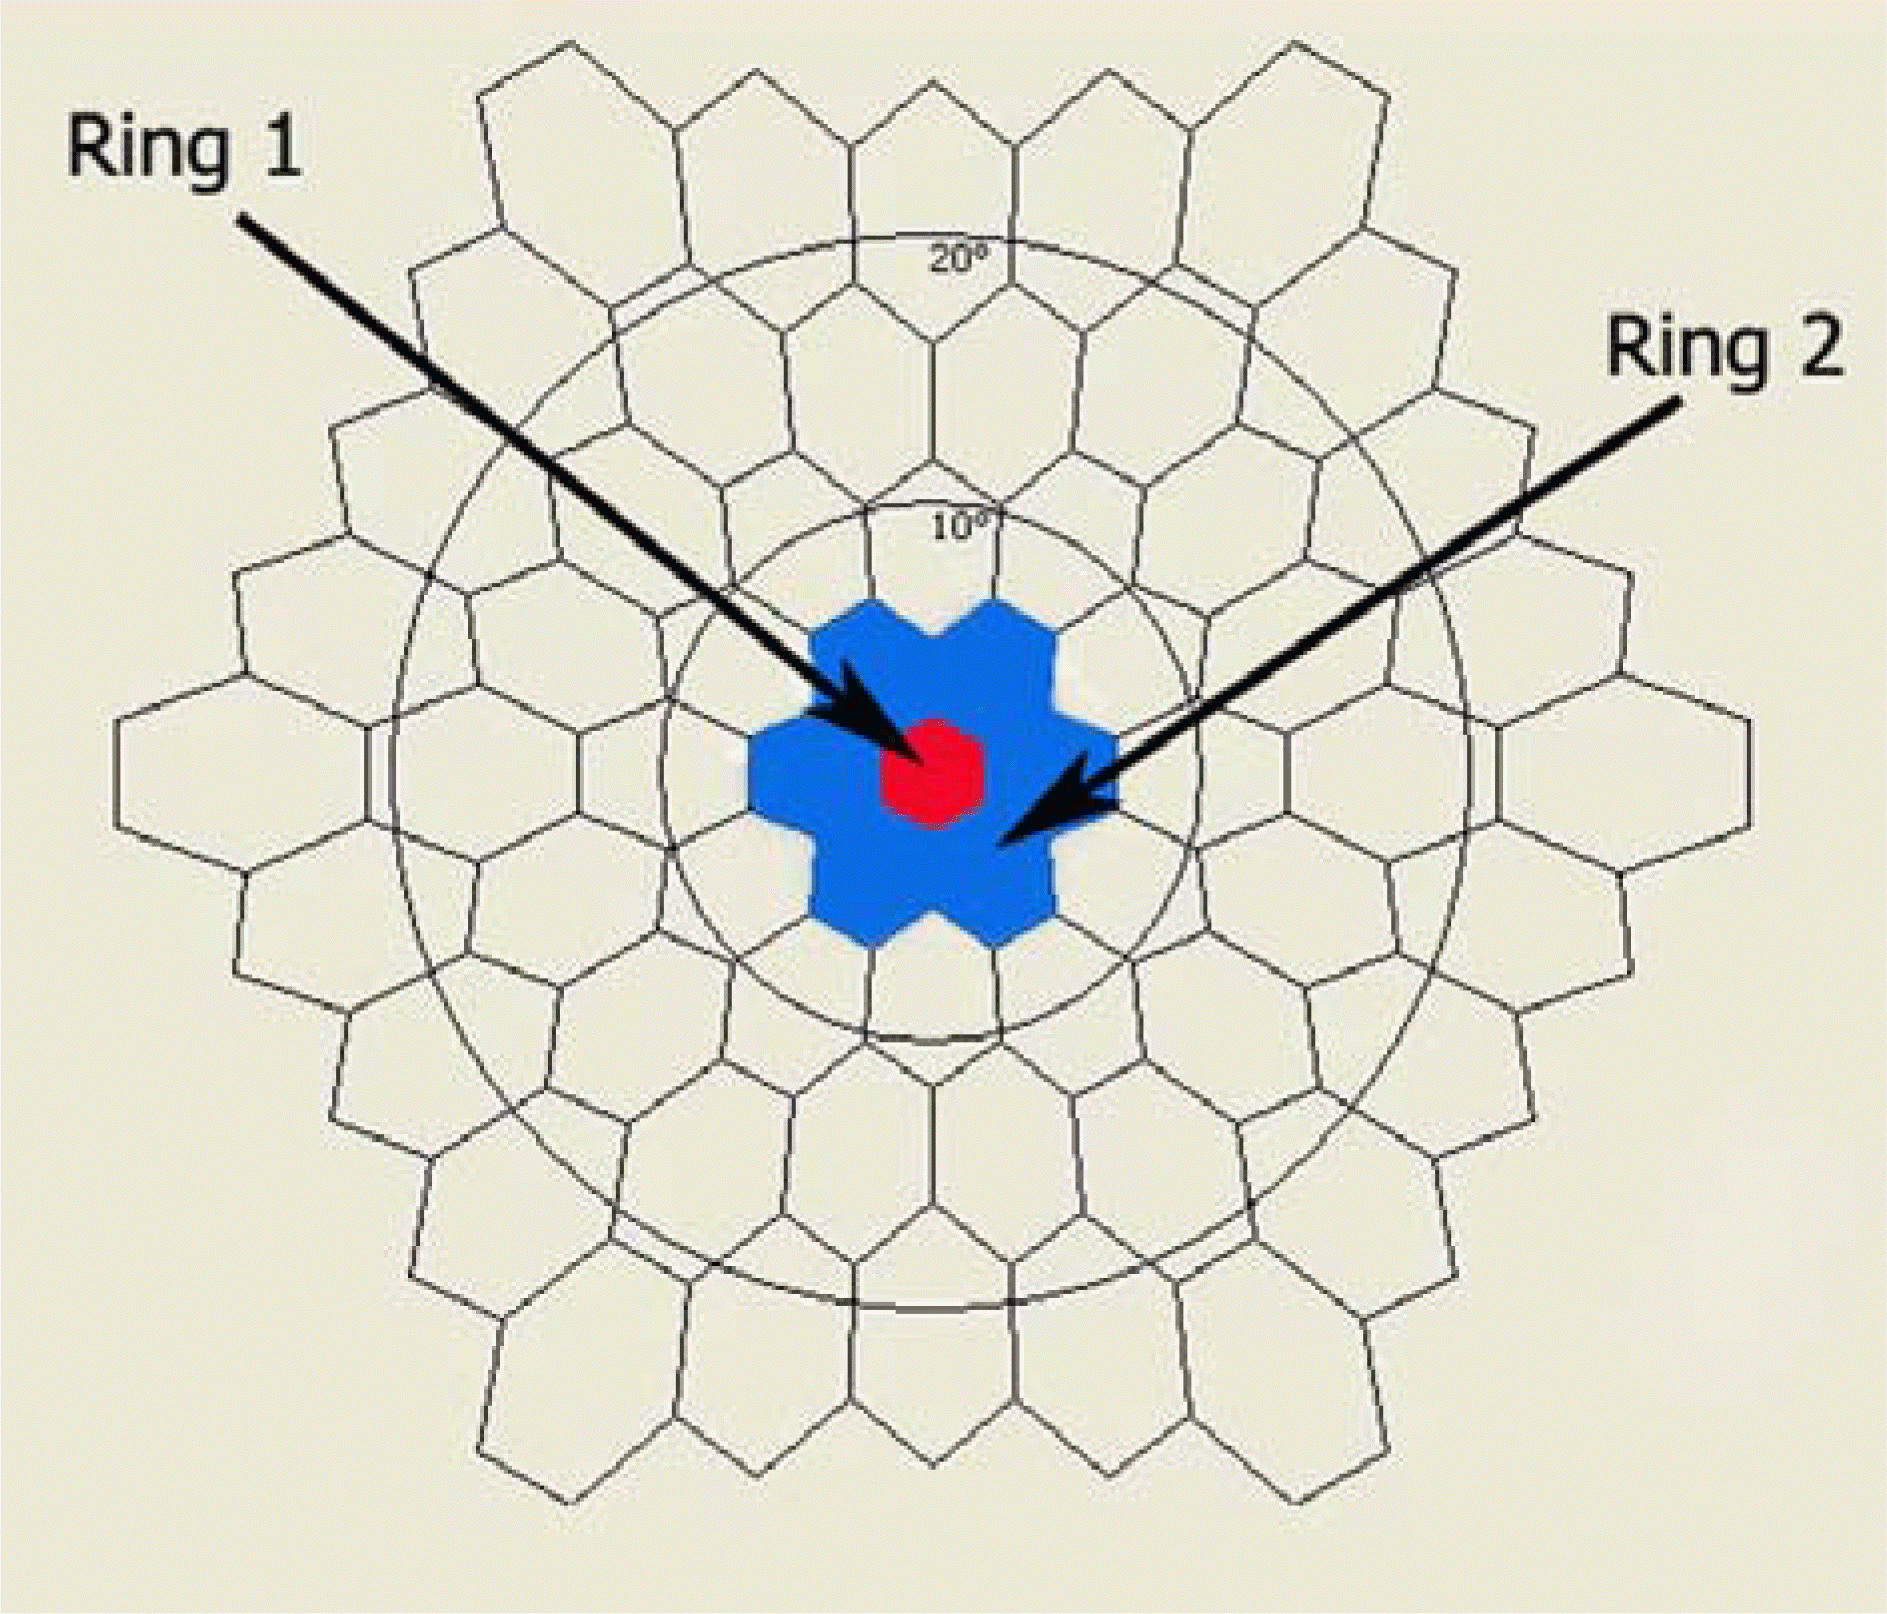
 | Figure 1.Stimulus array of 61 hexagonal elements; ring 1 (red) and ring 2 (blue) correspond to fovea and parafovea, respectively. |
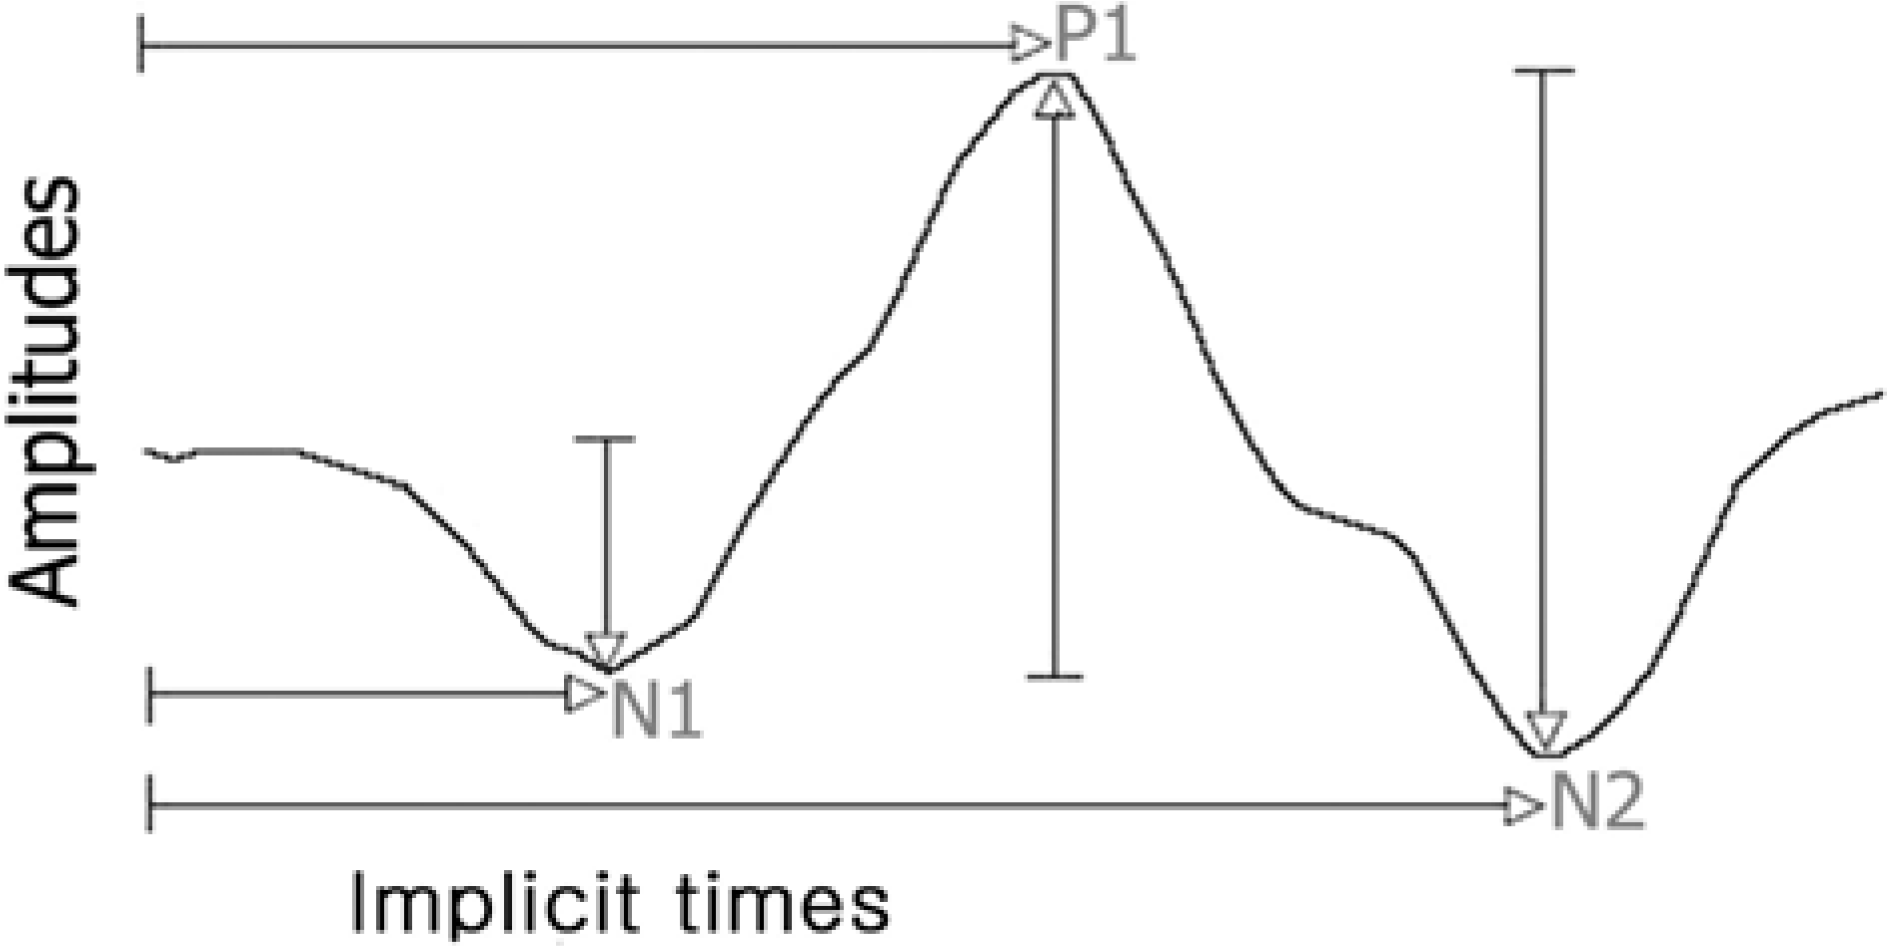
 | Figure 2.The typical waveform of the primary multifocal ERG response is a biphasic wave with initial negative deflection followed by a positive peak. There may be a second negative deflection after the peak. The preferred designation is to label these three peaks respectively N1, P1, and N2. |
 | Figure 3.Comparison of P1 amplitudes of Group A, B, and control. The box-and-whiskers plots include the 25 th, 50 th, and 75 th percentiles. The whiskers define the minimum and maximum values. Figure 3A and 3B show data in Area 1 and 2, respectively. |
 | Figure 4.Comparison of N1 amplitudes of Group A, B, and control. The box-and-whiskers plots include the 25 th, 50 th, and 75 th percentiles. Except for outliers, the whiskers define the minimum and maximum values. Figure 4A and 4B show data in Area 1 and 2, respectively. |
Table 1.
Comparisons of clinical data of two groups
| Features | Group A | Group B | p-value |
|---|---|---|---|
| Number of eyes | 9 | 10 | |
| Age (years, mean±SD) | 40.2±14.0 | 55.6±19.6 | 0.065* |
| Sex (Male/Female) | 5/4 | 7/3 | 0.650† |
| Duration of macular detachment | 4.0±1.8 | 21.5±7.1 | <0.001* |
| Method of reattachment | |||
| SB | 5 | 6 | 1.000† |
| PR | 4 | 4 | |
| Refractive error | −4.1±1.9 | −3.0±1.8 | 0.182* |
| BCVA | |||
| Preoperative | |||
| < 0.1 | 5 | 6 | |
| 0.1∼0.2 | 4 | 4 | |
| Postoperative | 0.73±0.1 | 0.50±0.1 | 0.004* |
| Extent of detachment | |||
| < 1Q | 0 | 0 | |
| 1Q∼3Q | 8 | 8 | |
| > 3Q | 1 | 2 |
Table 2.
Amplitudes and implicit times of Groups A and B
| Parameters | Group A | Group B | p-value | |
|---|---|---|---|---|
| Area 1 | Amplitude (nV/deg2)* | |||
| N1 | 51.50±10.52 | 35.63±11.33 | 0.010‡ | |
| P1 | 164.23±12.57 | 98.84±21.45 | <0.001‡ | |
| Implicit time (ms)† | ||||
| N1 | 19.02±3.21 | 20.38±3.00 | 0.661 | |
| P1 | 40.64±3.44 | 42.53±3.37 | 0.400 | |
|
|
||||
| Area 2 | Amplitude (nV/deg2)* | |||
| N1 | 32.07±9.59 | 23.88±9.04 | 0.053 | |
| P1 | 95.03±9.10 | 65.71±17.69 | 0.001‡ | |
| Implicit time (ms)† | ||||
| N1 | 20.11±2.11 | 22.75±3.19 | 0.053 | |
| P1 | 41.35±2.77 | 41.74±3.28 | 0.905 | |
Table 3.
Amplitudes and implicit times of Group A and control group
| Parameters | Group A | Control | p-value‡ | |
|---|---|---|---|---|
| Area 1 | Amplitude (nV/deg2)* | |||
| N1 | 51.50±10.52 | 59.82±17.04 | 0.498 | |
| P1 | 164.23±12.57 | 173.06±17.83 | 0.172 | |
| Implicit time (ms)† | ||||
| N1 | 19.02±3.21 | 20.24±2.50 | 0.332 | |
| P1 | 40.64±3.44 | 40.17±2.55 | 0.699 | |
|
|
||||
| Area 2 | Amplitude (nV/deg2)* | |||
| N1 | 32.07±9.59 | 41.50±9.17 | 0.054 | |
| P1 | 95.03±9.10 | 103.57±10.72 | 0.068 | |
| Implicit time (ms)† | ||||
| N1 | 20.11±2.11 | 20.27±1.56 | 0.699 | |
| P1 | 41.35±2.77 | 39.37±1.89 | 0.095 | |


 PDF
PDF ePub
ePub Citation
 Print
Print


 XML Download