

 PDF
PDF ePub
ePub Citation
 Print
Print


Abstract
Purpose
To evaluate the efficacy of intravitreal tissue plasminogen activator (tPA) with C3 F8 injection for branch retinal vein occlusion (BRVO) involving fovea.
Methods
Seven patients (7 eyes) presenting with subfoveal hemorrhage caused by BRVO were treated with an intravitreal tPA and C3 F8 injection. We assessed the visual acuity (VA) and foveal thickness measured with optical coherence tomography.
Results
The mean duration of symptoms before surgery was 5.42±1.90 weeks. The mean logMAR VA improved from 1.14±0.19 at baseline to 0.87±0.34 at one week and 0.30±0.32 at six months. The mean foveal thickness decreased from 564.421±186.88 µm at baseline to 483.14±275.06 μ m at one week and 353.28±152.99 μ m at six months. There was no adverse effect related to the treatment.
Go to : 
References
1. Frangieh GT, Green WR, Barraquer-Somers E, Finkelstein D. Histopathologic study of nine branch retinal vein occlusions. Arch Ophthalmol. 1982; 100:1132–40.

2. Cahill MT, Fekrat S. Arteriovenous sheathotomy for branch retinal vein occlusion. Ophthalmol Clin North Am. 2002; 15:417–23.
3. Mitchell P, Smith W, Chang A. Prevalence and associations of retinal vein occlusion in Australia Blue Mountains Eye Study. Arch Ophthalmol. 1996; 114:1243–7.
4. The Branch Vein Occlusion Study Group. Argon laser photocoagulation for macular edema in branch vein occlusion. Am J Ophthalmol. 1984; 98:271–82.
5. Greer DV, Constable IJ, Cooper RL. Macular edema and retinal branch vein occlusion. Aust J Ophthalmol. 1980; 8:207–9.
6. Kohner EM, Pettit JE, Hamilton AM. Streptokinase in central retinal vein occlusion:a controlled clinical trial. Br Med J. 1976; 6:550–3.
7. Hattenbach LO, Steinkamp G, Scharrer I, Ohrloff C. Fibrinolytic therapy with low dose recombinant tissue plasminogen activator in retinal vein occlusion. Ophthalmologica. 1998; 212:394–8.
8. Lahey JM, Fong DS, Kearney J. Intravitreal tissue plasminogen activator for acute central retinal vein occlusion. Ophthalmic Surg Lasers. 1999; 30:427–34.
9. Glancerbernard A, kuhn D, Vine AK, et al. Treatment of recent onset central retinal vein occlusion with intravitreal tissue plasminogen activator: a pilot study. Br J Ophthalmol. 2000; 84:609–13.
10. Elman MJ, Raden RZ, Carrigan A. Intravitreal injection of tissue plasminogen activator for central retinal vein occlusion. Trans Am Ophthalmol Soc. 2001; 99:219–21.
11. Tomoaki M, Hitoshi T, Mihori K, et al. Intravitreal tissue plasminogen activator to treat macular edema associated With branch retinal vein occlusion. Am J Ophthalmol. 2006; 142:318–20.
12. Kim HC, Kwon SI, Kim HK. The effect of intravitreal injection of tPA and C3 F8 in submacular hemorrhage. J Korean Ophthalmol Soc. 2000; 40:400–9.
13. Tomoaki M, Akitaka T, Masafumi O, et al. Photoreceptor status after resolved macular edema in branch retinal vein occlusion treated with tissue plasminogen activator. Am J Ophthalmol. 2007; 143:171–3.
14. Nicola G, Baha N, Randa S, et al. Intravitreal tissue plasminogen activator in the management of central retinal vein occlusion. Retina. 2003; 23:780–4.
15. Mahmoud TH, Peng YW, Proia A, et al. Intravitreal tissue plasminogen activator penetrates the retinal vessels in a porcine model of vascular occlusion. Invest Ophthalmol Vis Sci. 2002; 43:353.
16. Gandorfer A. Pharmacologic vitreolysis. Dev Ophthalmol. 2007; 39:149–56.
17. Hermel M, Schrage NF. Efficacy of plasmin enzymes and chondroitinase ABC in creating posterior vitreous separation in the pig: a masked, placebo-controlled in vivo study. Graefes Arch Clin Exp Ophthalmol. 2007; 245:399–406.
18. Li X, Shi X, Fan J. Posterior vitreous detachment with plasmin in the isolated human eye. Graefes Arch Clin Exp Ophthalmol. 2002; 240:56–62.
19. Ohji M, Saito Y, Hayashi A, et al. Pneumatic displacement of subretinal hemorrhage without tissue plasminogen activator. Arch Ophthalmol. 1998; 116:1326–32.
20. Gopalakrishan M, Giridhar A, Bhat S, et al. Pneumatic displacement of submacular hemorrhage: safety, efficacy, and patient selection. Retina. 2007; 27:329–34.
Go to :
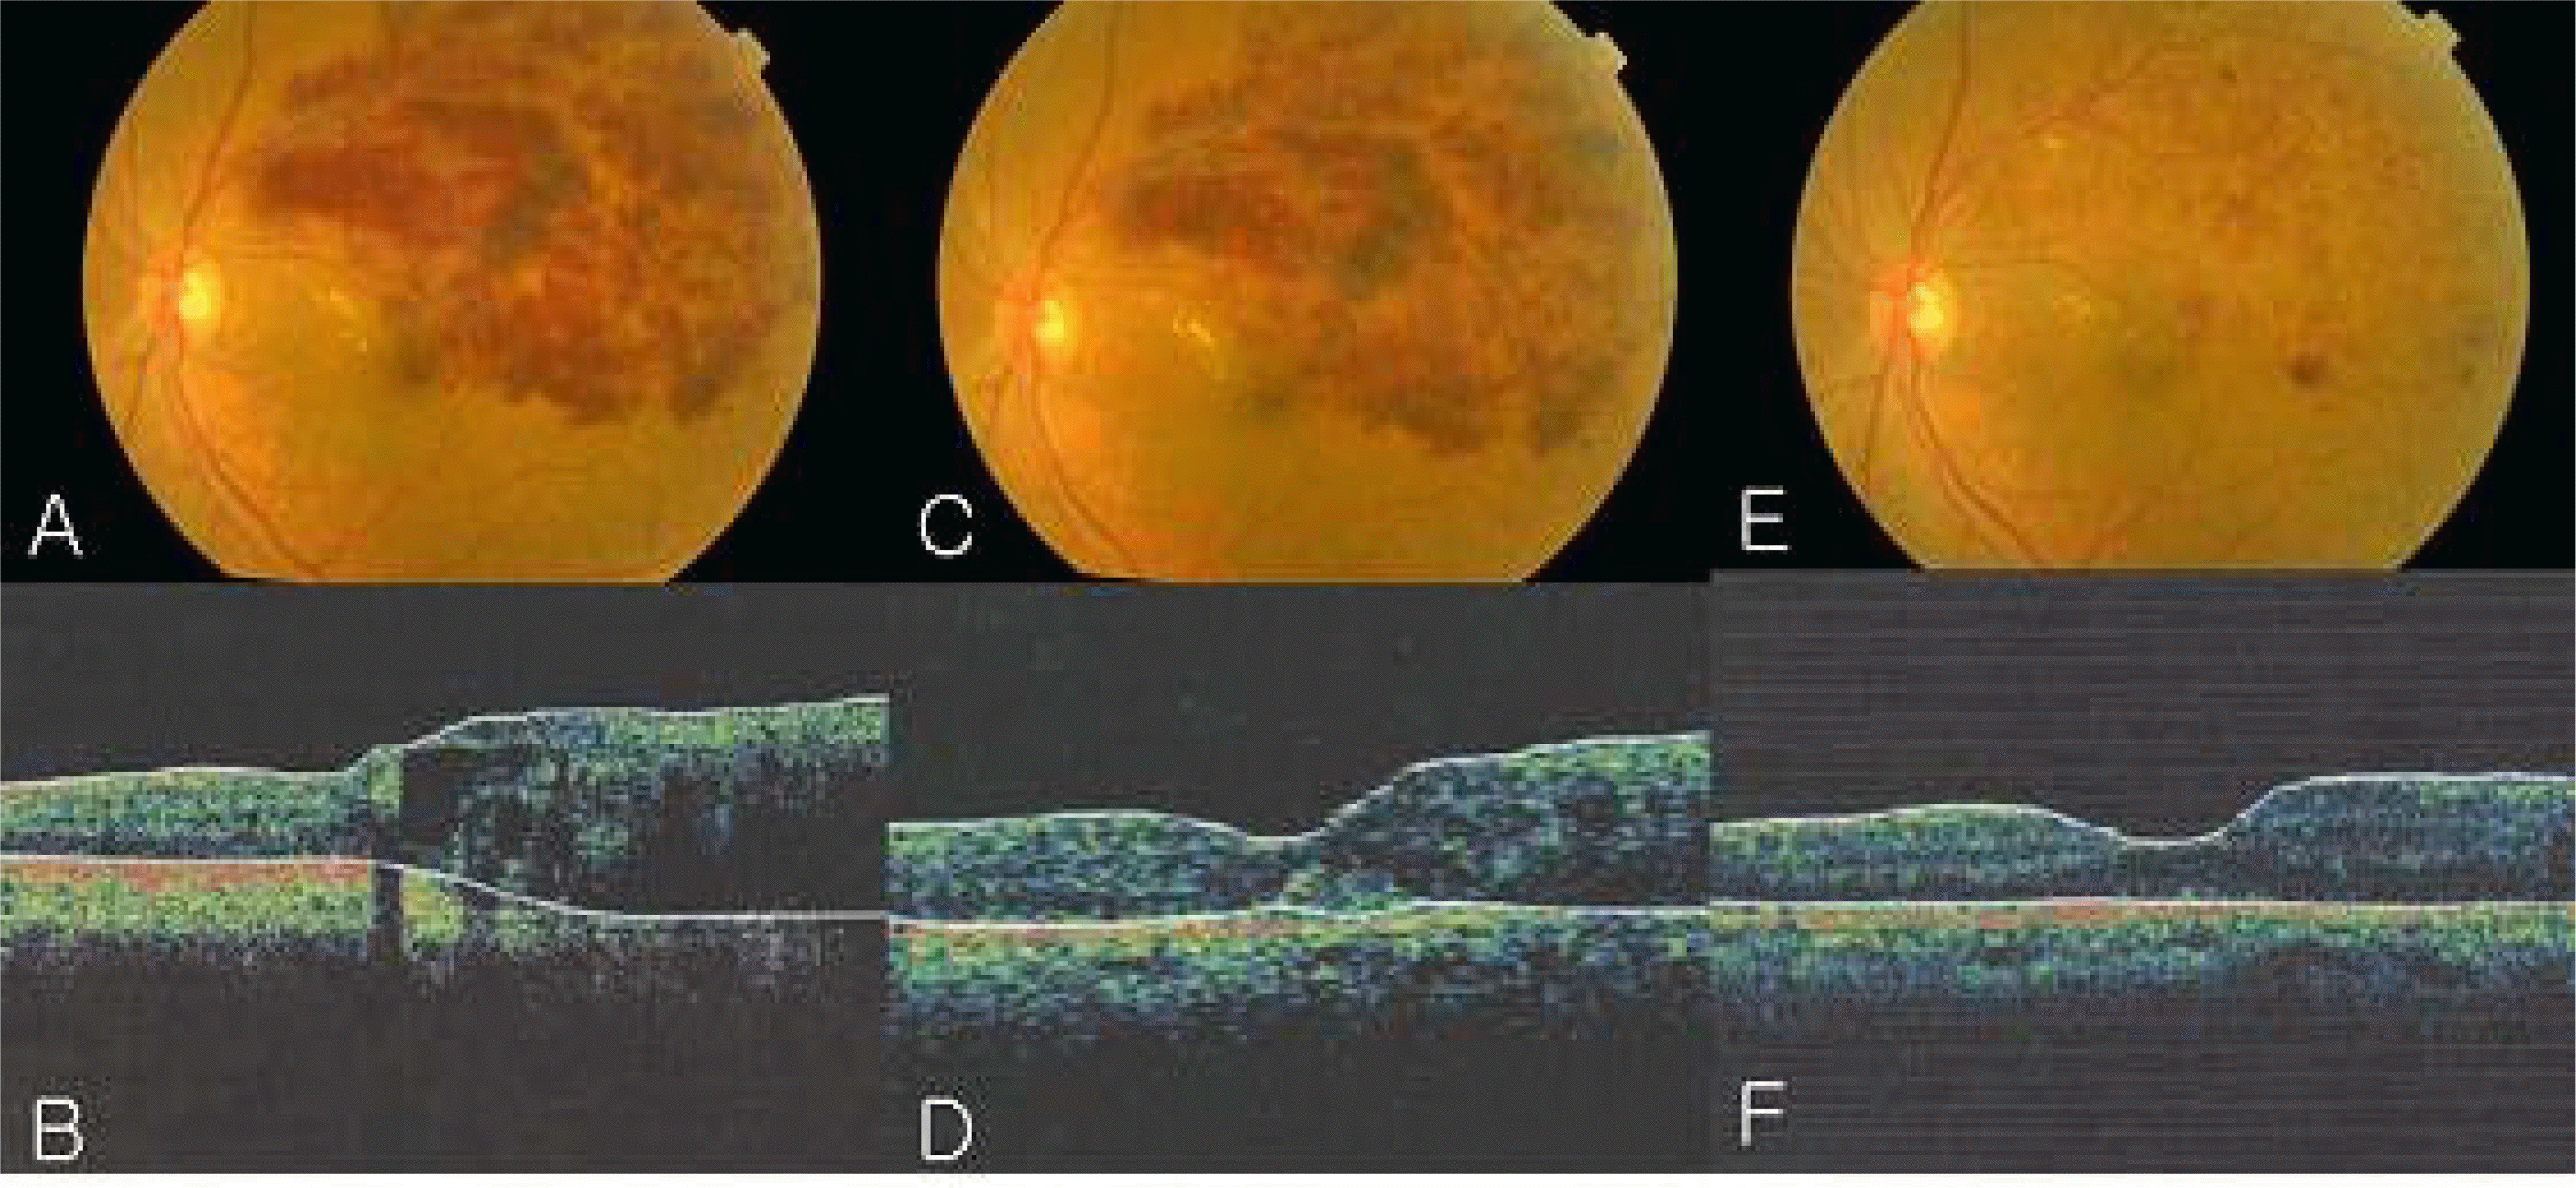 | Figure 1.The left eye of a 66-year-old woman (patient 4) was treated with an intravitreal tPA and C3 F8 injection after 4 weeks of visual symptom. (A) Pretreatment fundus photograph. The fovea was affected by edema and hemorrhage. Visual acuity was 0.06. (B) Pretreatment OCT showed macular edema with foveal thickness of 372 µm. (C) Fundus photograph of 1 month after treatment. Visual acuity improved to 0.2. (D) OCT of 1 month after treatment shows decreased macular edema. Foveal thickness was 316 µm. (E) Fundus photograph of 6 months after treatment showed that the intraretinal hemorrhage was almost absorbed and the macular edema resolved. visual acuity improved to 0.3. (F) OCT showed that retinal thickness is markedly reduced with foveal thickness of 214 µm. |
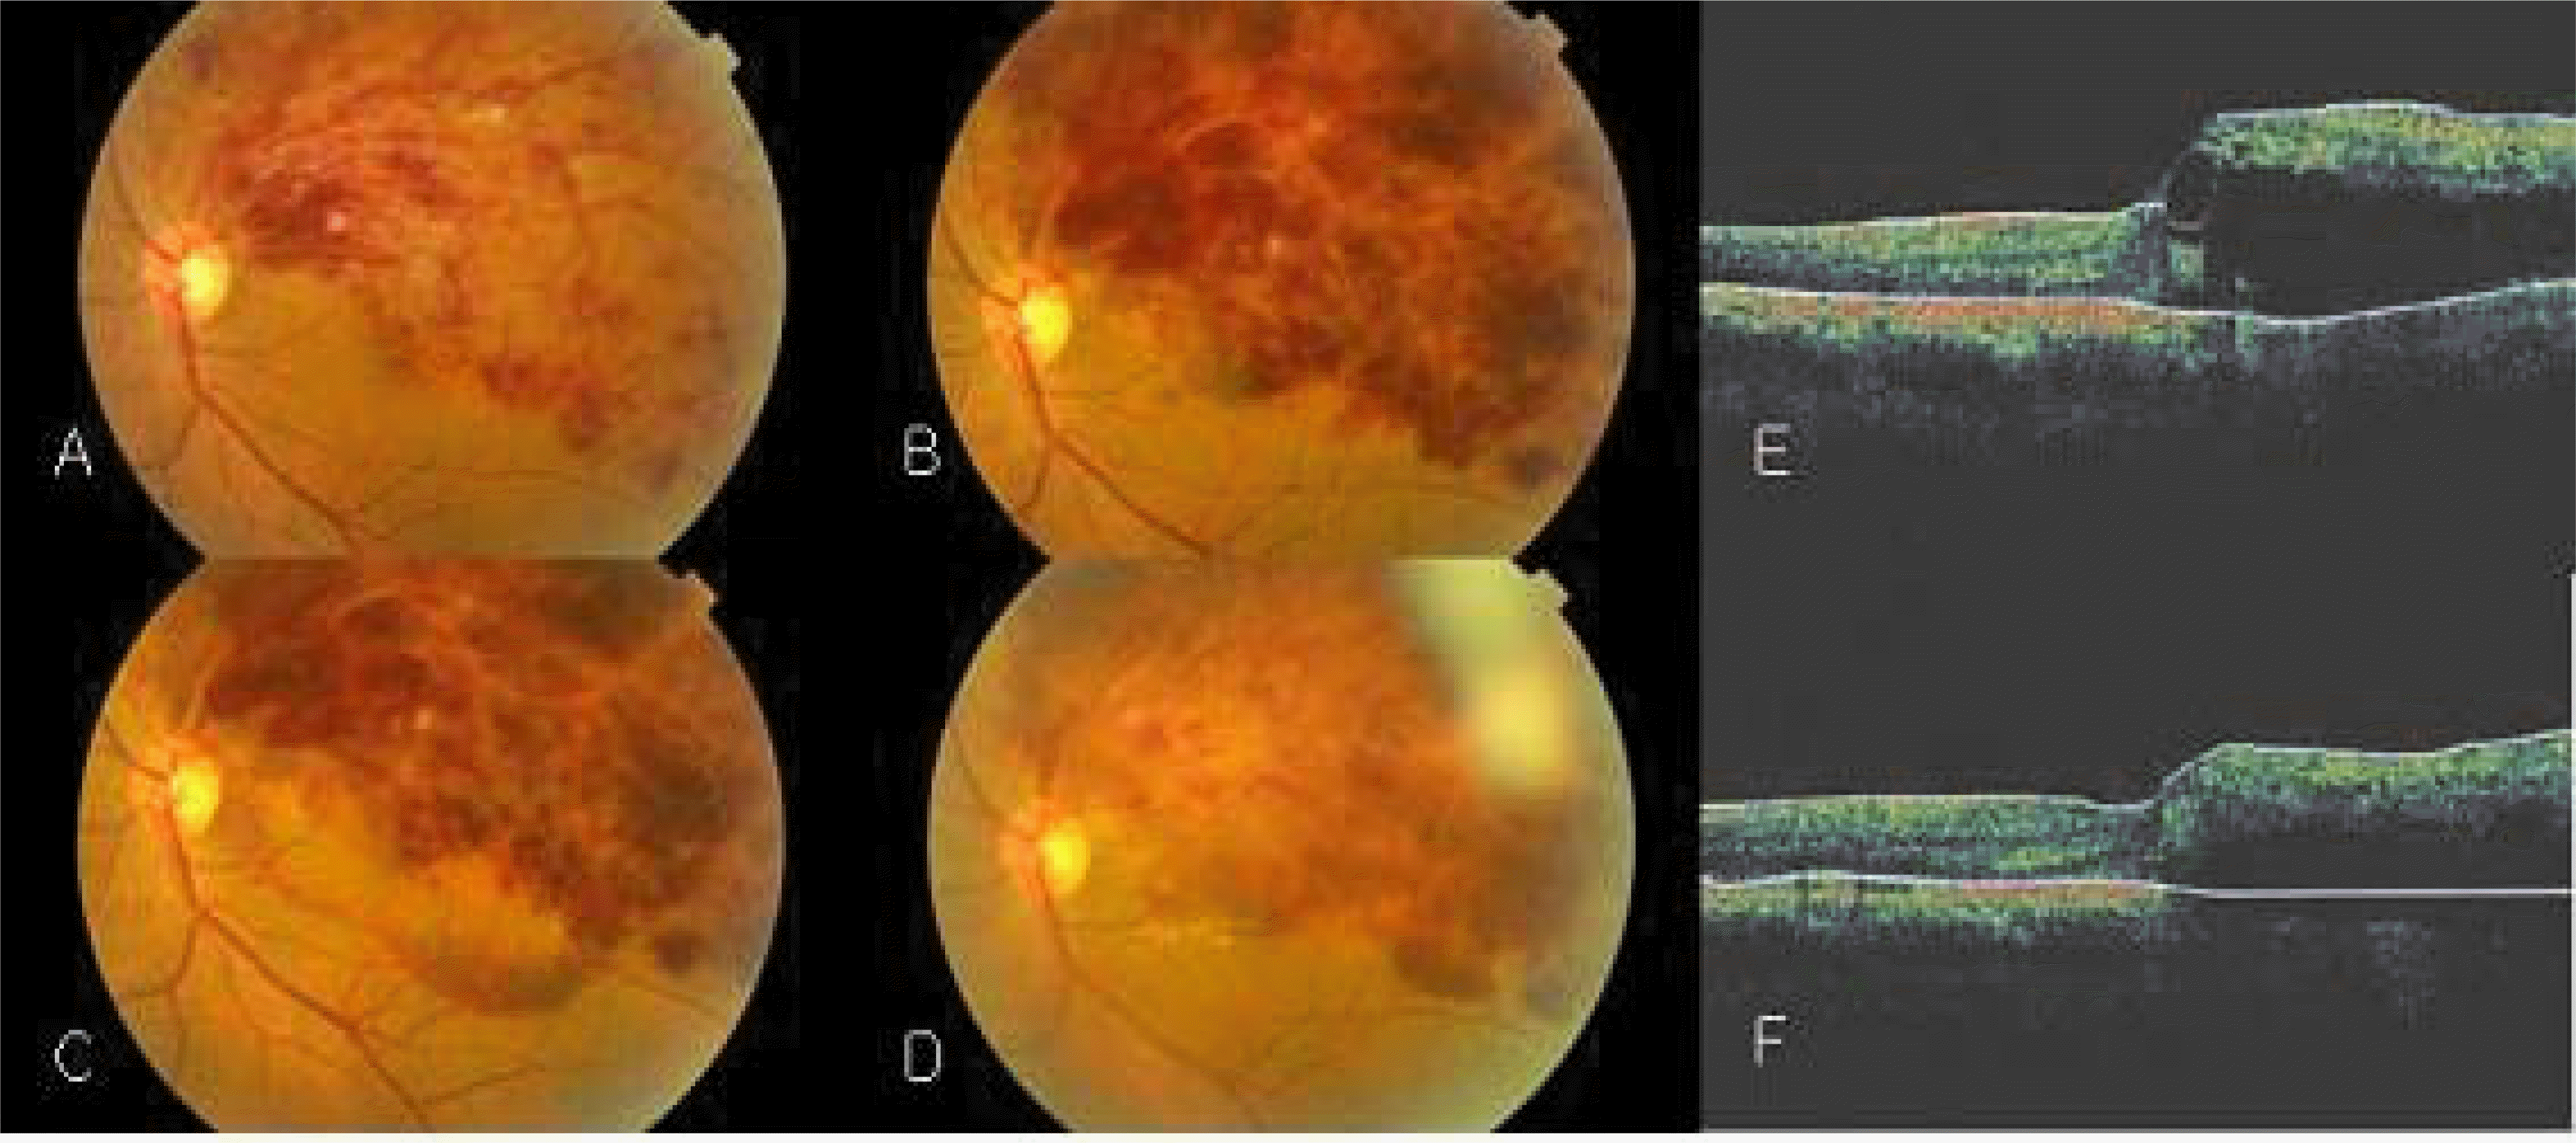 | Figure 2.The left eye of a 56-year-old man (patient 2) with sudden decrease in vision of 7 days duration. (A) Initial fundus photograph with superotemporal branch vein occlusion. Visual acuity was 0.15. (B) Pretreatment fundus photograph with increasing intraretinal hemorrhage. visual acuity was 0.15. (C) Fundus photograph 1 day after intravitreal tPA and C3 F8 injection. macular hemorrhage was displaced. (D) Fundus photograph 6 months after treatment. The macular area was still affected by remaining retinal hemorrhage. Visual acuity was 0.1. (E) Pretreatment OCT showed cystic space at the fovea and the sensory retina is thickened with foveal thickness of 422 µm. (F) OCT 6 months after treatment showed stationary macular edema. Foveal thickness was 443 µm. |
Table 1.
Clinical characteristics of patients
| Patient | Age (yrs) | Sex | Eye | HTN* | Duration of symptom (days) | Duration of symptom To treatment (weeks) | Involved branch | F/U Period (months) |
|---|---|---|---|---|---|---|---|---|
| 1 | 36 | M | R | + | 5 | 4 | IT† | 6 |
| 2 | 56 | M | L | + | 7 | 4 | ST‡ | 8 |
| 3 | 44 | F | R | + | 10 | 4 | IT | 8 |
| 4 | 66 | F | L | + | 14 | 4 | IT | 7 |
| 5 | 43 | M | R | − | 7 | 6 | ST | 8 |
| 6 | 73 | F | L | + | 7 | 8 | IT | 7 |
| 7 | 63 | F | R | − | 14 | 8 | ST | 6 |
Table 2.
Distribution of visual acuity and foveal thickness
| Patient |
Initial VA* |
Pre treatment VA |
Post-treatment VA |
Pre treatment FT† |
Post-treatment FT | ||||||
|---|---|---|---|---|---|---|---|---|---|---|---|
| 1W | 1M | 3M | 6M | 1W | 1M | 3M | 6M | ||||
| 1 | 1.0 | 0.05 | 0.4 | 0.2 | 0.5 | 0.2 | 761 | 346 | 499 | 309 | 226 |
| 2 | 0.15 | 0.15 | 0.2 | 0.15 | 0.1 | 0.1 | 422 | 330 | 468 | 443 | 443 |
| 3 | 0.1 | 0.05 | 0.05 | 0.1 | 0.1 | 0.3 | 450 | 311 | 335 | 275 | 212 |
| 4 | 0.2 | 0.06 | 0.2 | 0.2 | 0.3 | 0.3 | 372 | 287 | 316 | 220 | 214 |
| 5 | 0.7 | 0.05 | 0.05 | 0.1 | 0.1 | 0.1 | 713 | 510 | 499 | 375 | 344 |
| 6 | 0.3 | 0.08 | 0.2 | 0.1 | 0.1 | 0.1 | 421 | 287 | 458 | 416 | 180 |
| 7 | 0.2 | 0.1 | 0.1 | 0.1 | 0.1 | 0.1 | 805 | 567 | 503 | 493 | 554 |
Table 3.
Outcome of visual acuity and foveal thickness
| Pretreatment | 1 Week | 1 Month | 3 Months | 6 Months | |
|---|---|---|---|---|---|
| Visual acuity (LogMAR) | 1.14±0.19 | 0.87±0.34 | 0.88±0.15 | 0.82±0.29 | 0.3±0.32 |
| P-value* | 0.000 | 0.001 | 0.001 | 0.000 | |
| Foveal thickness (µm) | 564.42±186.88 | 483.14±275.06 | 439.72±80.04 | 361.57±97.76 | 353.28±152.99 |
| P-value | 0.001 | 0.004 | 0.001 | 0.001 | |
| Improvement (2 or more line) | 3/7 (42.9%) | 2/7 (28.6%) | 2/7 (28.6%) | 3/7 (42.9%) |
 XML Download