Abstract
Purpose
To analyze the correlation between RNFL thickness changes measured by OCT and hemifield pattern VEP in hemianopic visual field loss.
Methods
Twelve eyes of six patients with hemianopia were studied. Two patients had bitemporal hemianopia caused by chiasmal tumor, one patient had inferior hemianopia caused by traumatic optic neuropathy, and three patients had homonymous hemianopia caused by occipital lobe lesions. The retinal nerve fiber layer thickness around the optic disc was measured by optical coherence tomography (OCT) and visual pattern evoked potentials were measured using hemifield stimulations.
Results
Normal eyes of traumatic optic neuropathy patients were excluded from the analysis. The retinal nerve fiber layer thickness as measured by OCT corresponded to the visual field defect in 9 of 11 eyes (81.8%) and the hemifield pattern VEP response corresponded to visual field defect in 7 of 11 eyes (63.6%).
References
2. Schuman JS, Hee MR, Arya AV, et al. Optical coherence tomography : a new tool for glaucoma diagnosis. Curr Opin Ophthalmol. 1995; 6:89–95.
3. Schuman JS, Pedut-Kloizman T, Hertzmark E, et al. Reprodu- cibility of nerve fiber layer thickness measurements using optical coherence tomography. Ophthalmology. 1996; 103:1889–98.
4. Blumenthal EZ, Williams JM, Weinreb RN, et al. Reproducibility of nerve fiber layer thickness measurements by use of optical coherence tomography. Ophthalmology. 2000; 2278–82.
5. Carpineto P, Ciancaglini M, Zuppardi E, et al. Reliability of nerve fiber layer thickenss measurements using optical coherence tomography in normal and glaucomatous eyes. Ophthalmology. 2003; 110:190–5.
6. Kanamori A, Nakamura M, Escano MF, et al. Evaluation of the glaucomatous damage on retinal nerve fiber layer thickness measured by optical coherence tomography. Am J Ophthalmol. 2003; 135:513–20.

7. Bowd C, Weinreb RN, Williams JM, Zangwill LM. The retinal nerve fiber layer thickness in ocular hypertensive, normal, and glaucomatous eyes with optical coherence tomography. Arch Ophthalmol. 2000; 118:22–6.

8. Soliman MA, Van Den Berg TJ, Ismaeil AA, et al. Retinal nerve fiber layer analysis: relationship between optical coherence tomography and red-free photography. Am J Ophthalmol. 2002; 133:187–95.

9. Zangwill LM, Williams J, Berry CC, et al. A comparison of optical coherence tomography and retinal nerve fiber layer photography for detection of nerve fiber layer damage in glaucoma. Ophthalmology. 2000; 107:1309–15.

10. Kanamori A, Nakamura M, Matsui N, et al. Optical coherence tomography detects characteristic retinal nerve fibre layer thickness corresponding to band atrophy of the optic discs. Ophthalmology. 2004; 111:2278–83.
11. Mehta JS, Plant GT. Optical coherence tomography (OCT) findings in congenital/longstanding homonymous hemianopia. Am J Ophthalmol. 2005; 140:727–9.

12. Monteiro ML, Leal BC, Rosa AA, Bronstein MD. Optical coherence tomography analysis of axonal loss in band atrophy of the optic nerve. Br J Ophthalmol. 2004; 88:896–9.

13. Moteiro ML, Moura FC, Medeiros FA. Diagnostic ability of optical coherence tomography with a normative database to detect band atrophy of the optic nerve. Am J Ophthalmol. 2007; 143:896–9.
14. American Clinial Neurophysiology Society. Guideline 9B: Guidelines on Visual Evoked Potentials. J Clin Neurophysiol. 2006; 23:138–56.
15. Miller NR, Newman NJ. Walsh and Hoyt’s Clinical Neuro- ophthalmology, 5th ed. Vol. 1. Baltimore: Williams & Wilkins;1998; 307–22.
16. Hoyt WF, Luis O. The primate chiasm. Details of visual fiber organization studied by silver impregnation techniques. Arch Ophthalmol. 1963; 70:69–85.

17. Miller NR, Newman NJ. Walsh and Hoyt’s Clinical Neuro- ophthalmology, 5th ed. Vol. 1. Baltimore: Williams & Wilkins;1998; 50–3.
18. Brecelj J. A VEP study of the visual pathway function in compressive lesions of the optic chiasm. Full-field versus half-field stimulation. Electroencephalogra Clin Neurophysiol. 1992; 84:209–18.
19. Flanagan JG, Harding GF. Multi-channel visual evoked potentials in early compressive lesions of the chiasm. Doc Ophthalmol. 1988; 69:271–81.

20. Bumgartner J, Epstein CM. Voluntary alteration of visual evoked potentials. Ann Neurol. 1982; 12:475–8.

21. Morgan RK, Nugent B, Harrison JM, O’Connor PS. Voluntary alternation of pattern visual evoked responses. Ophthalmology. 1985; 92:1356–63.
Figure 2.
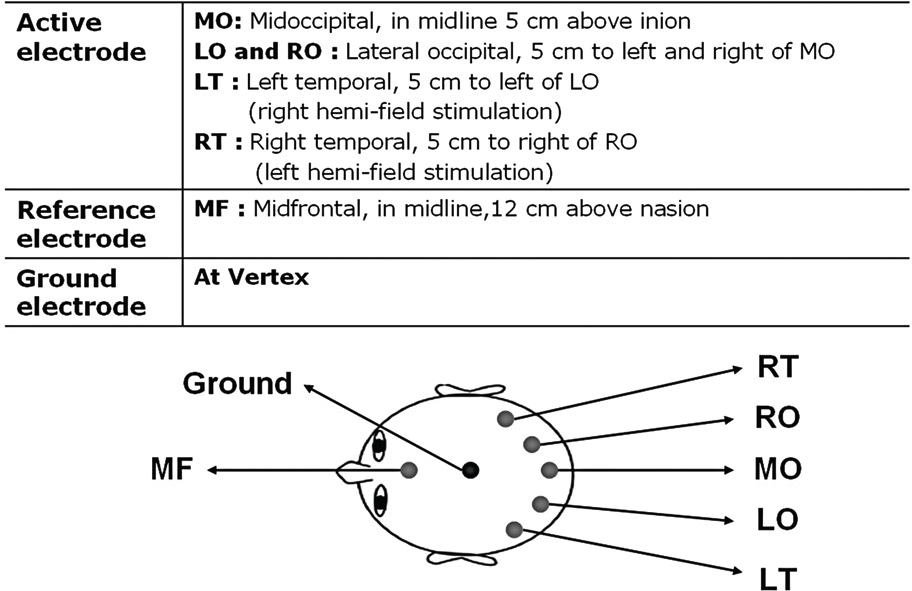
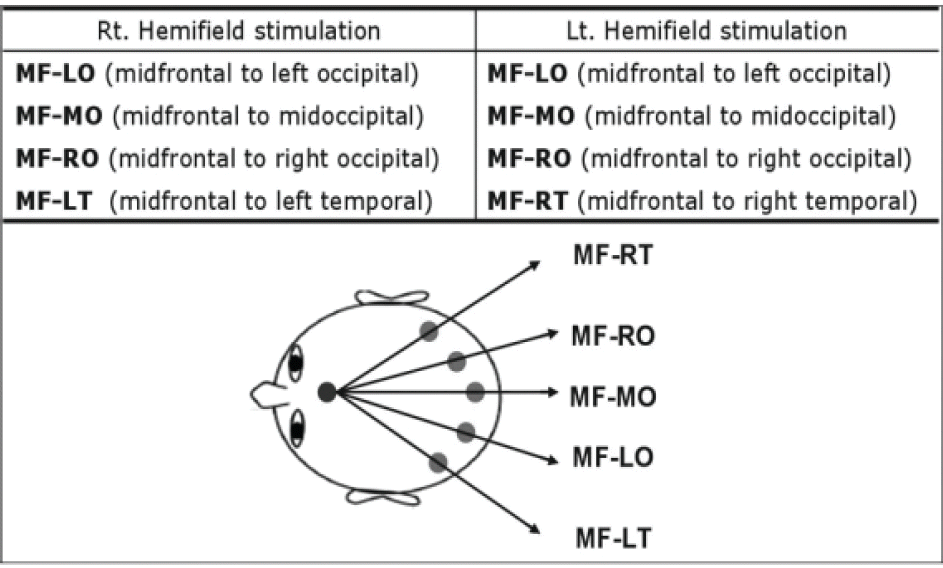
Examination technique of hemifield pattern visual evoked potentials. (A, B, C)=electrode (D, E)=hemifield stimulation.

Figure 4.
Brain MRI of a 25-year-old woman who had bitemporal hemianopia (Case 1). (A) 3.5×3.8×2.3 cm-sized lesion with enhancement was identified in suprasellar area (blue arrows). (A) axial scan (B) coronal scan.

Figure 5.
Case 1. Visual field by Humphrey perimetry (A, B) shows bitemporal hemianopia. Retinal nerve fiber layer thickness measured by optical coherence tomography shows thinning in mainly temporal and nasal areas in both eyes. (correspond to temporal hemianopia)
Figure 6.
Hemifield pattern visual evoked potentials results of the Case 1 patient. The results of both eyes correspond to temporal hemianopia.
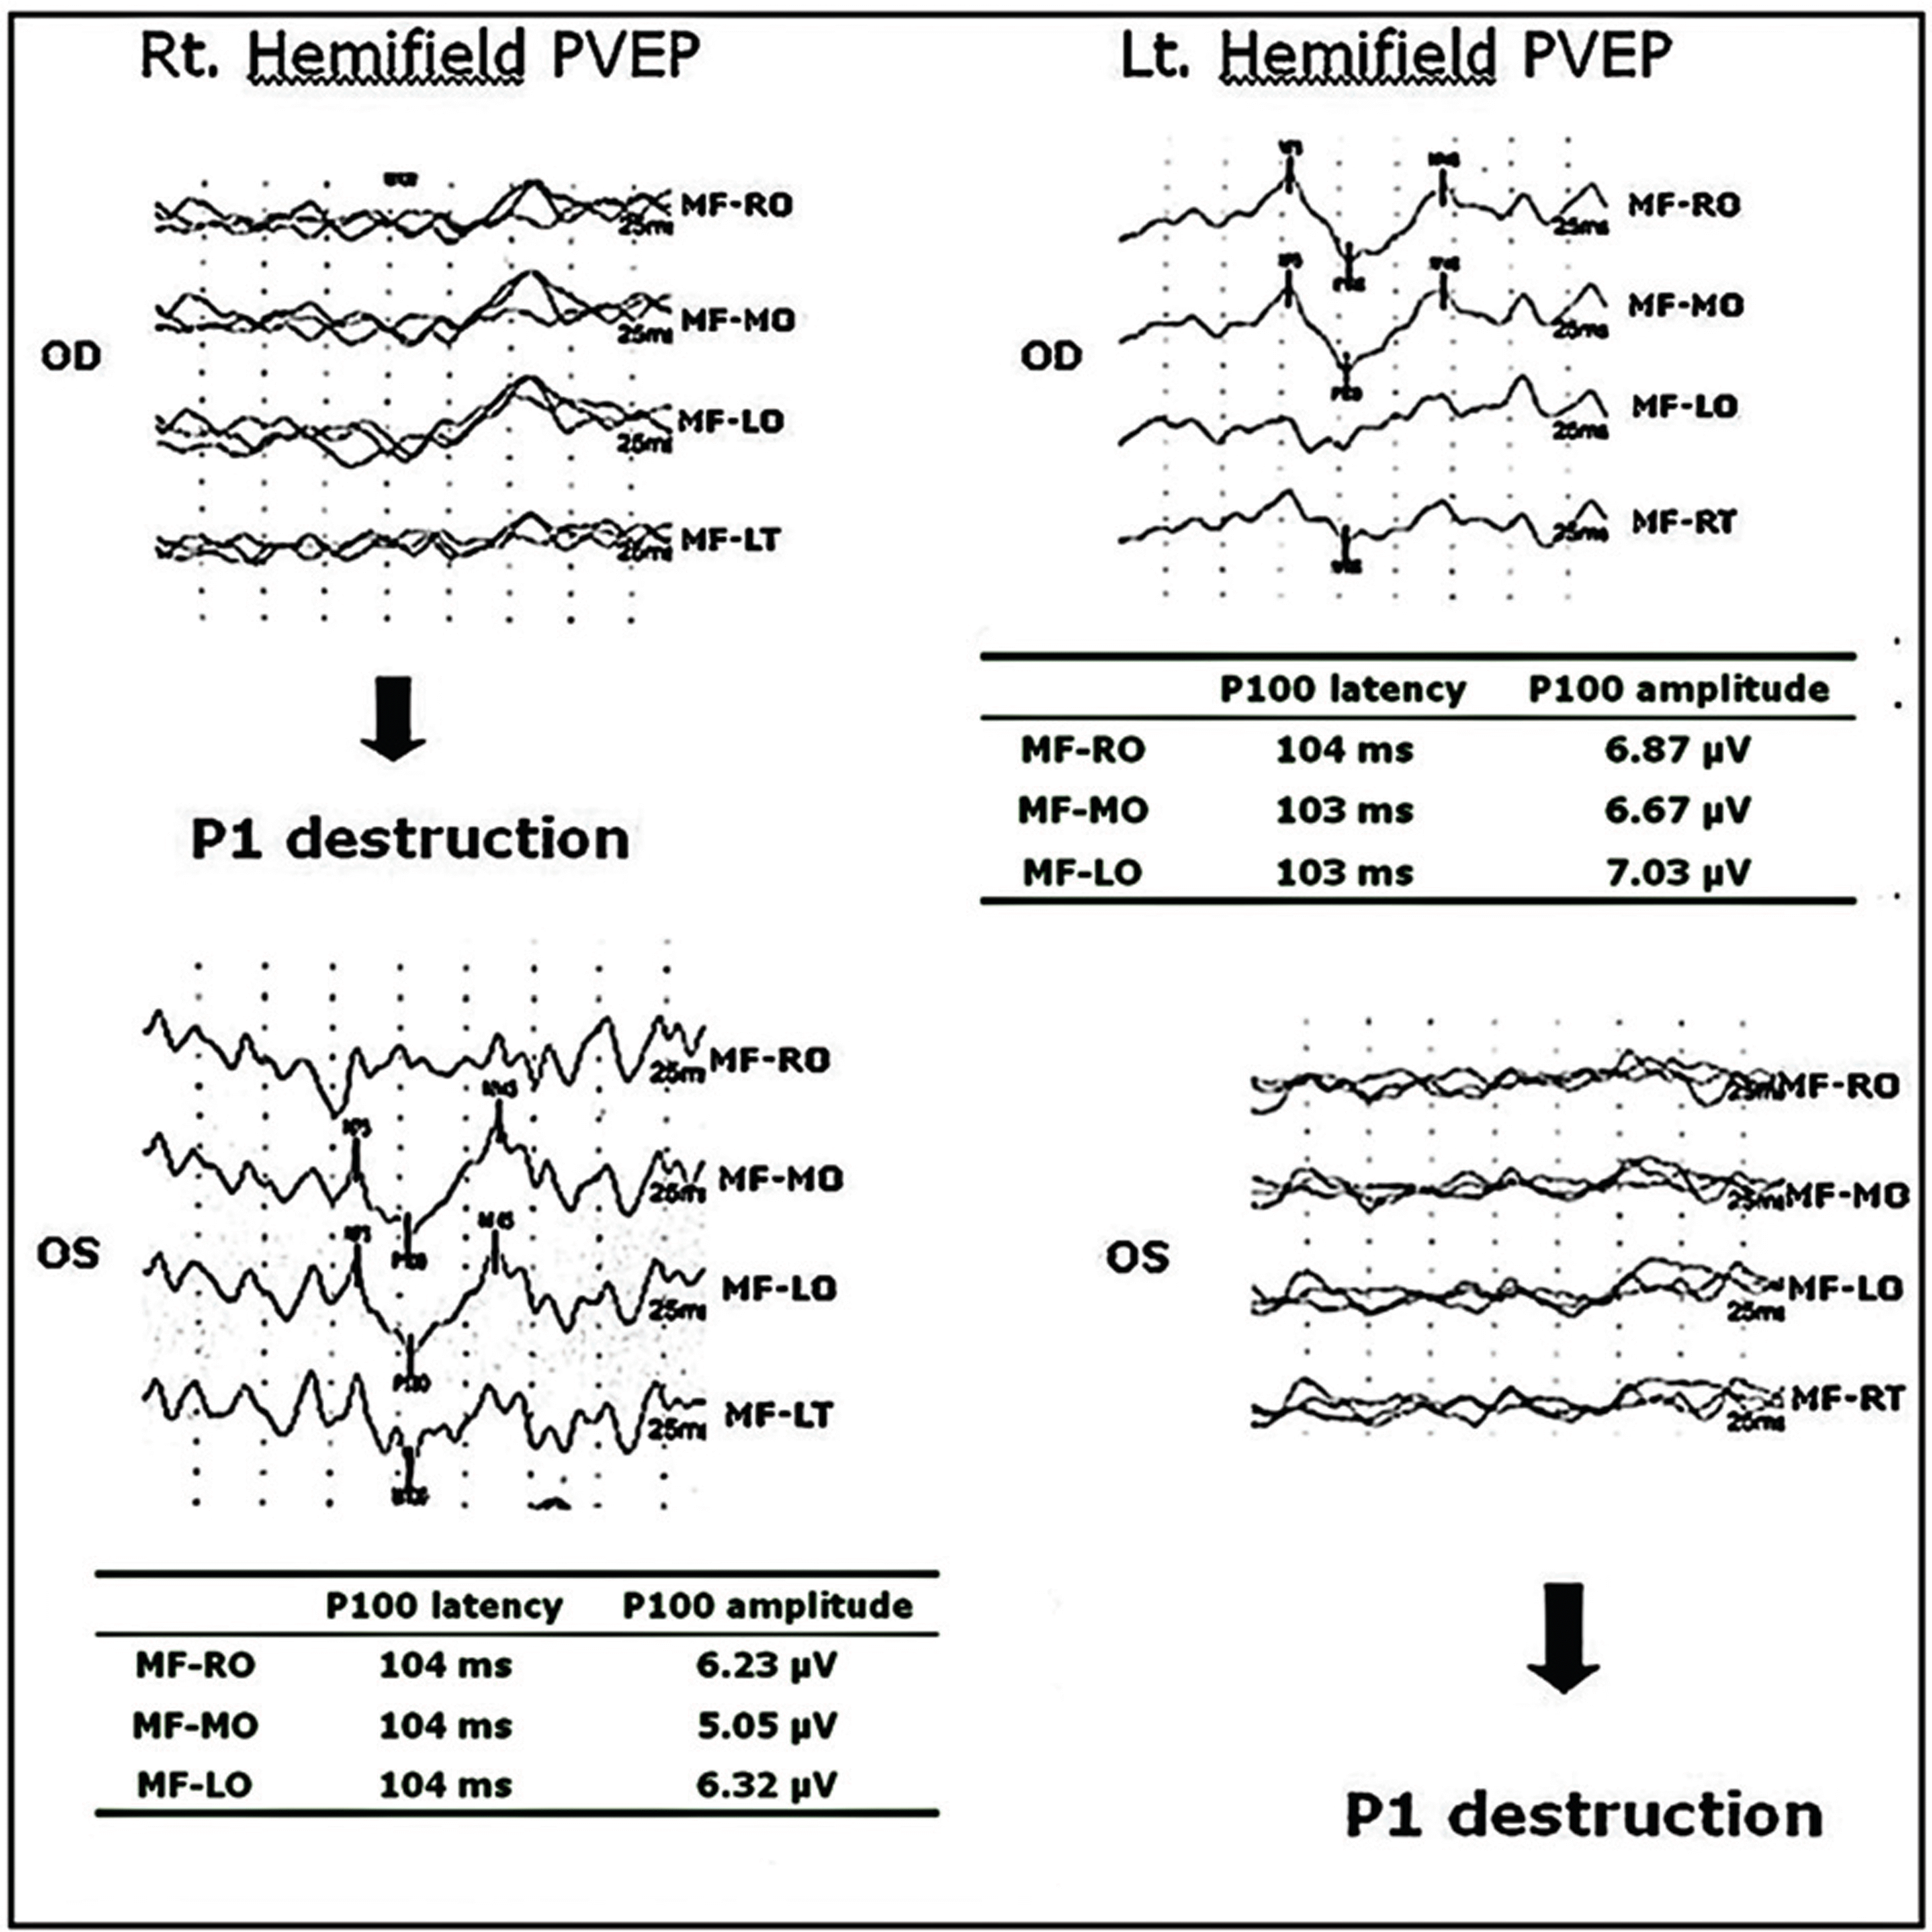
Figure 7.
Brain MRI of 62 years old man who had right homonymous hemianopia (Case 2). Acute infarction in the left posterior cerebral artery territory was identified (Blue arrows). (A) T2 Weighted image (B) diffusion view.
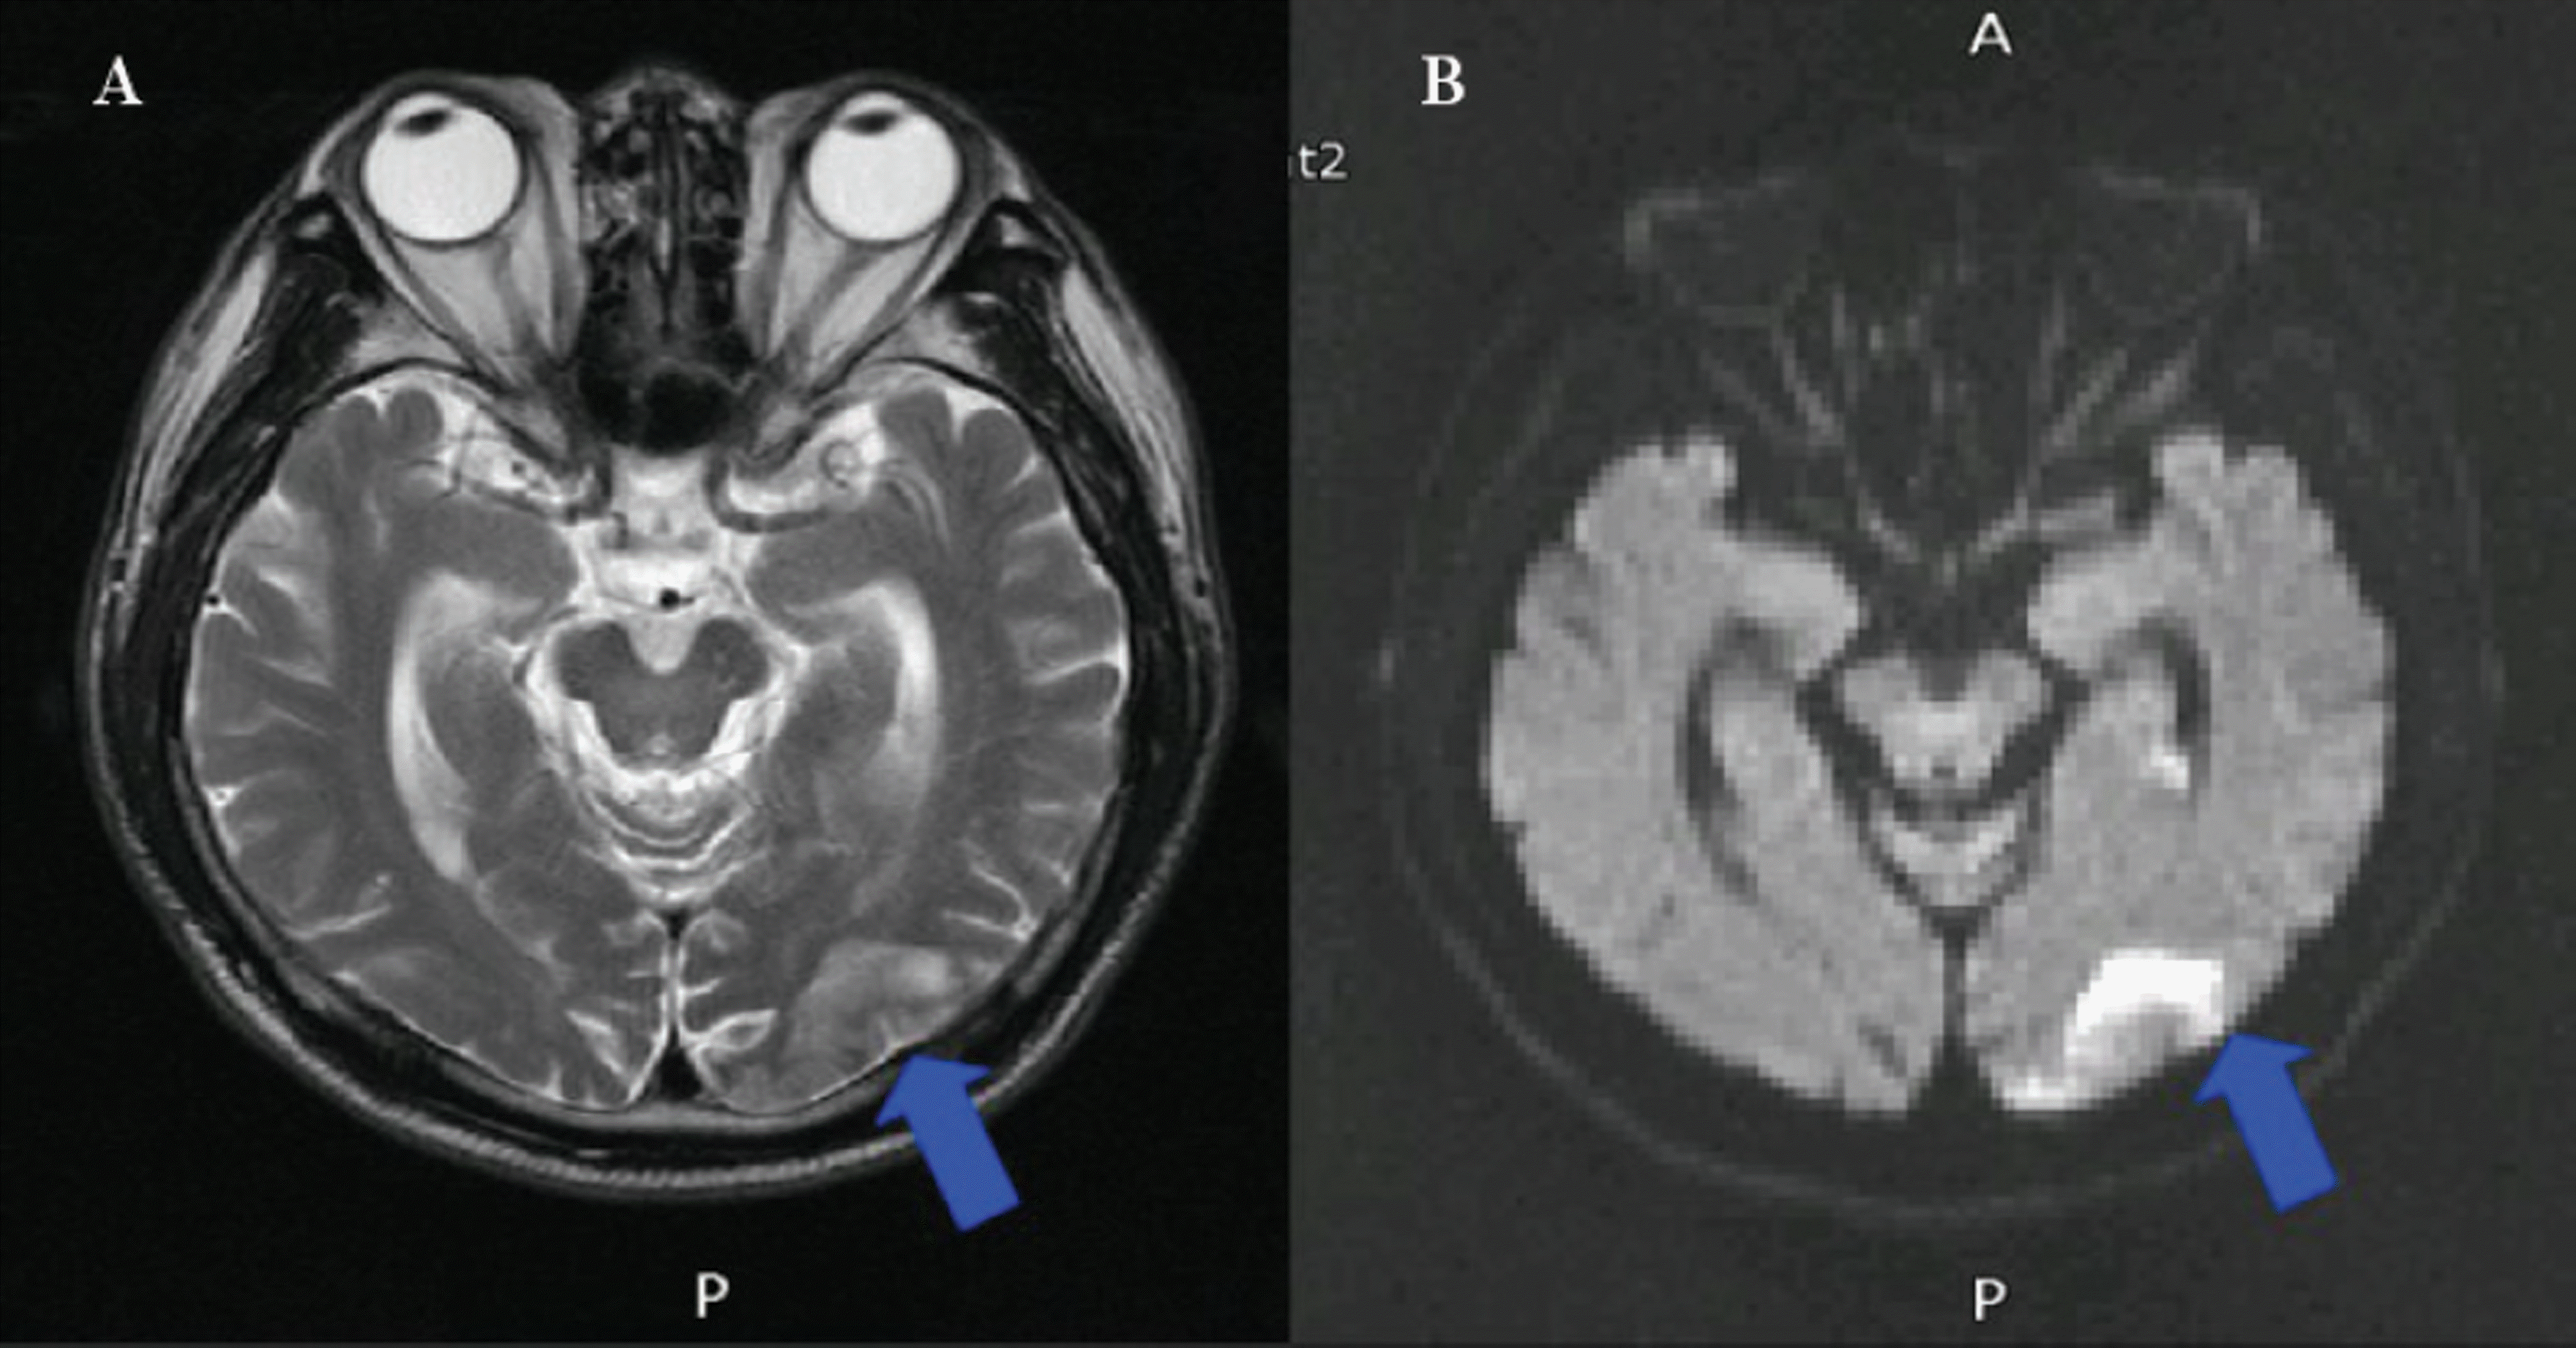
Figure 8.
Visual field by Goldmann perimetry (A, B) and retinal nerve fiber layer thickness measured by Optical coherence tomography (C) of Case 2 patient. Right homonymous hemianopia and normal RNFL thickness were identified.
Figure 9.
Hemifield pattern visual evoked potentials of Case 2 patient. At right hemifield stimulation ‘delayed latency’ was identified in both eyes. But at left hemifield stimulation normal latency was identified in both eyes. Monocular P100 latency, amplitude difference were significant in both of eyes (latency difference > 9 ms, amplitude difference > 1 µV). So the results of the right eye correspond to temporal hemianopia, and the results of left eye correspond to nasal hemianopia.
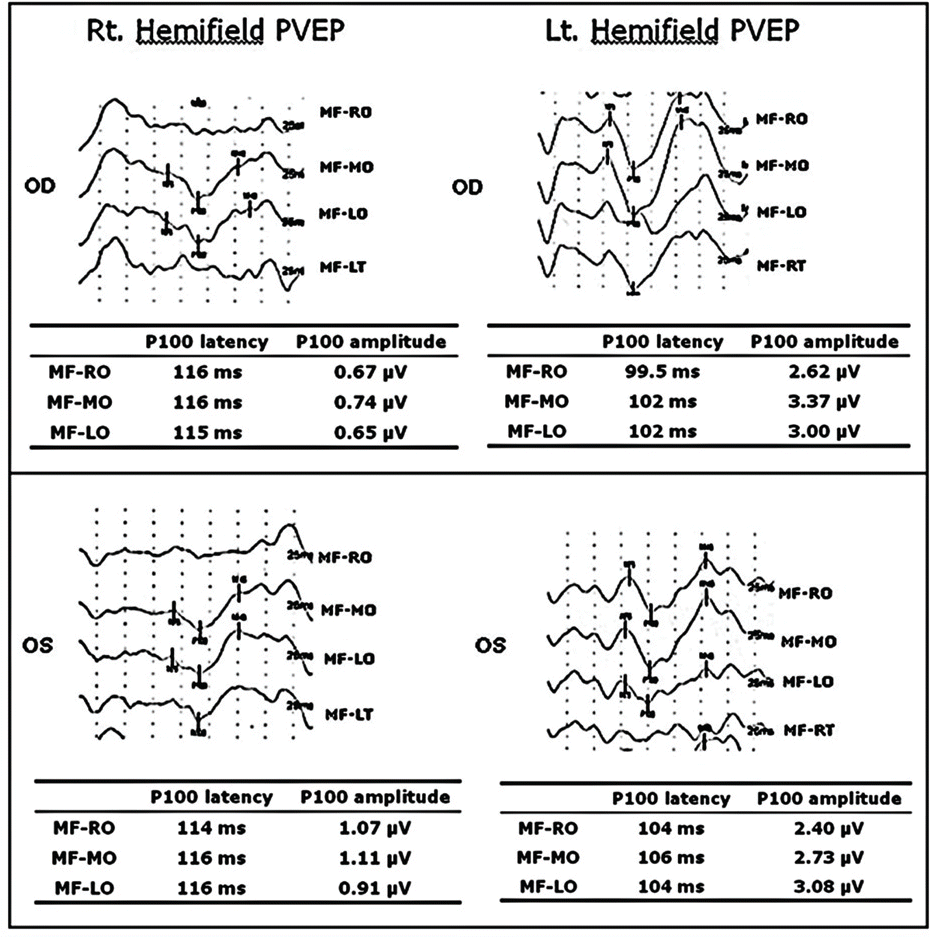
Table 1.
Demographic characteristics of patients
| Patient | Age (years) | Gender | BCVA* | Diagnosis | Visual field defect (hemianopia) |
|---|---|---|---|---|---|
| 1 | 36 | F | OD) 0.9 OS) LP(+) | Pituitary adenoma | Bitemporal |
| 2 | 25 | F | OU) 1.0 | Craniopharyngioma | Bitemporal |
| 3 | 37 | F | OD) 0.2 OS) 0.16 | Left occipital lesion by head trauma | Right homonymous |
| 4 | 38 | M | OD) 0.1 OS) 1.0 | Traumatic optic neuropathy | Right inferior |
| 5 | 62 | M | OD) 0.63 OD) 0.5 | Acute left PCA infarction | Right homonymous |
| 6 | 45 | F | OD) 0.5 OS) 0.32 | Diffuse axonal injury by head trauma | Right homonymous |
Table 2.
Pattern evoked potentials normative data of our laboratory (60 normal subjects)
Table 3.
Retinal nerve fiber layer thickness measured by optical coherence tomography
| Thickness of RNFL (µm) | |||||||||||||||||
|---|---|---|---|---|---|---|---|---|---|---|---|---|---|---|---|---|---|
| Eye | Average | Quadrants | Clock hours | ||||||||||||||
| Sup.* T | Temp.† | Inf.‡ | Nas.§ | 1 | 2 | 3 | 4 | 5 | 6 | 7 | 8 | 9 | 10 | 11 | 12 | ||
| Nas. | Inf. | Temp. | Sup. | ||||||||||||||
| Temp. | Temp. | ||||||||||||||||
| 1 | 64.83 | 81 | 34 | 103 | 42 | 44 | 46 | 45 | 35 | 79 | 146 | 84 | 30 | 30 | 41 | 89 | 109 |
| 2 | 48.14 | 53 | 43 | 58 | 40 | 46 | 43 | 39 | 36 | 40 | 81 | 53 | 35 | 46 | 47 | 49 | 63 |
| 3 | 85.95 | 116 | 57 | 121 | 50 | 85 | 67 | 40 | 43 | 86 | 161 | 116 | 37 | 44 | 91 | 152 | 110 |
| 4 | 83.29 | 119 | 51 | 118 | 45 | 80 | 63 | 34 | 38 | 71 | 129 | 155 | 51 | 26 | 77 | 137 | 141 |
| 5 | 69.75 | 92 | 48 | 103 | 36 | 60 | 30 | 29 | 49 | 74 | 134 | 100 | 36 | 37 | 71 | 129 | 88 |
| 6 | 64.50 | 78 | 50 | 81 | 49 | 108 | 70 | 38 | 39 | 78 | 85 | 81 | 57 | 48 | 44 | 47 | 79 |
| 7 | 53.91 | 38 | 30 | 109 | 38 | 32 | 33 | 33 | 49 | 118 | 127 | 84 | 34 | 28 | 29 | 40 | 41 |
| 8 | 105.39 | 123 | 73 | 153 | 72 | 122 | 80 | 53 | 82 | 138 | 170 | 152 | 70 | 67 | 83 | 132 | 115 |
| 9 | 99.28 | 112 | 70 | 123 | 92 | 88 | 111 | 88 | 76 | 97 | 114 | 159 | 80 | 48 | 84 | 118 | 129 |
| 10 | 98.18 | 115 | 71 | 121 | 86 | 116 | 114 | 71 | 74 | 105 | 117 | 140 | 63 | 57 | 93 | 99 | 129 |
| 11 | 75.28 | 100 | 37 | 113 | 50 | 65 | 39 | 49 | 62 | 79 | 152 | 109 | 30 | 28 | 54 | 106 | 129 |
| 12 | 94.66 | 98 | 59 | 106 | 116 | 134 | 136 | 106 | 106 | 126 | 116 | 76 | 64 | 65 | 47 | 63 | 97 |
Table 4.
Retinal nerve fiber layer thickness measured by optical coherence and correspondence to visual field defect
| Eye | Period* | Visual field defect | RNFL† thickness measured by OCT‡ | Correspondance to VF§ defect |
|---|---|---|---|---|
| 1 | 72 months | Temporal hemianopia | Temporal, nasal RNFL thinning | Yes |
| 2 | 72 months | Temporal hemianopia | Superior, temporal, inferior, nasal RNFL thinning | Yes |
| 3 | 7 months | Temporal hemianopia | Temporal, nasal RNFL thinning | Yes |
| 4 | 7 months | Temporal hemianopia | Temporal, nasal RNFL thinning | Yes |
| 5 | 9 months | Temporal hemianopia | Superior, temporal, nasal RNFL thinning | Yes |
| 6 | 9 months | Nasal hemianopia | Superior, inferior RNFL thinning | Yes |
| 7 | 8 months | Inerior hemianopia | Superior, temporal, nasal RNFL thinning | Yes |
| 8 | 8 months | No field defect | No thinning | Normal eye |
| 9 | 1 week | Temporal hemianopia | No thinning | No |
| 10 | 1 week | Nasal hemianopia | No thinning | No |
| 11 | 36 months | Temporal hemianopia | Temporal, nasal RNFL thinning | Yes |
| 12 | 36 months | Nasal hemianopia | Superior, inferior RNFL thinning | Yes |
Table 5.
The results of hemifield pattern visual evoked potentials and correspondence to visual field defect
| Eye | OD /OS | VF defect | Right. Hemifie | eld stimulation | Left. Hemifield stimulation | Mono-diff† | Correspondance to VF defect | |
|---|---|---|---|---|---|---|---|---|
| P100 latency | Inter-diff* | P100 latency | Inter-diff | |||||
| 1 | OD | TH‡ | Delayed latency | Delayed latency | Latency: sig§ Amplitude: sig | Yes | ||
| 2 | OS | TH | P1 destruction | No response | No | |||
| 3 | OD | TH | P1 destruction | Normal | Yes | |||
| 4 | OS | TH | Normal | P1 destruction | Yse | |||
| 5 | OD | TH | P1 destruction | P1 destruction | No | |||
| 6 | OS | NH∏ | P1 destruction | P1 destruction | No | |||
| 7 | OD | IH# | P1 destruction | P1 destruction | Yes | |||
| 8 | OS | Normal | Normal | Normal | Latency: not sig Amplitude:not sig | Normal eye | ||
| 9 | OD | TH | Delayed latency | Latency: not sig | Normal | Latency: not sig | Latency: sig Amplitude: sig | Yes |
| 10 | OS | NH | Delayed latency | Amplitude: not sig | Normal | Amplitude:not sig | Latency: sig Amplitude: sig | Yes |
| 11 | OD | TH | Normal | Latency: not sig | Normal | Latency: not sig | Latency: sig Amplitude:sig | Yes |
| 12 | OS | NH | Normal | Amplitude: not sig | Normal | Amplitude: not sig | Latency: not sig Amplitude: not sig | No |


 PDF
PDF ePub
ePub Citation
 Print
Print


 XML Download