Abstract
Purpose
To compare the clinical outcomes between patients undergoing argon laser trabeculoplasty (ALT) and those undergoing selective laser trabeculoplasty (SLT).
Methods
Sixty-one eyes of 61 patients with primary open-angle glaucoma who were treated with more than 1 kind of antiglaucoma medication eye drop were enrolled in this study. Thirty-five eyes of 35 patients were treated with argon laser trabeculoplasty (ALT). Twenty-six eyes of 26 patients were treated with selective laser trabeculoplasty (SLT). The mean IOP at 1, 3, 6, and 12 months and the success rate of treatment at the 12-month follow-up period were evaluated in all patients.
Results
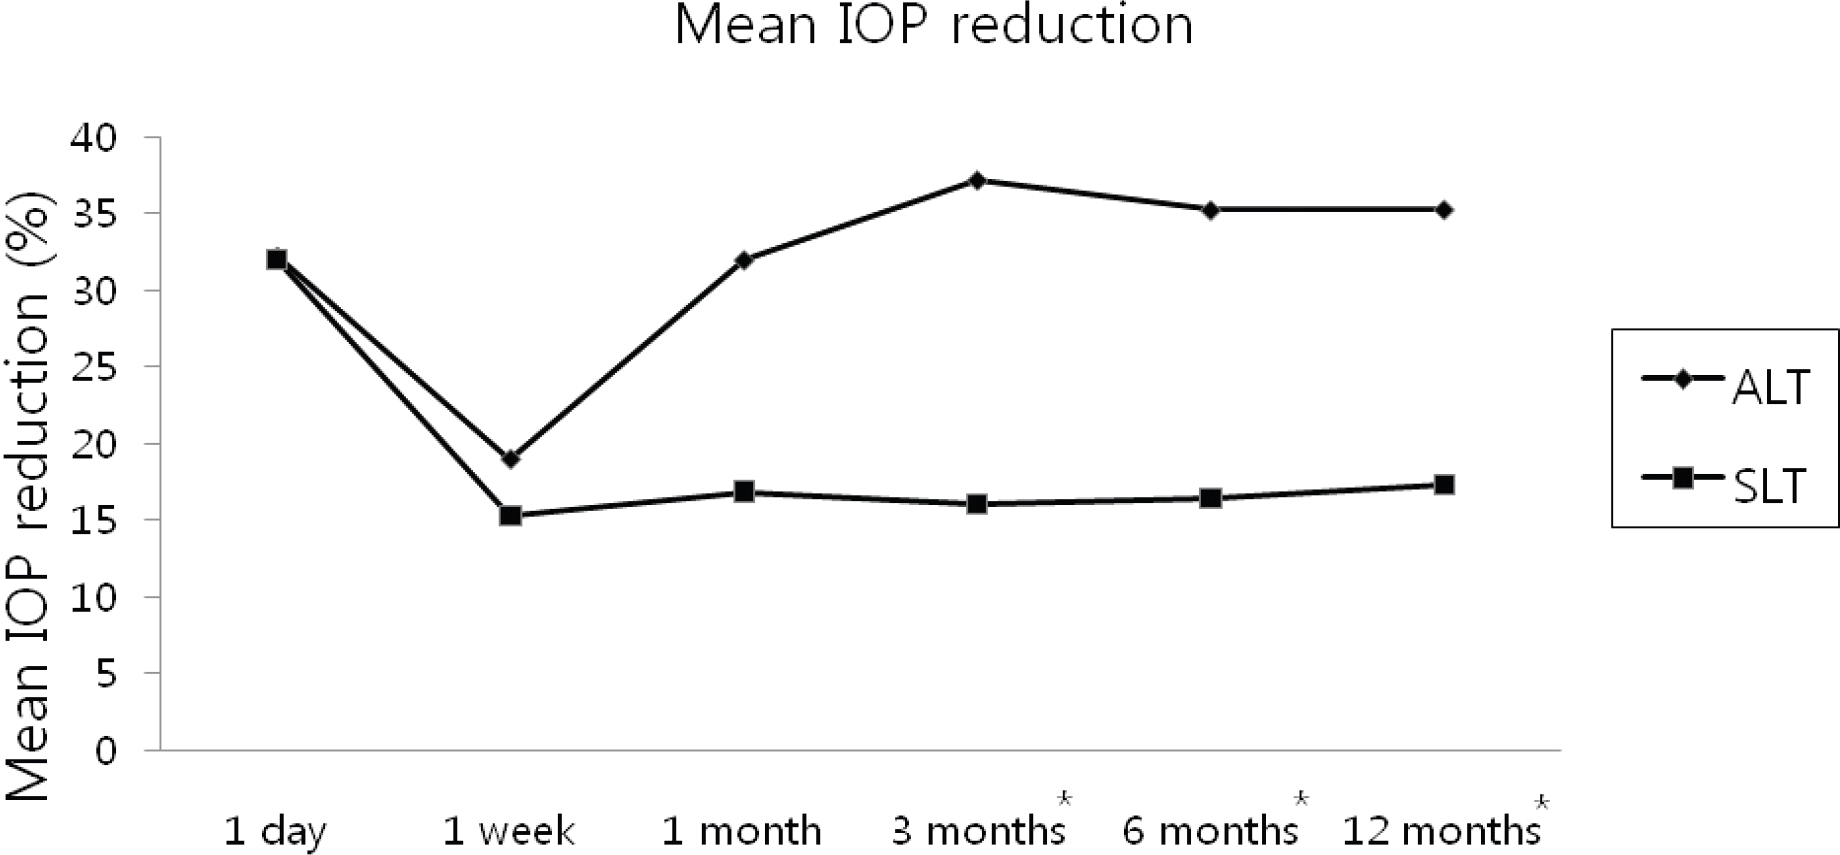
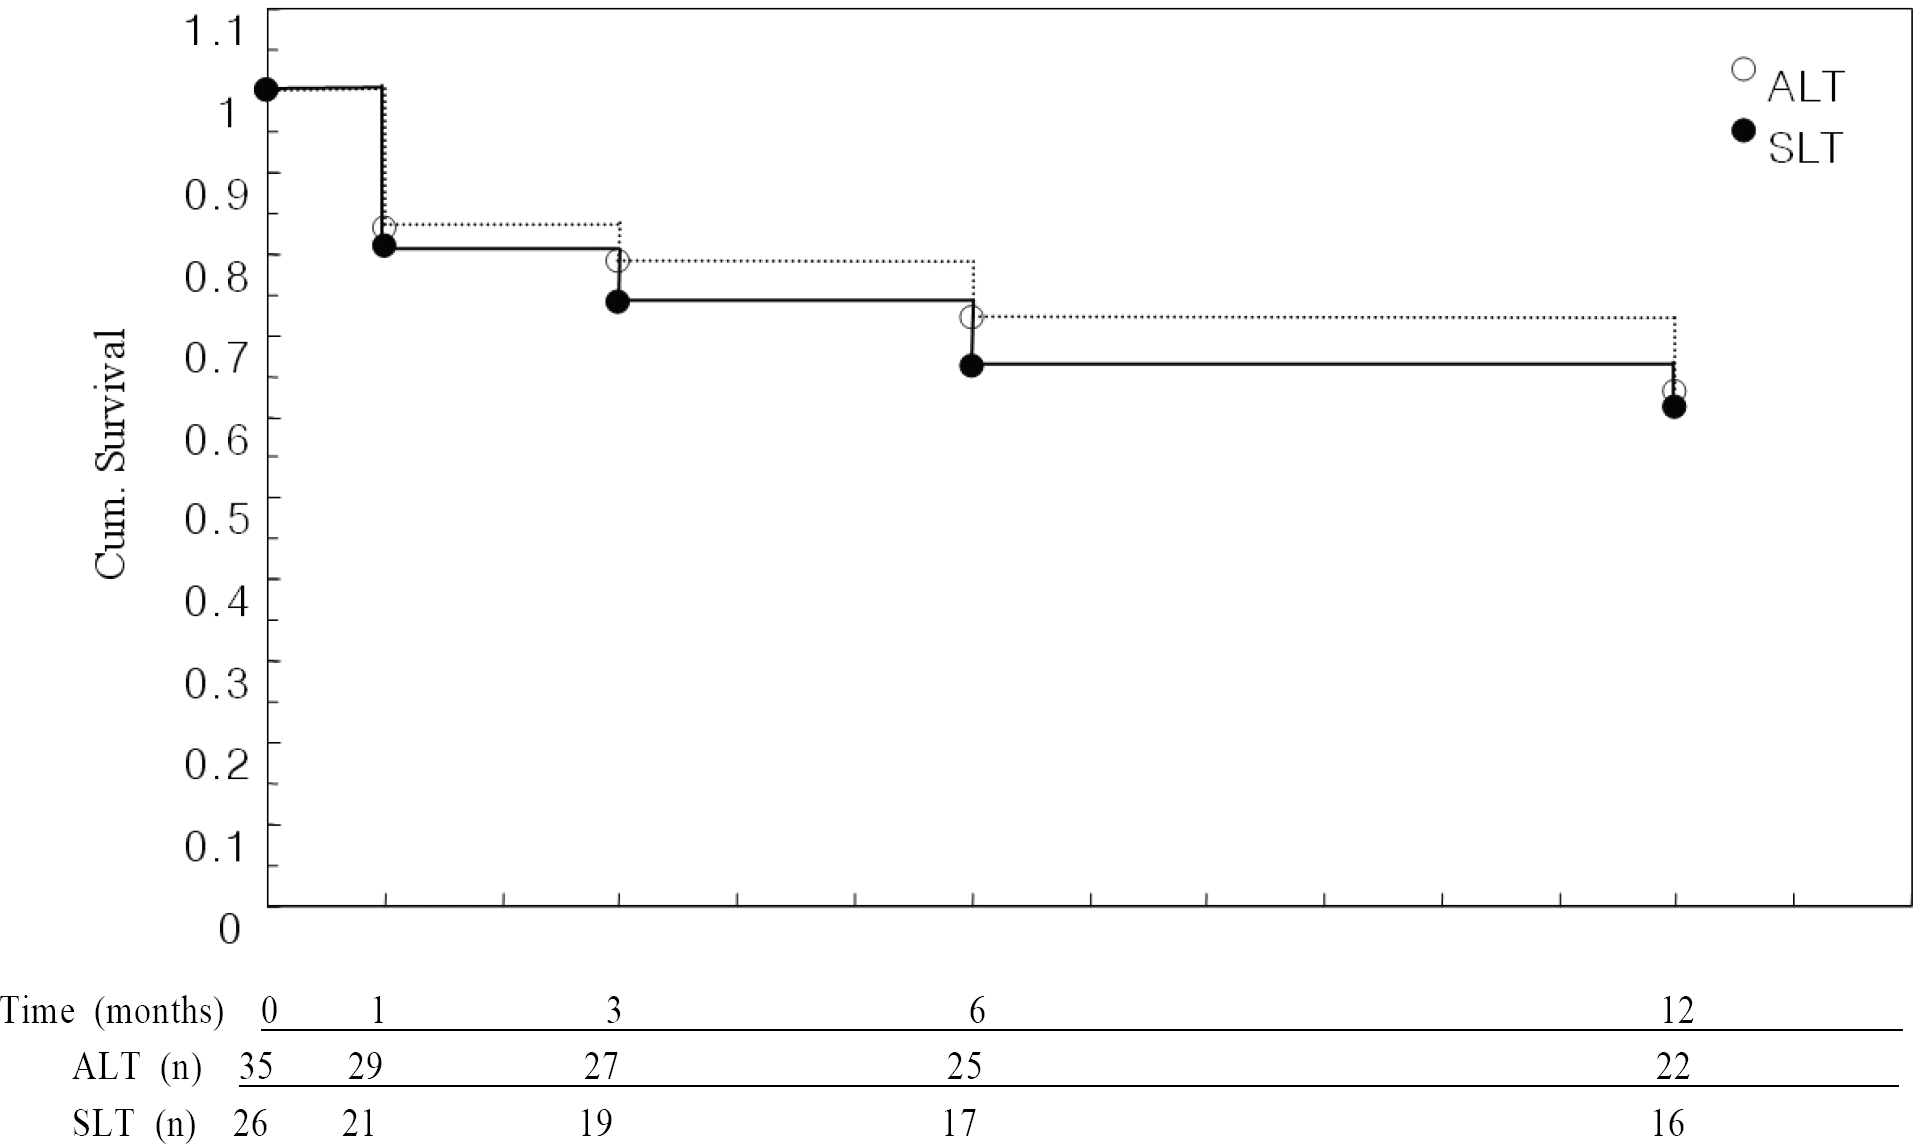
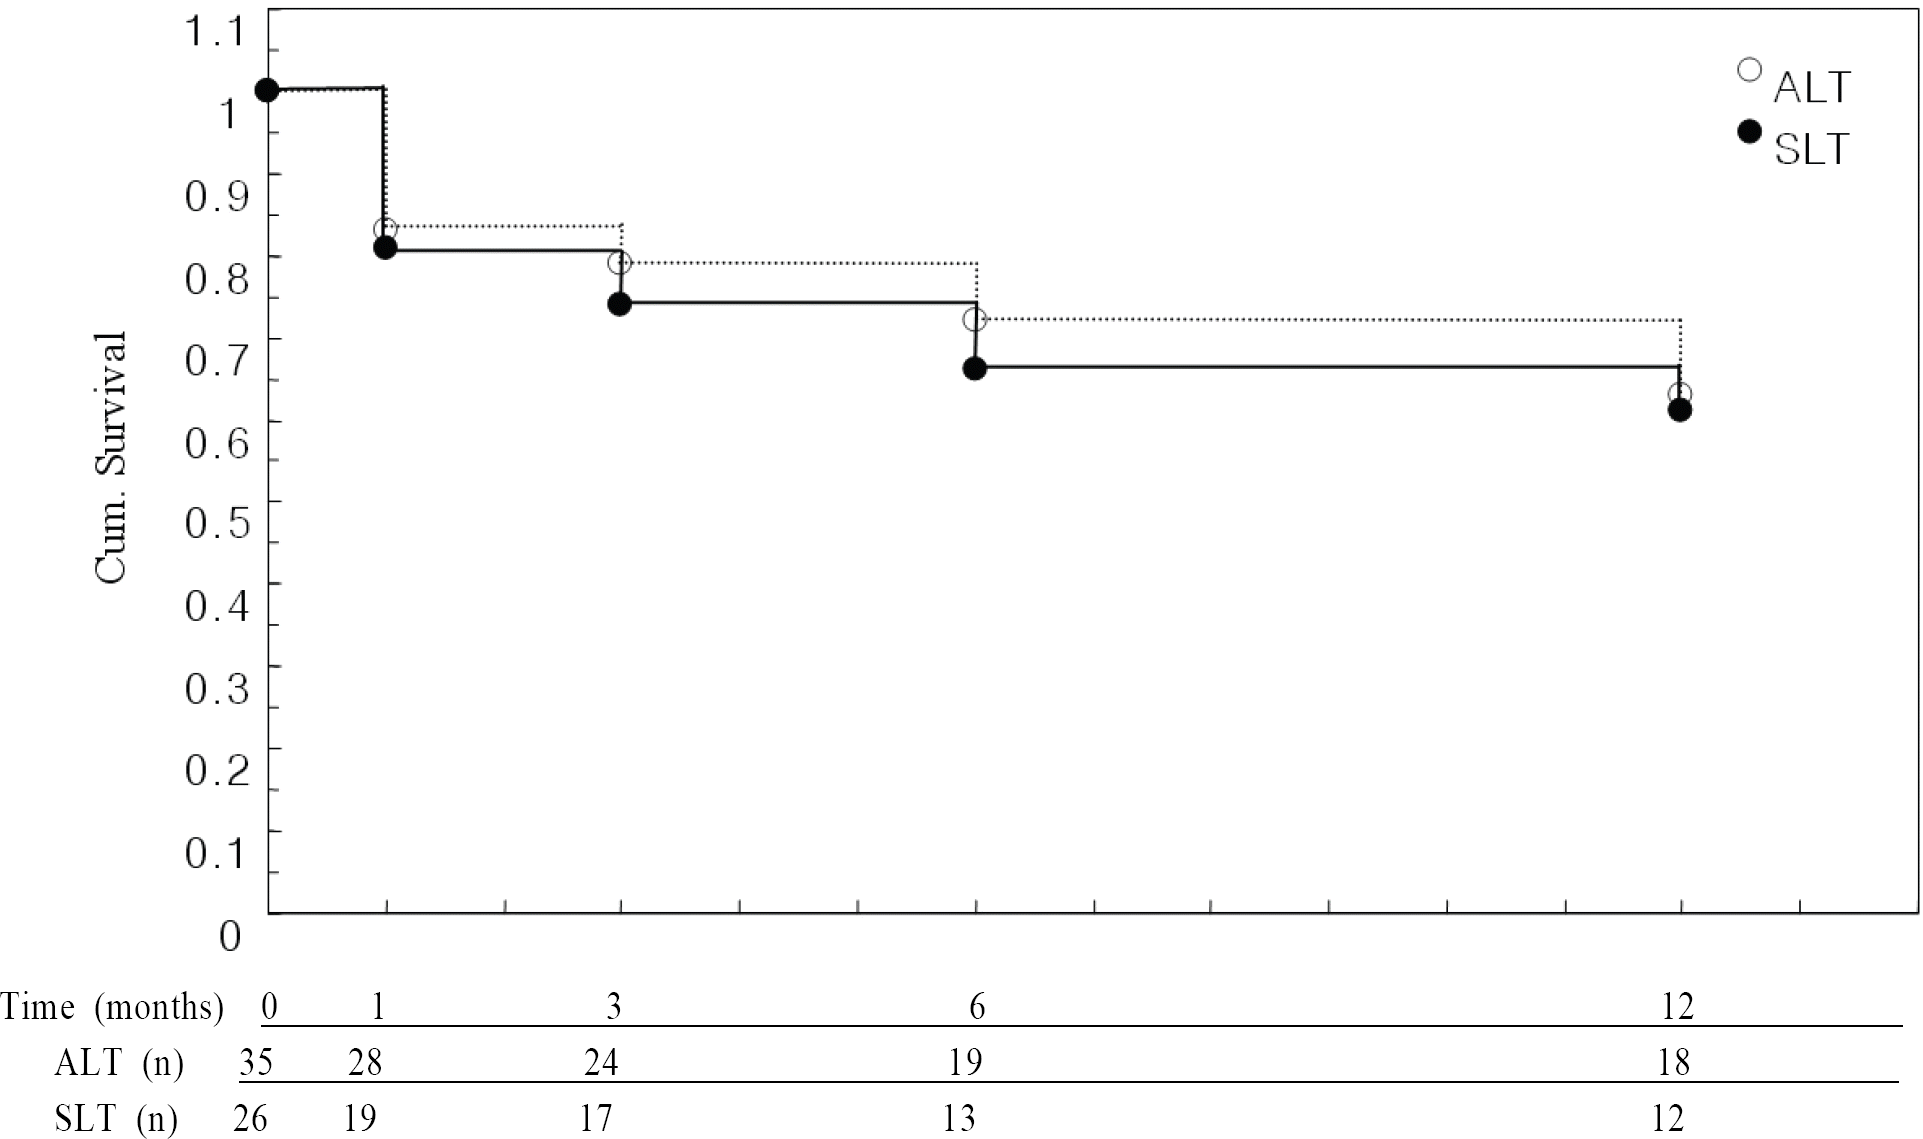
At 12 months postoperative, the ALT group had a mean IOP of 16.53±2.58 mmHg with a mean IOP reduction of 35.27%, while the SLT group had a mean IOP of 18.40±5.61 mmHg with a mean IOP reduction of 17.37%. The success rates of treatment defined as definition 1 were 62.85% in ALT and 62.50% in SLT, and the success rates defined as definition 2 were 51.42% in ALT and 46.15% in SLT.
Go to : 
References
1. Wise JB, Witter SL. Argon laser therapy for open-angle glaucoma. A pilot study. Arch Ophthalmol. 1979; 97:319–22.
2. Latina MA, Park C. Selective targeting of trabecular meshwork cells: in vitro studies of pulsed and CW laser interactions. Exp Eye Res. 1995; 60:359–71.

3. Latina MA, Sibayan SA, Shin DH. . Q-switched 532-nm Nd:YAG laser trabeculoplasty (selective laser trabeculoplasty): a multicenter, pilot, clinical study. Ophthalmology. 1998; 105:2082–8.
4. Noecker RJ, Kramer TR, Latina M. . Comparison of acute morphologic changes after selective laser trabeculoplasty and argon laser trabeculoplasty by electron microscopic evaluation. Invest Ophthalmol Vis Sci. 1998; 39:472–3.
5. Song J, Lee PP, Epstein DL. . High failure rate associated with 180 degrees selective laser trabeculoplasty. J Glaucoma. 2005; 14:400–8.

6. Lee HS, Baek NH, Moon JI. Comparison of short-term outcomes of argon laser versus selective laser trabeculoplasty in open-angle glaucoma. J Korean Ophthalmol Soc. 2005; 46:2004–9.
7. Wise JB. Glaucoma treatment by trabecluar tightening with argon laser. Int ophthalmol Clin. 1981; 21:69–78.
8. Kramer TR, Noecker RJ. Comparison of the morphologic changes after selective laser trabeculoplasty and argon laser trabeculoplasty in human eye bank eyes. Ophthalmology. 2001; 108:773–9.

9. Kim JS, Lee YG, Hong YJ. Institute of Vision Reseach, Q-switched frequency doubled Nd:YAG laser trabeculeoplasty. J Korean Ophthalmol Soc. 1999; 40:2591–6.
10. Kim YJ, Moon CS. One-year follow-up of laser trabeculoplasty using Q-switched frequency-doubled Nd:YAG laser 523 nm wavelength. Ophthalmic Surg Lasers. 2000; 31:394–9.
11. Damji KF, Shah KC, Rock WJ. . Selective laser trabeculoplasty versus argon laser trabeculoplasty: a prospective randomized clinical trial. Br J Ophthalmol. 1999; 83:718–22.
12. Tuulonen AN, Airaksinen J, Kuulosmaa K. Factors influencing the outcome of laser trabeculoplasty. Am J ophthalmol. 1985; 99:388–91.

13. Thomas JV, El-Moffy T, Hamdy EE, Simmons RJ. Argon laser trabeculoplasty as initial therapy for glaucoma. Arch Ophthalmol. 1984; 102:702–3.

14. Yoon HS, Oum BS. Clinical result of argon laser trabeculoplasty in open angle glaucoma. J Korean Ophthalmol Soc. 1986; 27:179–85.
15. Damji KF, Bovell AM, Hodge WG. . Selective laser trabeculoplasty versus argon laser trabeculoplasty: results from a 1 year randomized clinical trial. Br J Ophthalmol. 2006; 90:1490–4.
16. Harasymowycz, Papamatheakis DG, Latina M. . Selective laser trabeculoplasty complicated by intraocular pressure elevation in eyes with heavily pigmented trabecular meshworks. Am J Ophthalmol. 2005; 139:1110–3.
Go to : 
 | Figure 1.Mean IOP reduction percent during follow-up period; * There were significant statistical differences between the two groups at 3, 6, 12 months; ALT=argon laser trabeculoplasty; SLT=selective laser trabeculoplasty. |
 | Figure 2.Kaplan-Meier survival curve using definition 1 (failure defined as a decrease in IOP of 3 mmHg or less of the baseline IOP and needs for additional medication, additional laser or glaucoma surgery) in ALT and SLT groups. There were no significant statistical differences between the two groups during the follow-up period; Cum=cumulative; n=number of all eyes defined as success of treatment by definition 1 in each group at each time point; ALT=argon laser trabeculoplasty; SLT=selective laser trabeculoplasty. |
 | Figure 3.Kaplan-Meier survival curve using definition 2 (failure defined as a decrease in IOP of 20% or less of the baseline IOP and needs for additional medication, additional laser or glaucoma surgery) in ALT and SLT groups. There were no significant statistical differences between the two groups during the follow-up period; Cum=cumulative; n=number of all eyes defined as success of treatment by definition 2 in each group at each time point. ALT=argon laser trabeculoplasty; SLT=selective laser trabeculoplasty. |
Table 1.
Patient demographics at baseline
| ALT | SLT | p-value | |
|---|---|---|---|
| Number of subjects (eye) | 35 (35) | 26 (26) | |
| Age (year) (Mean±SD) | 52.31±13.15 | 58.27±11.79 | 0.07* |
| Sex, n (%) | |||
| Male | 30 (85.7%) | 19 (73.1%) | 0.64† |
| Female | 5 (14.3%) | 7 (26.9%) | |
| Diagnosis, n (%) | |||
| POAG | 35 (100.0%) | 26 (100.0%) | |
| Degrees of glaucomatous visual field loss, n (%) | 0.71†† | ||
| Early glaucomatous loss | 3 (8.5%) | 4 (15.4%) | |
| Moderate glaucomatous loss | 14 (40%) | 10 (38.4%) | |
| Advanced glaucomatous loss | 18 (51.5%) | 12 (46.2%) | |
| Baseline IOP (Mean±SD) | 25.54±8.16 | 22.27±9.43 | 0.27∗ |
| No. of glaucoma medication at baseline (Mean±SD) | 3.65±0.98 | 2.64±1.50 | 0.65‡ |
Table 2.
Intraocular pressure (Mean±SD) during the follow-up period
| Time | IOP of ALT group (mmHg) | IOP of SLT group (mmHg) | p-value∗ |
|---|---|---|---|
| Baseline | 25.54±8.16 | 22.27±9.43 | 0.27 |
| 1 day | 17.31±10.31 | 15.15±8.73 | 0.10 |
| 1 week | 20.69±9.72 | 18.85±8.78 | 0.22 |
| 1 month | 17.37±5.18 | 18.50±5.72 | 0.15 |
| 3 months | 16.04±3.63 | 18.68±3.54 | 0.21 |
| 6 months | 16.54±4.88 | 18.60±5.81 | 0.20 |
| 12 months | 16.53±2.58 | 18.40±5.61 | 0.19 |
Table 3.
Mean IOP reduction (Mean±SD) during the follow-up period
| Time | No. of case in ALT | IOP reduction of ALT group (mmHg) | No. of case in SLT | IOP reduction of SLT group (mmHg) | ∆ IOP reduction of two group (ALT-SLT) | p-value∗ |
|---|---|---|---|---|---|---|
| 1 day | 35 | 8.23±2.52 (32.22%) | 26 | 7.12±2.10 (31.97%) | +1.11±0.75 | 0.38 |
| 1 week | 35 | 4.85±3.25 (18.98%) | 26 | 3.42±3.21 (15.35%) | +1.43±0.12 | 0.54 |
| 1 month | 30 | 8.17±4.05 (31.98%) | 24 | 3.77±3.72 (16.92%) | +4.14±1.12 | 0.13 |
| 3 months | 27 | 9.50±5.21 (37.19%) | 26 | 3.59±4.10 (16.12%) | +5.12±0.98 | 0.02 |
| 6 months | 27 | 9.00±4.17 (35.23%) | 26 | 3.67±3.18 (16.47%) | +5.14±1.15 | <0.01 |
| 12 months | 26 | 9.01±3.18 (35.27%) | 26 | 3.87±3.10 (17.37%) | +5.12±0.82 | 0.03 |
Table 4.
Mean IOP reduction of subgroups in ALT and SLT group using definition 1
| Baseline IOP (mmHg) | Post IOP after 12 month (mmHg) | ∆ IOP (mmHg) | p-value∗ | |
|---|---|---|---|---|
| Success subgroup in ALT (n=22, 62.85%) | 23.62±6.02 | 15.61±2.97 | -8.01±4.93 | <0.001 |
| Failure subgroup in ALT (n=13, 37.15%) | 28.79±10.33 | 27.28±10.84 | -1.52±5.06 | 0.62 |
| Success subgroup in SLT (n=16, 62.50%) | 29.97±11.06 | 17.24±3.66 | -12.72±13.67 | 0.03 |
| Failure subgroup in SLT (n=10, 37.50%) | 20.44±8.27 | 20.30±7.45 | -0.13±6.41 | 0.96 |
Table 5.
Mean IOP reduction of subgroups in ALT and SLT group using definition 2
| Baseline IOP (mmHg) | Post IOP after 12 month (mmHg) | ∆ IOP (mmHg) | p-value∗ | |
|---|---|---|---|---|
| Success subgroup in ALT (n=18, 51.42%) | 24.09±6.44 | 15.17±2.99 | -37.0% | <0.001 |
| Failure subgroup in ALT (n=17, 48.58%) | 27.08±9.61 | 25.00±10.34 | -7.7% | 0.58 |
| Success subgroup in SLT (n=12, 46.15%) | 31.79±11.87 | 17.47±4.18 | -45.0% | 0.04 |
| Failure subgroup in SLT (n=14, 53.85%) | 20.54±8.08 | 20.12±7.32 | -2.0% | 0.91 |
Table 6.
Predictive factors for failure of treatment by definition 1 and definition 2
| ALT group | SLT group | |||
|---|---|---|---|---|
| Definition I | Definition II | Definition I | Definition II | |
| Factors | p valuetable∗ | p value∗ | p value∗ | p value∗ |
| Baseline IOP | 0.12 | 0.268 | 0.04 | 0.025 |
| Age | 0.25 | 0.38 | 0.29 | 0.35 |
| Perimetric grade | 0.27 | 0.31 | 0.26 | 0.30 |
| No. of medication | 0.27 | 0.48 | 0.29 | 0.37 |
| Laser spot count | 0.28 | 0.37 | 0.29 | 0.38 |
ALT=argon laser trabeculoplasty; SLT=selective laser trabeculoplasty; Definition 1=failure defined as a decrease in IOP of 3 mmHg or less and needs for additional medication, additional laser or glaucoma surgery; Definition 2=failure defined as a decrease in IOP of 20% or less of baseline IOP and needs for additional medication, additional laser or glaucoma surgery;
Table 7.
Mean number of medications in ALT versus SLT at baseline and 12 months
| ALT group (mean±SD) | SLT group (mean±SD) | p-value∗ | |
|---|---|---|---|
| Baseline | 3.65±1.05 | 2.64±0.75 | 0.73 |
| 12 months | 3.19±0.72 | 2.54±0.50 | 0.62 |
Table 8.
Early inflammation in the anterior chamber and early IOP elevation in ALT versus SLT
| ALT group | SLT group | p-value∗ | |
|---|---|---|---|
| Inflammation in AC | 24 (68.5%) | 6 (23%) | 0.001 |
| Early IOP elevation | 6 (17.1%) | 4 (15.3%) | 0.95 |


 PDF
PDF ePub
ePub Citation
 Print
Print


 XML Download