Abstract
Purpose
To investigate the difference between superior and inferior peripapillary retinal nerve fiber layer (RNFL) thickness in early glaucoma patients who have RNFL defect in either superior quadrant or inferior quadrant and to determine if it can be useful to detect early glaucomatous change.
Methods
Eighty eight patients with early glaucoma who have RNFL defect in either the superior quadrant or the inferior quadrant as confirmed by red free photograph (40 eyes with normal standard automated perimetry and 48 eyes with early glaucomatous visual field loss) were divided into the superior RNFL defect group and the inferior RNFL defect group. The average RNFL thickness was measured in the superior and inferior quadrants using optical coherence tomography and the thickness differences between the superior and the inferior quadrants (S-I difference) were compared among early glaucoma eyes and 59 normal controls. Then, discriminative power of the S-I difference was assessed by area under ROC (AUROC).
Results
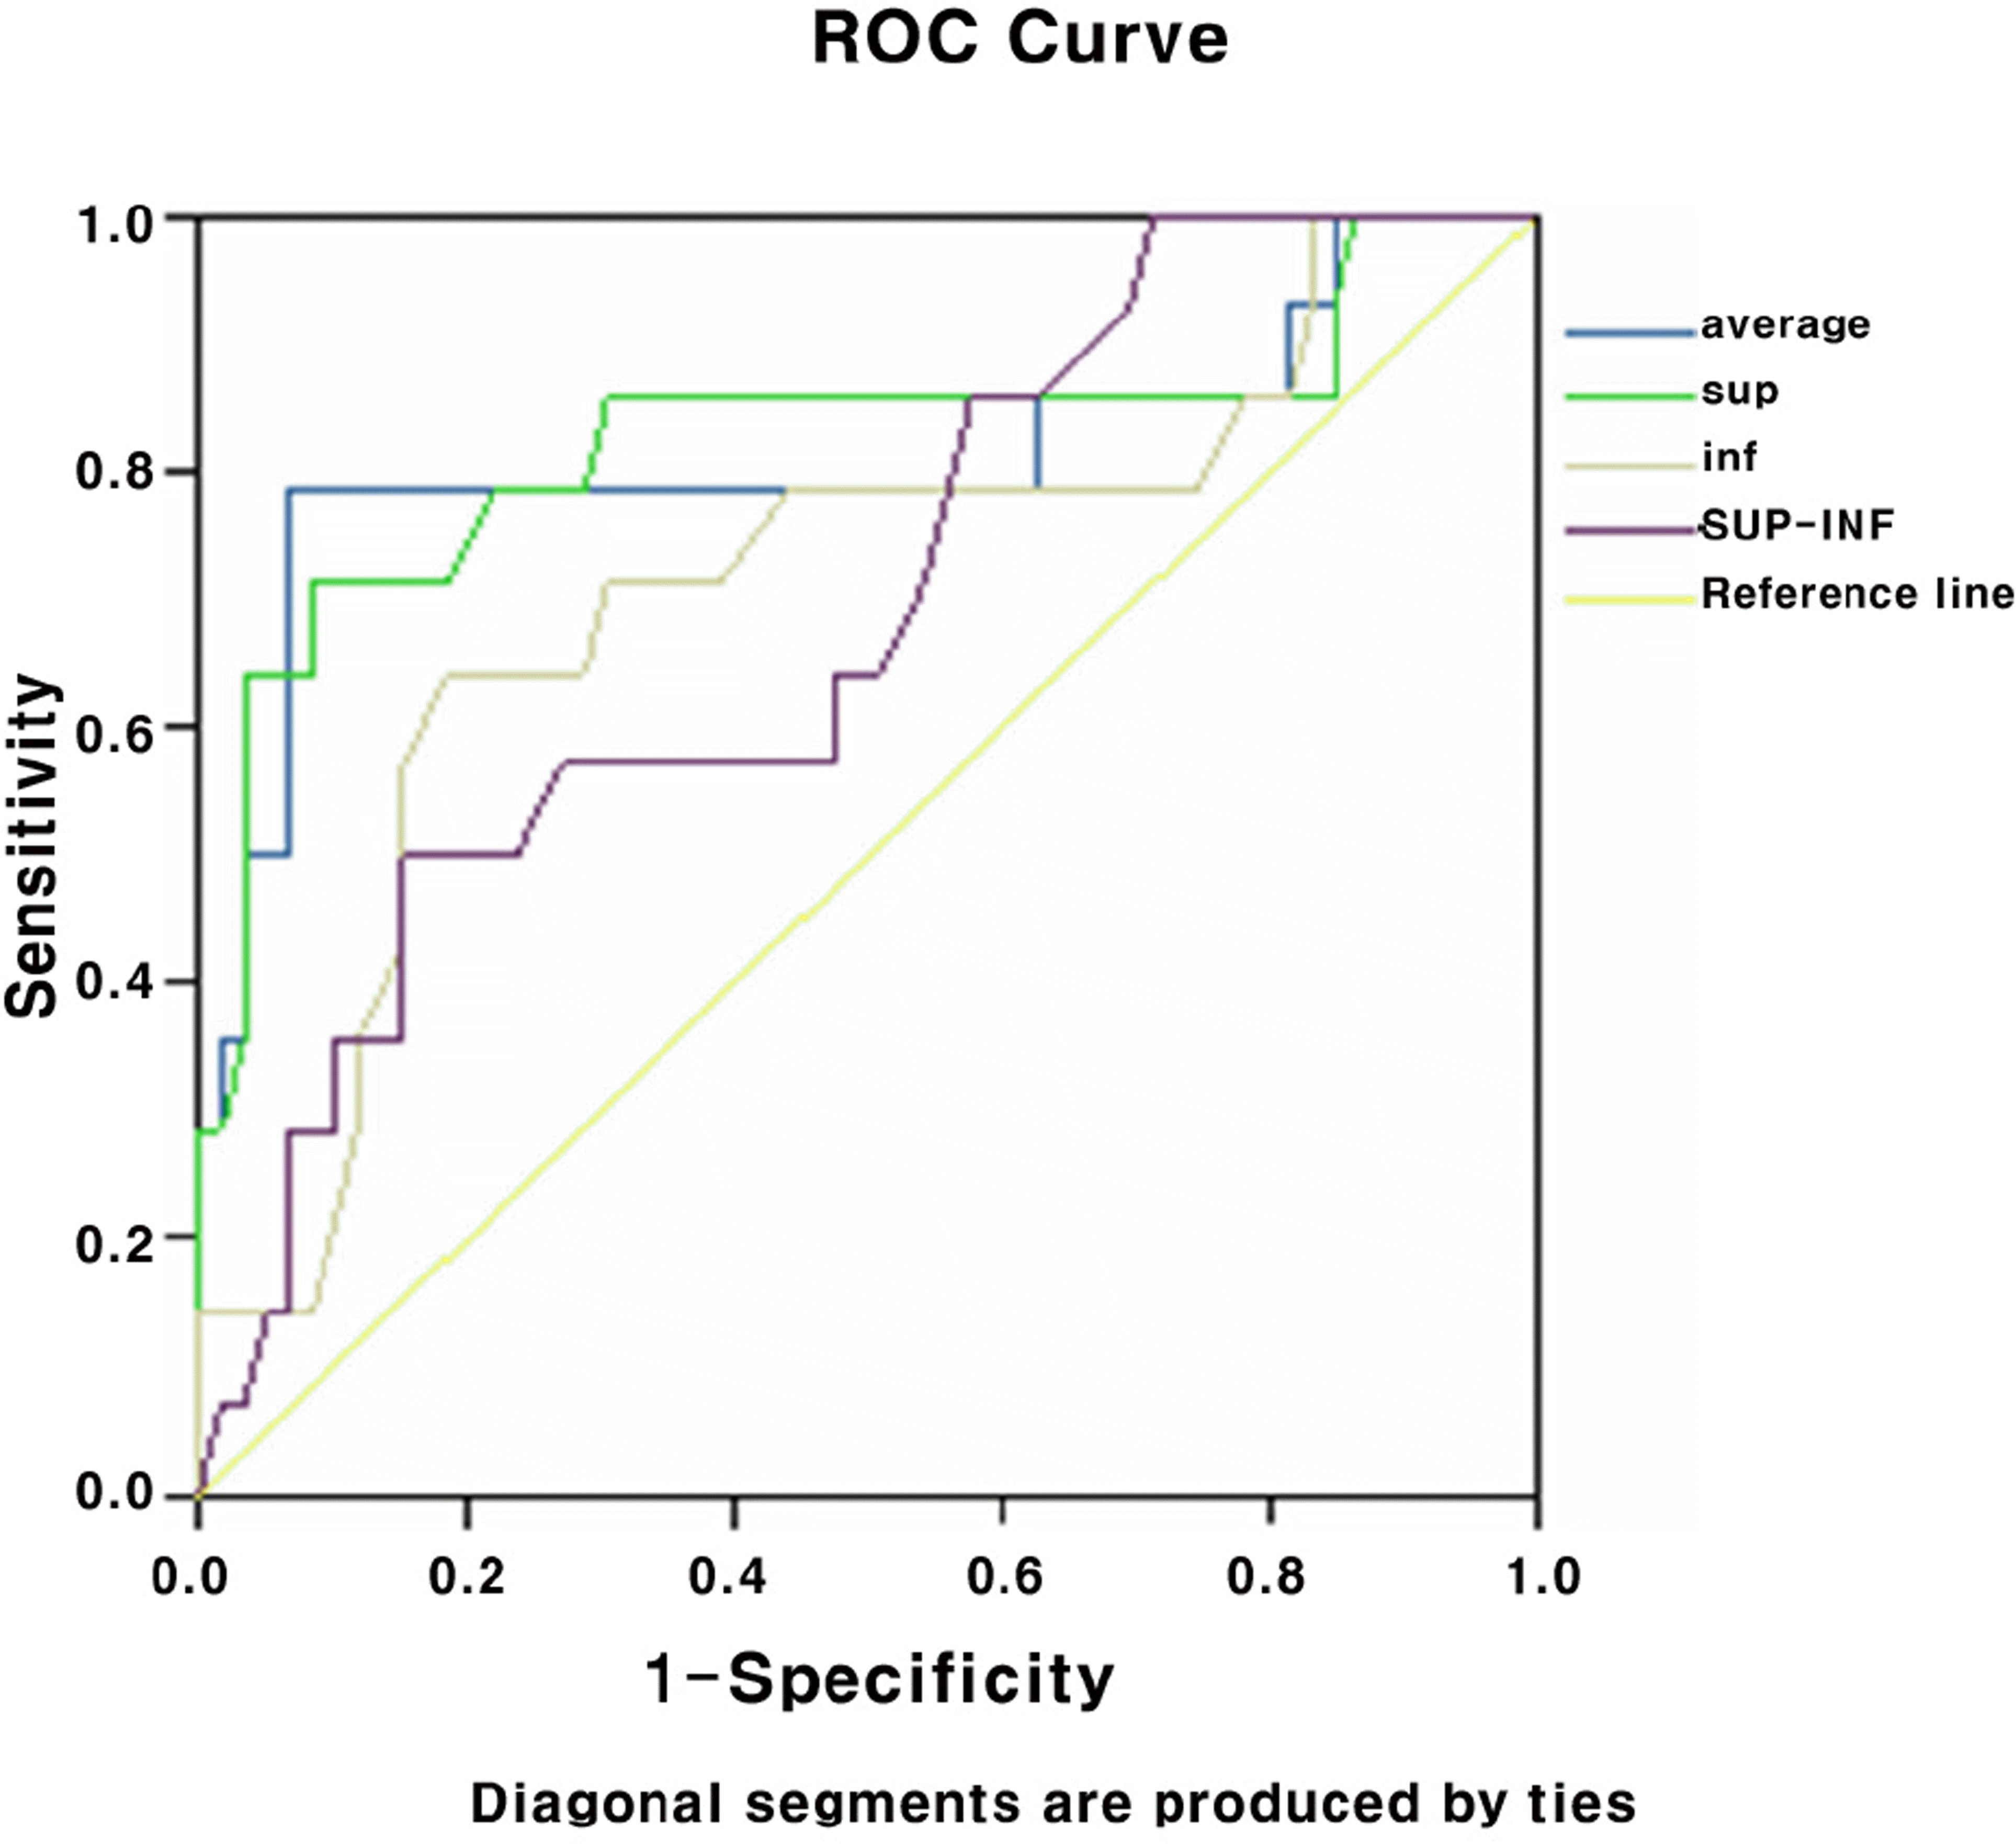
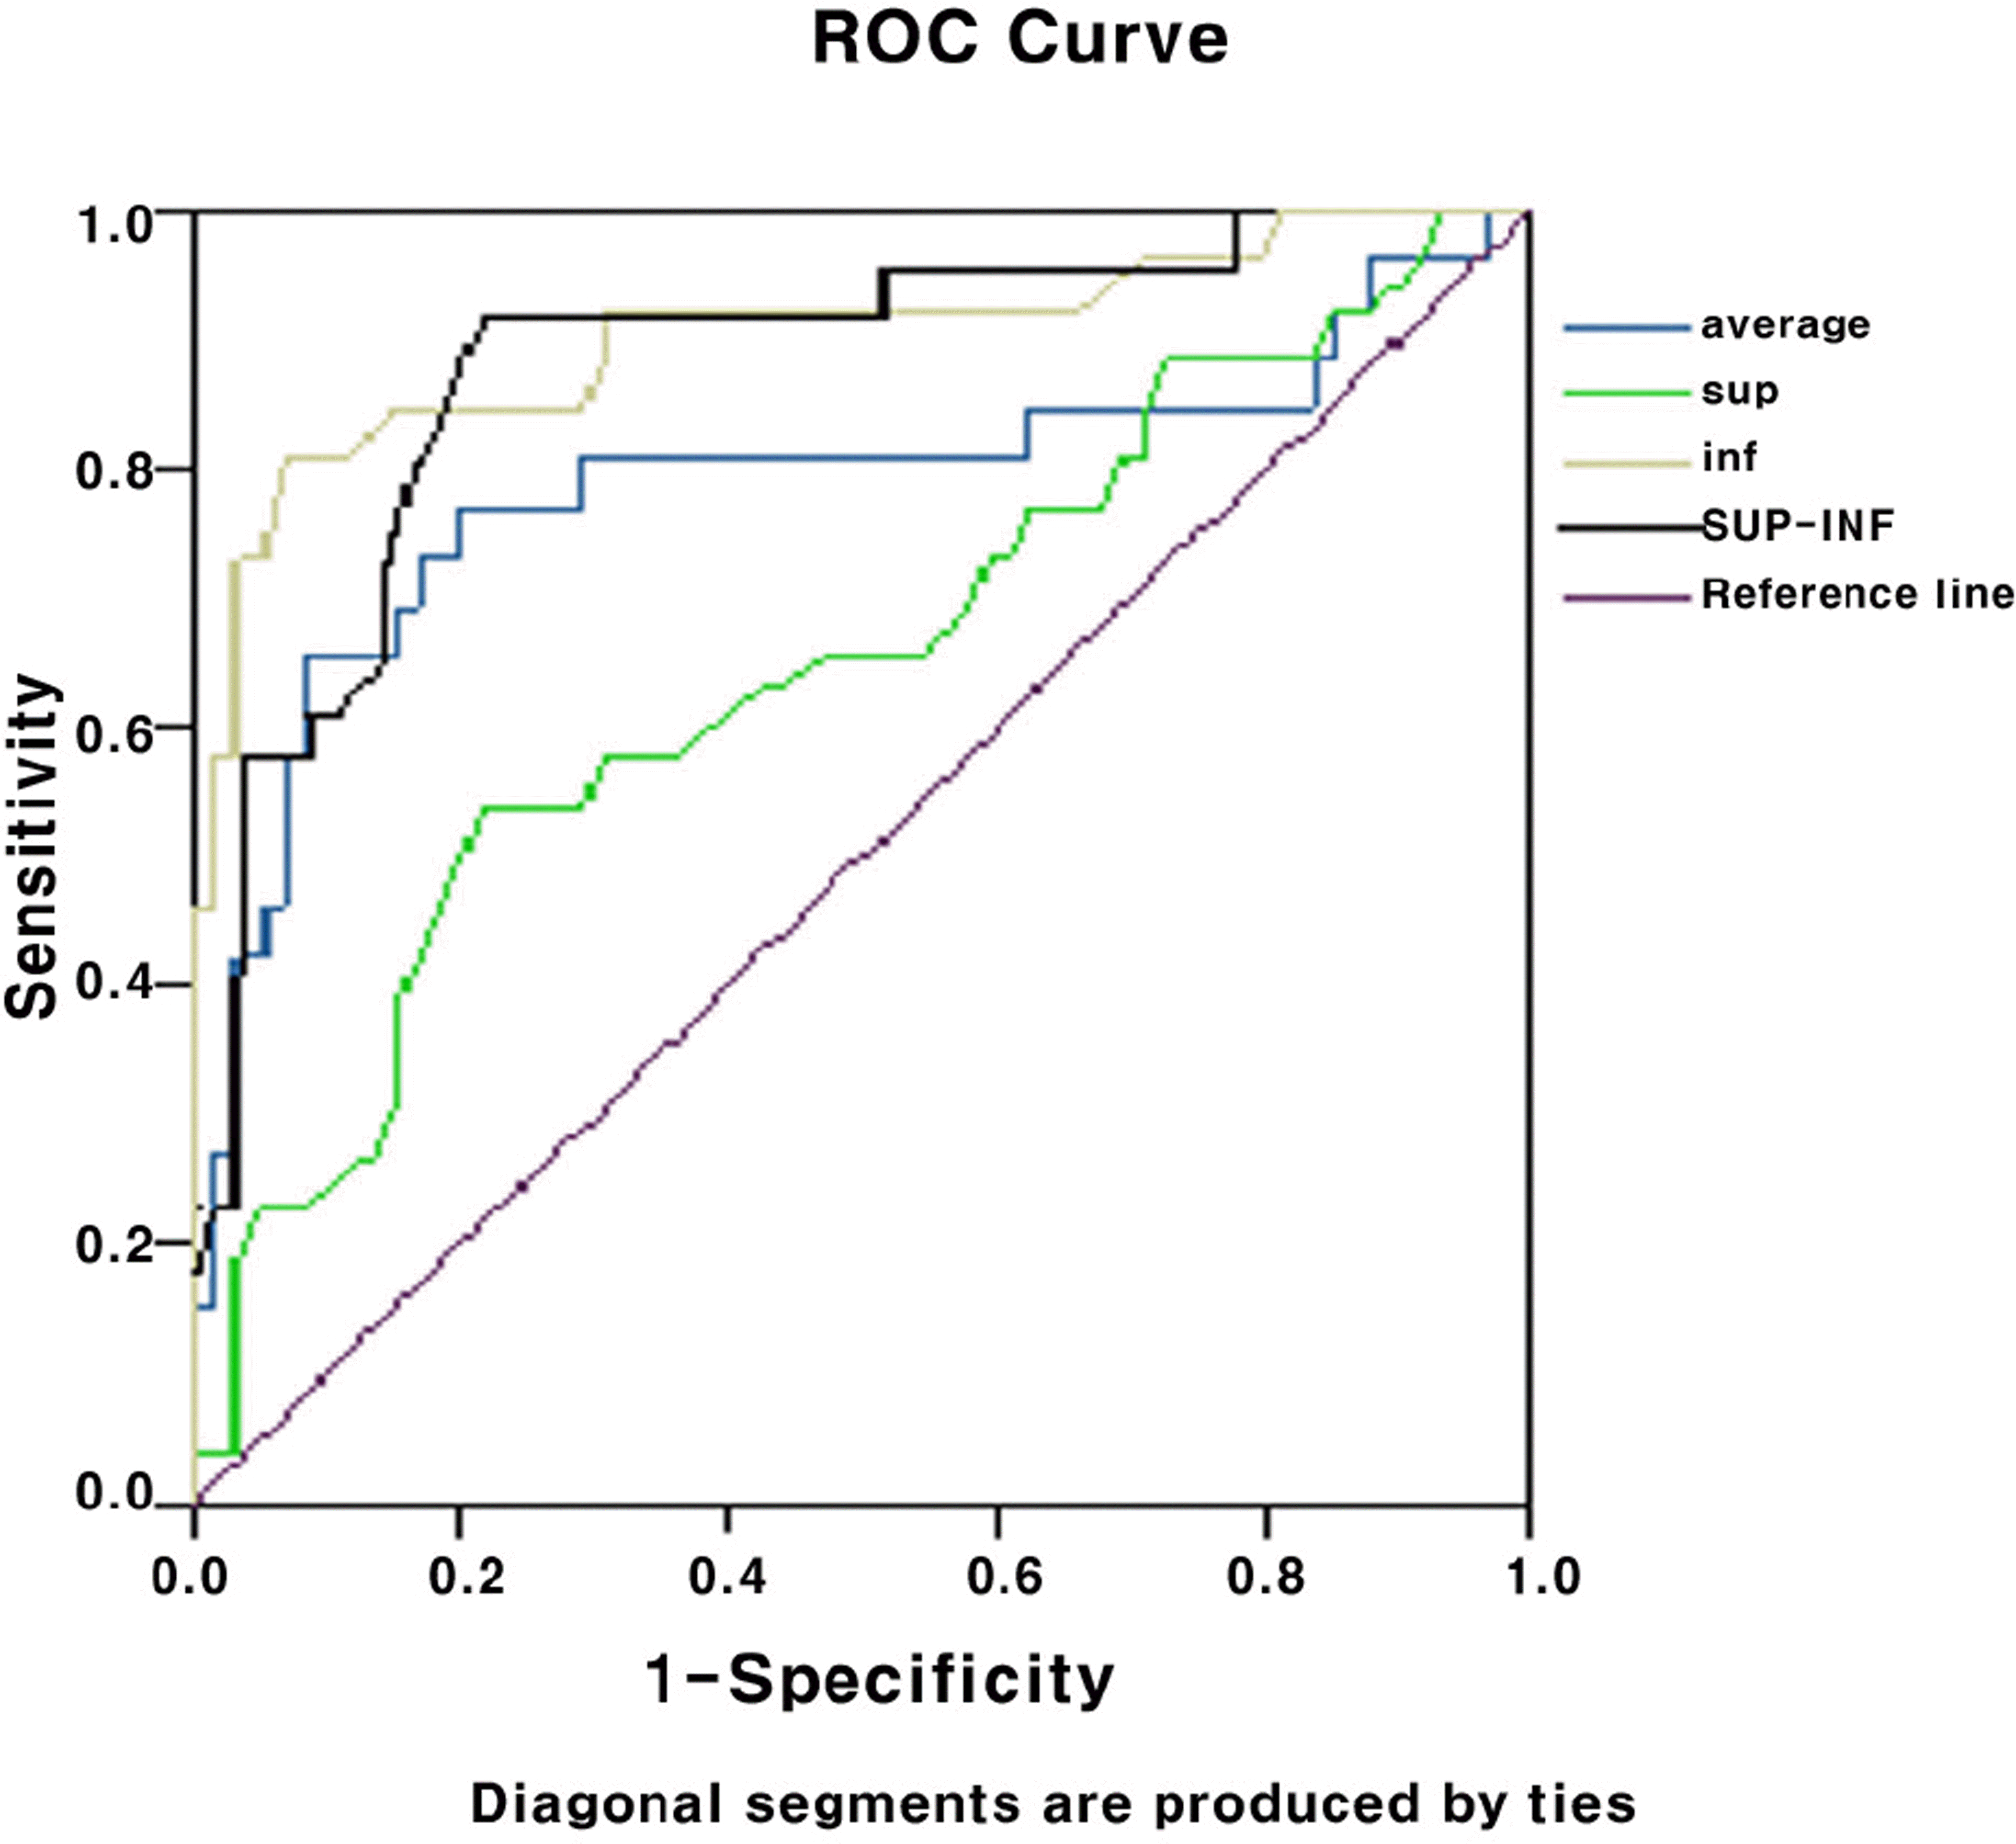
The average thickness of the RNFL showed a statistically significant difference between early glaucoma eyes and normal controls (P<0.05). S-I differences of the superior RNFL defect group and inferior RNFL defect group in preperimetric patients and in early perimetric patients were -20.5±16.4 µm and 15.0±14.2 µm, -24.0±17.2 µm and 18.4±16.7 µm, respectively, which were significantly greater than that of the normal control group (-8.2±17.1 µm). AUROC of S-I difference in the superior and inferior defect groups of preperimetric patients were 0.691, 0.872, respectively.
Go to : 
References
1. Quigley HA, Addicks EM, Green WR. Optic nerve damage in human glaucoma. III:quantitiative correlation of nerve fiber loss and visual field defect in glaucoma, ischemic neuropathy, papilledema, and toxic neuropathy. Arch Ophthalmol. 1982; 100:135–46.
2. Quigley HA, Dunkelberger GR, Green WR. Retinal ganglion cell atrophy correlated with automated perimetry in human eyes with glaucoma. Am J Ophthalmol. 1989; 107:453–64.

3. Kerrigan-Baumrind LA, Quigley HA, Pease ME. . Number of ganglion cells in glaucoma eyes compared with threshold visual field tests in the same persons. Invest Ophthalmol Vis Sci. 2000; 41:741–8.
4. Greaney MJ, Hoffman DC, Garway-Heath DF. . Comparison of optic nerve imaging methods to distinguish normal eyes from those with glaucoma. Invest Ophthlamol Vis Sci. 2002; 43:140–5.
5. Bagga H, Feuer WJ, Greenfield DS. Detection of psychophysical and structural injury in eyes with glaucomatous optic neuropathy and normal standard automated perimetry. Arch Ophthalmol. 2006; 124:169–76.

6. Kwok HM, Vincent WL, Kwok FS. Retinal nerve fiber layer measurement by optical coherence tomography in glaucoma suspects with short-wavelength perimetry abnormalities. J Glaucoma. 2003; 12:45–9.
7. Quigley HA, Dunkelberger GR, Green WR. Retinal ganglion cell atrophy correlated with automated perimetry in human eyes with glaucoma. Am J Ophthalmol. 1989; 107:453–64.

8. Chi QM, Tomita G, Inazumi K. . Evaluation of the effect of aging on the retinal nerve fiber layer thickness using scanning laser polarimetry. J Glaucoma. 1995; 406:644–9.

9. Williams ZY, Schuman JS, Gamell L. . Optical coherence tomography measurement of nerve fiber layer thickness and the likelihood of a visual field defect. Am J Ophthalmol. 2002; 134:538–46.
10. Da pozzo S, Iacono P, Marchesan R. . The effect of aging on retinal nerve fibre layer thickness: an evaluation by scanning laser polarimetry with variable corneal compensation. Acta Ophthalmol Scand. 2006; 84:375–9.
11. Anderson DR. Automated static perimetry. 1992. 1st ed. St. Louis: Mosby Year Book Inc;p. 80.
12. Airaksinen PJ, Drance SM, Douglas GR. . Diffuse and localized nerve fiber loss in glaucoma. Am J Ophthalmol. 1984; 98:566–71.

13. Sommer A, Katz J, Quigley HA. . Clinically detectable nerve fiber atrophy precedes the onset of glaucomatous field loss. Arch Ophthalmol. 1991; 109:77–83.

14. Johnson CA, Sample PA, Zangwill LM. . Structure and Function Evaluation (SAFE):II. Comparison of optic disc and visual field characteristics. Am J Ophthalmol. 2003; 135:148–54.
15. Hwang JM, Kim TW, Park KH. . Correlation between topographic profiles of localized retinal nerve fiber layer defects as determined by optical coherence tomography and red-free fundus photography. J Glaucoma. 2006; 15:223–8.

16. Kim TW, Park KH, Kim DM. . Ability of Stratus OCT to identify localized retinal nerve fiber layer defects in patients with normal standard automated perimetry results. Invest Ophthalmol Vis Sci. 2007; 48:1635–41.

17. Badlani V, Shahidi M, Shakoor A. . Nerve fiber layer thickness in glaucoma patients with asymmetric hemifield visual field loss. J Glaucoma. 2006; 15:275–80.

18. Kim JG, Ko MK, Choe JK. Neuroretinal rim area and pattern of neuroretinal rim loss in glaucomatous optic disc. J Korea Ophthalmol Soc. 1994; 35:565–71.
19. Budenz DL, Michael A, Chang RT. . Sensitivity and specificity of the stratus OCT for perimetric glaucoma. Ophthalmology. 2005; 112:3–9.
Go to : 
 | Figure 1.ROC (receiver operator characteristic) curve of the each parameter in the superior RNFL defect group. |
Table 1.
Characteristics in each group
|
Preperimetric glaucoma |
Early perimetric glaucoma |
Control | p-value | |||
|---|---|---|---|---|---|---|
| Sup* | Inf* | Sup* | Inf* | |||
| Number (eye) | 14 | 26 | 21 | 27 | 59 | |
| Sex (M/F) | 7/7 | 14/12 | 11/10 | 15/12 | 29/30 | |
| Age (year) | 54±9.1 | 48.2±14 | 54.2±16.5 | 52.2±14.3 | 47.6±9.1 | 0.115 |
| SE†(D) | -0.97±2.9 | -1.9±3.1 | -1.9±2.3 | -1.2±2.9 | -0.66±1.2 | 0.065 |
Table 2.
RNFL thickness of preperimetric glaucoma eyes and control eyes
| Sup* | p-value† | Inf* | p-value† | Control | |
|---|---|---|---|---|---|
| Avg (µm) | 96.8±10.9 | 0.000 | 98.9±11.3 | 0.000 | 109.9±7.4 |
| Sup (µm) | 112.8±19.3 | 0.000 | 128.2±15.2 | 0.021 | 136.2±14.0 |
| Inf (µm) | 133.3±15.5 | 0.008 | 113.2±18.3 | 0.000 | 144.2±12.9 |
| Sup-Inf (µm) | -20.5±16.4 | 0.017 | 15.0±14.2 | 0.000 | -8.2±17.1 |
Table 3.
RNFL thickness of early perimetric glaucoma eyes and control eyes
| Sup* | p-value† | Inf* | p-value† | Control | |
|---|---|---|---|---|---|
| Avg (µm) | 87.3±12.3 | 0.000 | 91.1±11.6 | 0.000 | 109.9±7.4 |
| Sup (µm) | 94.1±18.6 | 0.000 | 119.6±16.8 | 0.000 | 136.2±14.0 |
| Inf (µm) | 118.1±21.8 | 0.000 | 101.2±18.8 | 0.000 | 144.2±12.9 |
| Sup-Inf (µm) | -24.0±17.2 | 0.000 | 18.4±16.7 | 0.000 | -8.2±17.1 |
Table 4.
Statistical analysis of RNFL thickness between preperimetric and early perimetric glaucoma according to the location of RNFL defect
| P-value | Sup* | Inf† |
|---|---|---|
| Avg | 0.025 | 0.017 |
| Sup | 0.007 | 0.057 |
| Inf | 0.022 | 0.023 |
| Sup-Inf | 0.547 | 0.433 |
Table 5.
Area under ROC, sensitivity, specificity and cut-off value to separate normal subjects from patients with preperimetric glaucoma


 PDF
PDF ePub
ePub Citation
 Print
Print


 XML Download