Abstract
Purpose
To assess macular function before and after vitrectomy and membrane removal in epiretinal membranes by means of multifocal electroretinogram (mfERG).
Methods
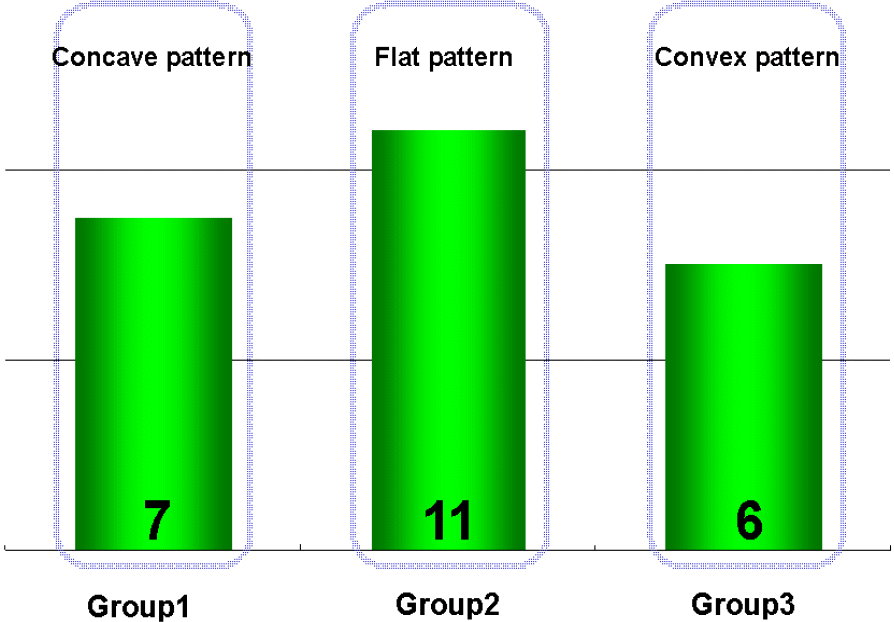
The mfERGs (RETIscan®, Roland, Germany) of 28 consecutive patients (28 eyes) with idiopathic epiretinal membranes were recorded before epiretinal membrane surgery and 3 to 6 months after surgery. The average retinal response density and implicit time of each local response were estimated as anatomic macular areas corresponding roughly to 5 rings. Preoperative and postoperative responses of mfERG were compared. The correlation of the change of retinal response density and postoperative macular configuration on optical coherent tomography (OCT) was statistically analyzed.
Results
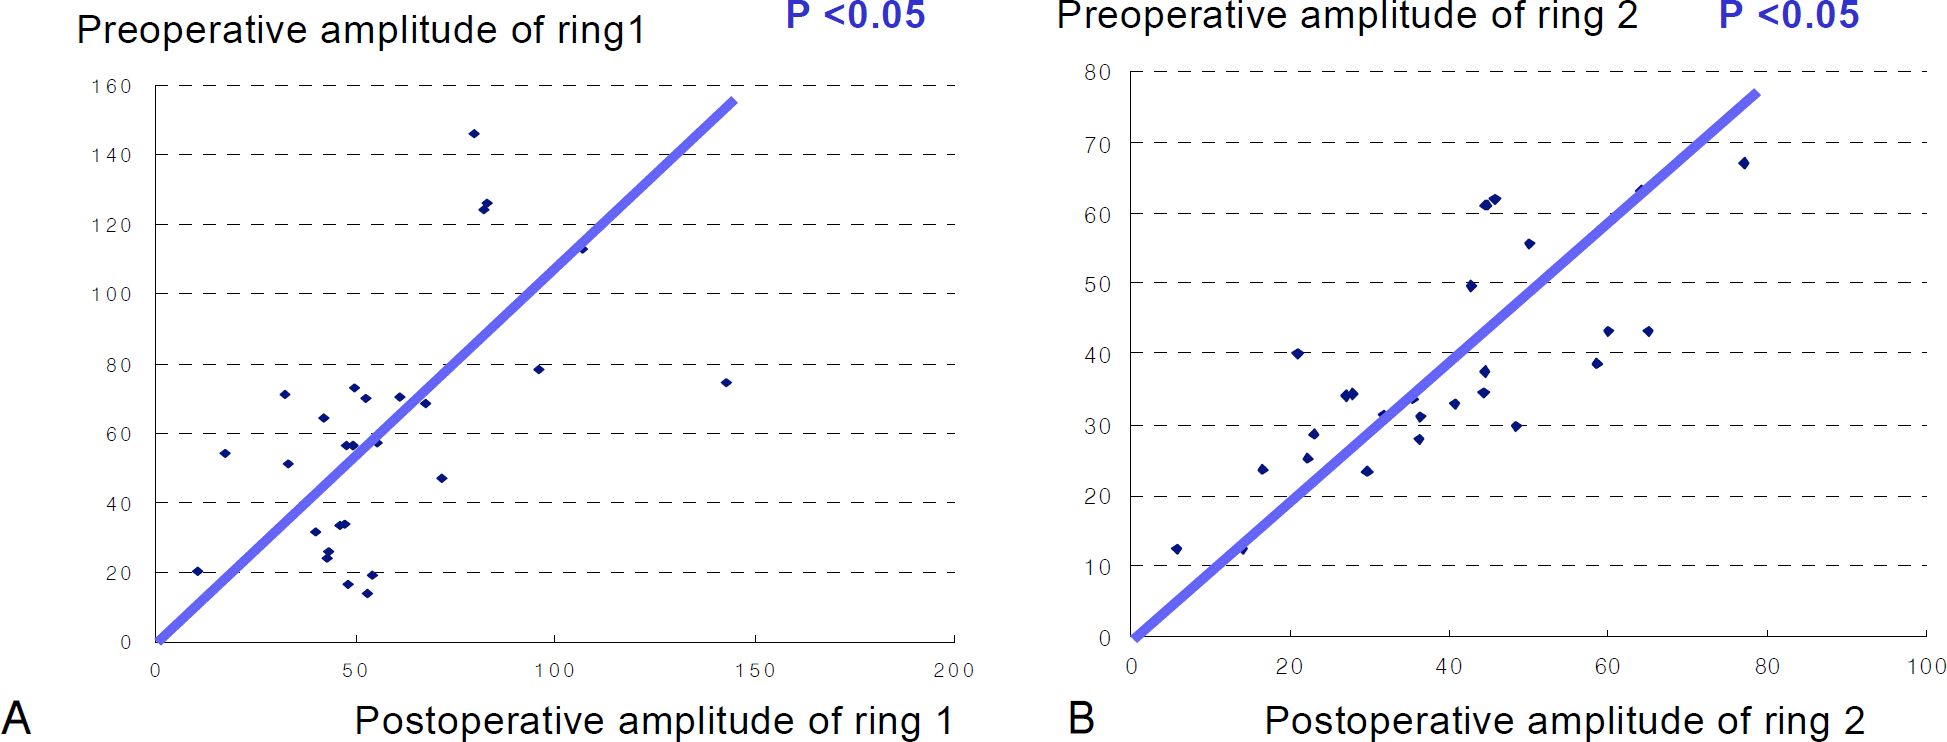
The postoperative value of P1 amplitude and implicit time were not statistically correlated with the preoperative value (p>0.05). There were no significant correlations between the changes of rings 1 and 2 with regard to the retinal response density of the mfERGs and visual acuity. There was no significant correlation between the change of retinal response density and postoperative macular configuration according to OCT.
Go to : 
References
1. Wise GN. Clinical features of idiopathic preretinal macular fibrosis. Am J Ophthalmol. 1975; 79:349–7.

2. Choi YK, Yoo JS, Kim MH. Result of surgery for epiretinal membrane and their recurrence. J Korean Ophthalmol Soc. 2000; 41:2357–62.
4. Hillenkamp J, Saikia P, Gora F, et al. Macular function and morphology after peeling of idiopathic epiretinal membrane with and without the assistance of indocyanine green. Br J Ophthalmol. 2005; 89:437–43.

5. Fish GE, Birch DG. The focal electroretinogram in the clinical assessment of macular disease. Ophthalmology. 1989; 96:109–14.

6. Moschos M, Apostolopoulos M, Ladas J, et al. Multifocal ERG changes before and after macular hole surgery. Doc Ophthalmol. 2001; 102:31–40.
7. Kondo M, Miyake Y, Horiguchi M, et al. Clinical evaluation of multifocal electroretinogram. Invest Ophthalmol Vis Sci. 1995; 36:2146–56.
8. Ohn YH, Ahn YS. Clinical applications of multifocal electroretinography (mfERG). J Korean Ophthalmol Soc. 2002; 43:1901–17.
9. Moschos M, Apostolopoulos M, Ladas J, et al. Assessment of macular function by multifocal electroretinogram before and after epimacular membrane surgery. Retina. 2001; 21:590–5.

10. Nagatomo A, Nao-i N, Maruiwa F, et al. Multifocal electroretinograms in normal subjects. Jpn J Ophthalmol. 1998; 42:129–35.

11. Hood DC. Assessing retinal function with the multifocal technique. Pro Retin Eye Res. 2000; 19:607–46.

12. Li D, Horiquchi M, Kishi S. Tomographic and multifocal electroretinographic features of idiopathic epimacular membranes. Arch Ophthalmol. 2004; 122:1462–7.
13. Lee YD, Bae SR. Normal values of positive wave in the multifocal electroretinography in Korean. J Korean Ophthalmol Soc. 2003; 44:850–6.
Go to : 
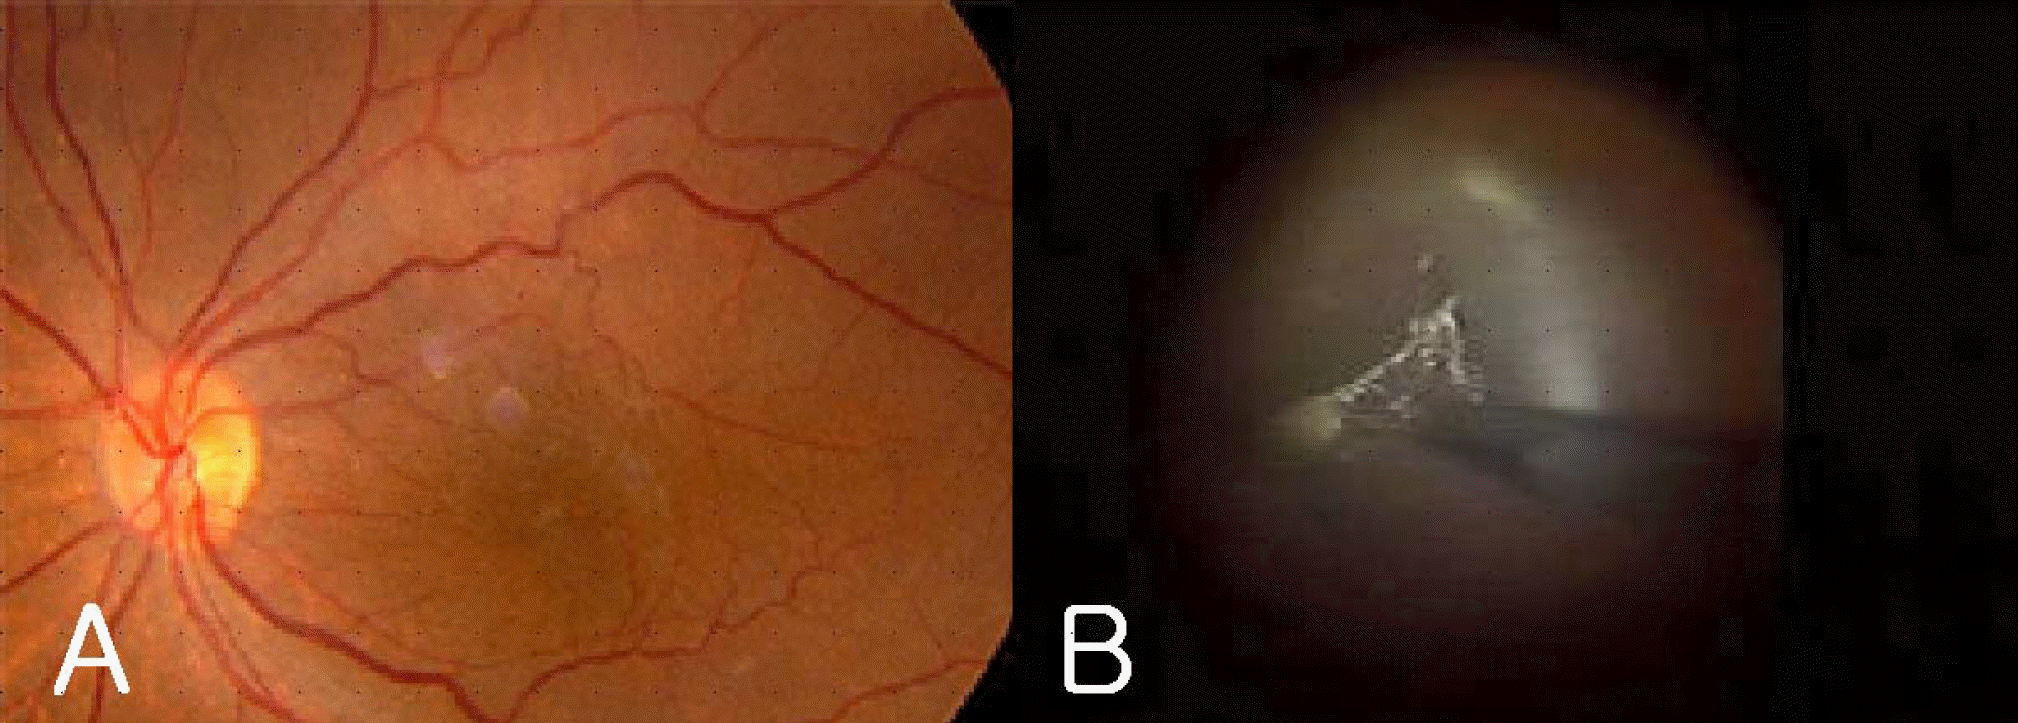
 | Figure 1.Preoperative color fundus photograph showed thin macular epiretinal membrane (A). Internal limiting membrane was peeled off using a microforceps at an area of approximately 3 disc diameters surrounding the fovea (B). |
 | Figure 2.Relationship between preoperative and postoperative (A) amplitude of the ring 1, (B) amplitude of the ring 2. There are significant correlation between the two parameters (p<0.05). |
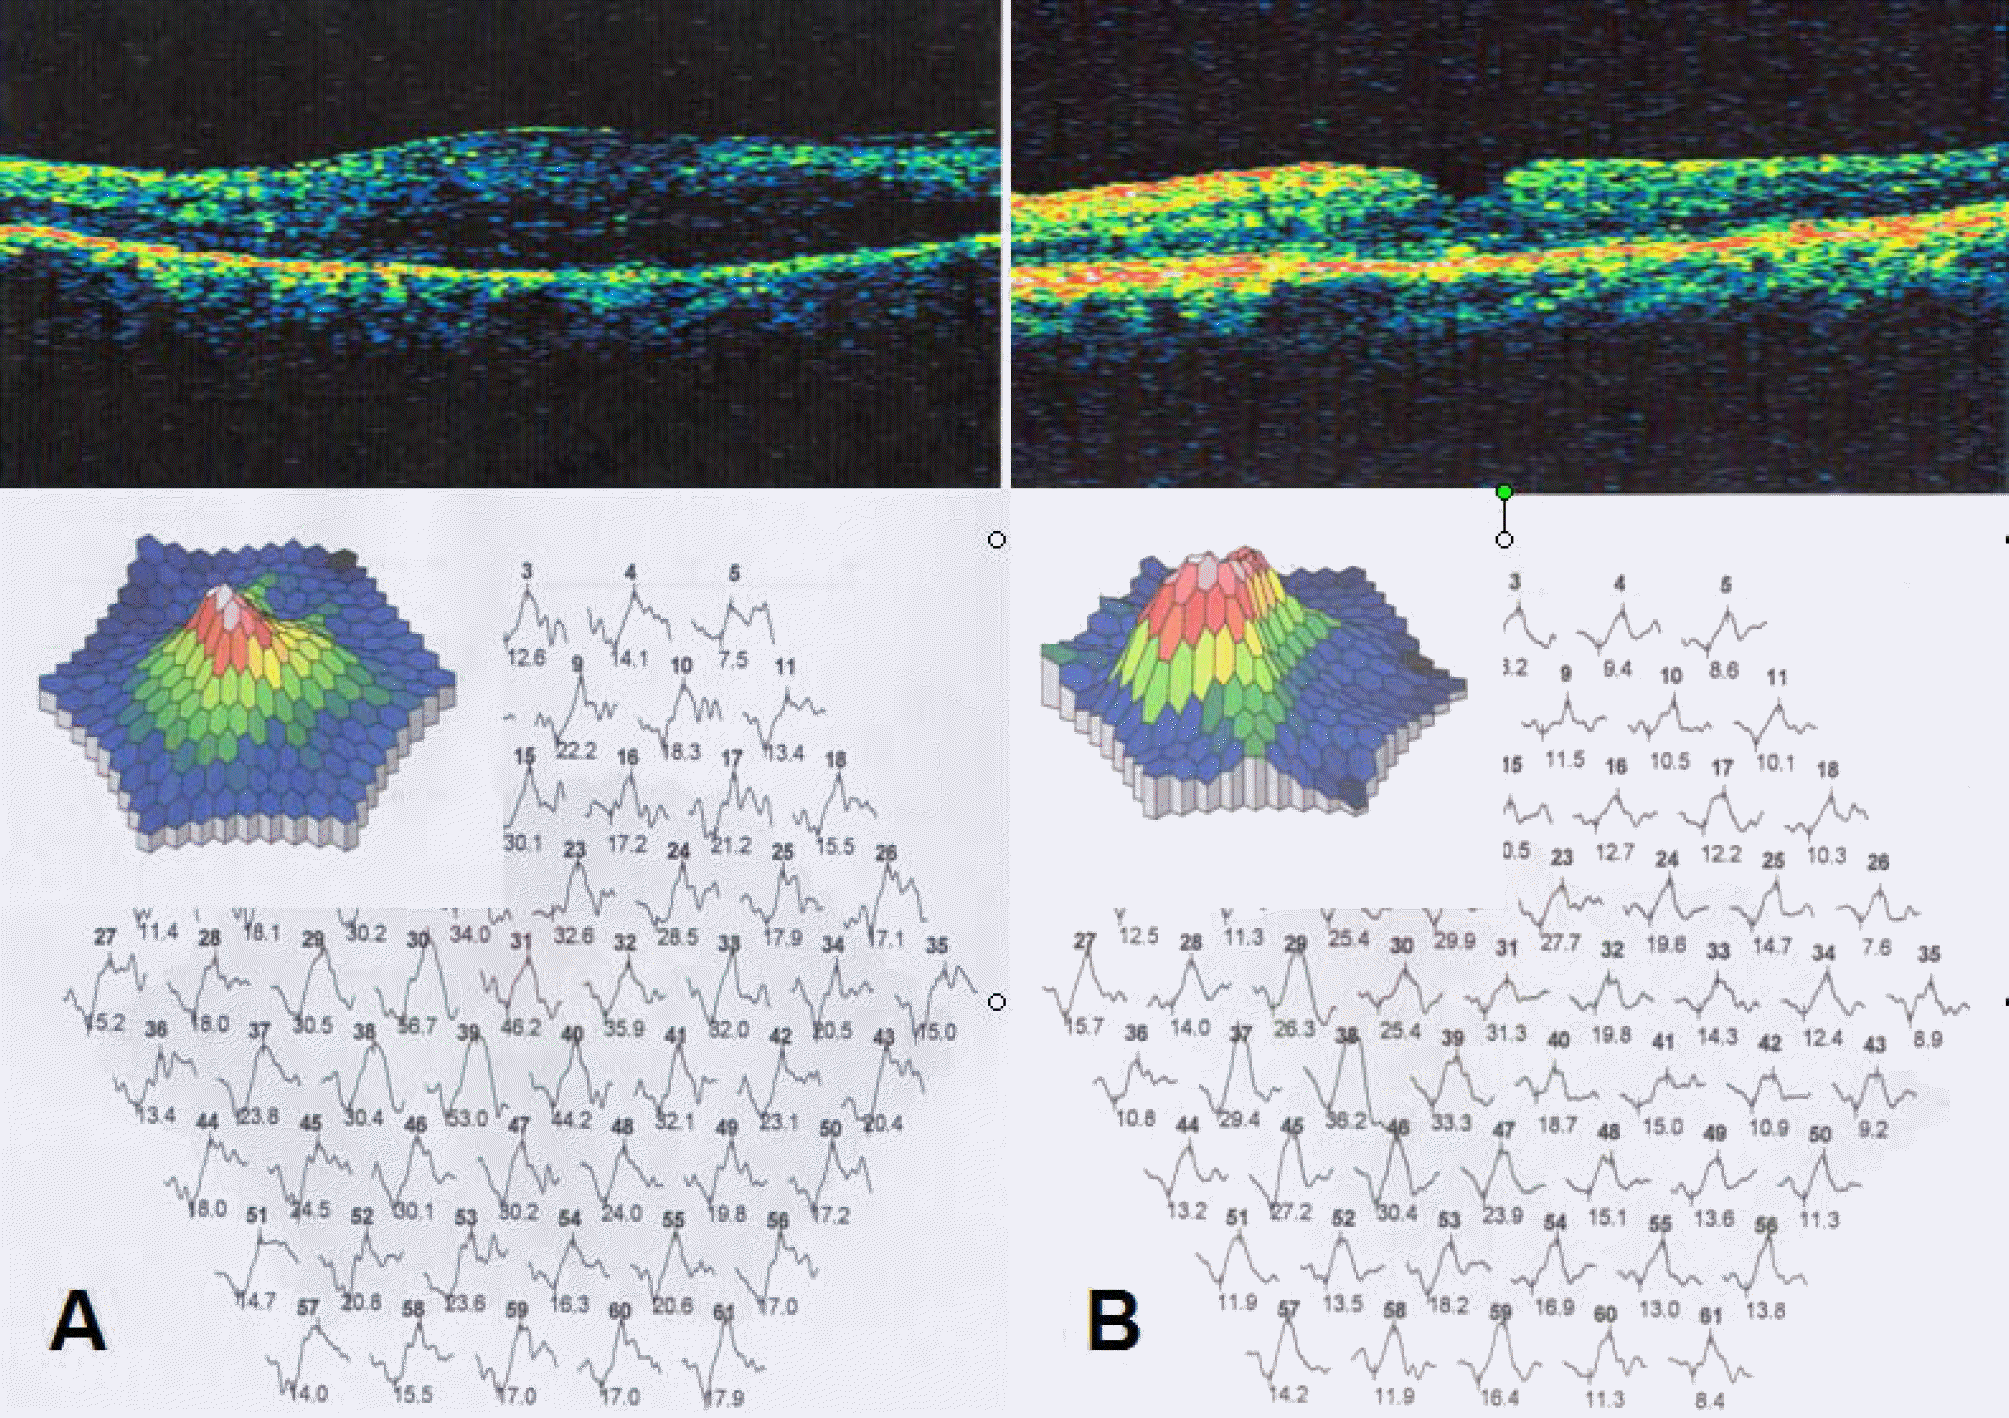
 | Figure 3.Preoperatvie (A) and postoperative (B) OCT (optical coherence tomography) and mfERG (multifocal electroretinogram) findings of a 56-year-old male with epiretinal membrane. |
Table 1.
Distribution of mean age, sex and visual acuity
| Age (years) | 63.12±5.2 |
|---|---|
| M:F (Number of eyes) | 13:15 |
| Preoperative BCVA* (log MAR) | 0.75 |
| Postoperative BCVA* (log MAR) | 0.46 |
| Change of VA†(lines) | 3.0 |
Table 2.
Average amplitude and implicit time of P1 according to the 8 concentric rings
| Preoperative value | Postoperative value | P value* | ||
|---|---|---|---|---|
| Amplitude (nV/deg2) | Ring 1 | 57.41±27.18 | 60.02±34.41 | 0.64 |
| Ring 2 | 39.81±17.07 | 38.40±14.83 | 0.53 | |
| Implicit time (ms) | Ring 1 | 42.22±5.73 | 41.85±5.57 | 0.81 |
| Ring 2 | 41.85±5.57 | 40.94±2.19 | 0.40 |
Table 3.
Mean amplitude and implicit time according to change in visual acuity
|
Change of VA |
≥10 lines |
2∼9 lines |
No change |
Decrease |
P value* | |||||
|---|---|---|---|---|---|---|---|---|---|---|
|
Number of eyes |
7 |
12 |
6 |
3 |
||||||
| Pre† | Post‡ | Pre† | Post‡ | Pre† | Post‡ | Pre† | Post‡ | |||
| Amplitude (nV/deg2) | ring 1 | 38.3 | 38.3 | 72.1 | 73.8 | 45.9 | 61.3 | 65.9 | 71.2 | >0.05 |
| ring 2 | 20.6 | 23.8 | 49.3 | 43.2 | 37.9 | 38.7 | 49.7 | 52.3 | >0.05 | |
| Implicit time (ms) | ring 1 | 41.3 | 38.2 | 44.0 | 42.9 | 40.4 | 43.0 | 40.4 | 43.4 | >0.05 |
| ring 2 | 43.0 | 42.4 | 41.3 | 40.0 | 40.4 | 40.8 | 40.8 | 41.1 | >0.05 | |
Table 4.
Mean amplitude, implicit time according to postoperative OCT finding of the macula
|
Group 1* |
Group 2† |
Group 3‡ |
P value§ | |||||
|---|---|---|---|---|---|---|---|---|
| Number of eyes |
7 |
12 |
6 |
|||||
| Pre∏ | Post# | Pre∏ | Post# | Pre∏ | Post# | |||
| Amplitude (nV/deg2) | ring 1 | 73.4 | 82.7 | 61.8 | 58.7 | 43.3 | 49.3 | >0.05 |
| ring 2 | 49.9 | 46.9 | 38.6 | 39.2 | 30.9 | 32.2 | >0.05 | |
| Implicit time (ms) | ring 1 | 43.6 | 43.3 | 42.2 | 43.1 | 44.0 | 38.8 | >0.05 |
| ring 2 | 41.1 | 40.4 | 40.6 | 41.7 | 43.1 | 39.5 | >0.05 | |
| ring 2 | 41.1 | 40.4 | 40.6 | 41.7 | 43.1 | 39.5 | >0.05 | |


 PDF
PDF ePub
ePub Citation
 Print
Print


 XML Download