Abstract
Purpose
To compare the intraocular pressure-lowering effect and safety between 180° and 90° selective laser trabeculoplasty (SLT).
Methods
From January 2006 to august 2006, in patients with primary open-angle glaucoma and ocular hypertension, SLT was performed 90° to the right eye and 180° to the left eye within the same patient. Intraocular pressure was checked at 1 hour, 1 day, 1 week, 1 month, 3 months, and 6 months after SLT. Anterior chamber reaction and ocular pain was checked at postoperative 1 day. Peripheral anterior synechia was examined at 6 months postoperatively.
Results
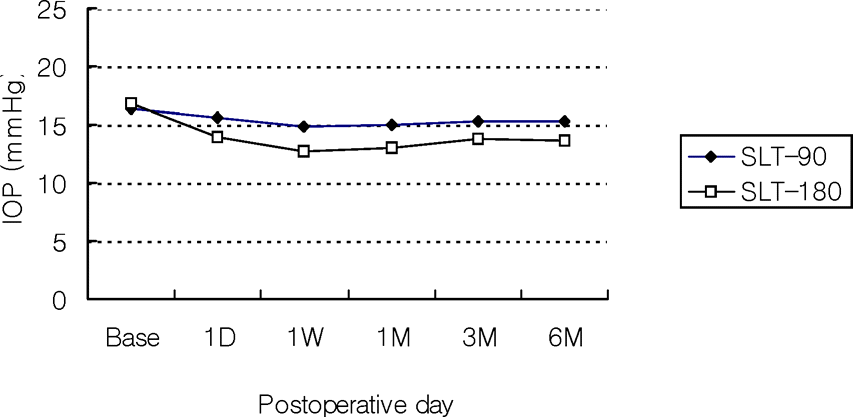
Fourteen patients (28 eyes) of primary open-angle glaucoma and two patients (4 eyes) of ocular hypertension were included. There was no difference of intraocular pressure between 180° group and 90° group preoperatively. However, there were statistically significant differences from postoperative 1 hour (p=0.003), through 1 week (15.6±2.3 mmHg in 90° group, 14.0±2.5 mmHg in 180° group; p=0.000), to 6 months (p=0.001). Thirty-two percent of the 90° group and Seventy-five percent of the 180° group showed successful intraocular pressure decrease. There was a slightly higher complication rate of anterior chamber reactions and transient intraocular pressure spikes in the 180° group.
Go to : 
References
1. Latina MA, Park C. Selective targeting of trabecular meshwork cells: in vitro studies of pulsed and CW laser interactions. Exp Eye Res. 1995; 60:359–72.

2. Latina MA, Sibayan SA, Shin DH, et al. Q-switched 532-nm Nd:YAG laser trabeculoplasty (selective laser trabeculoplasty): a multicenter, pilot, clinical study. Ophthalmology. 1998; 105:2082–8.
3. Kramer TR, Noecker RJ. Comparison of the morphologic changes after selective laser trabeculoplasty and argon laser trabeculoplasty in human eye bank eyes. Ophthalmology. 2001; 108:773–9.

4. Latina MA, DeLeon JM. Selective laser trabeculoplasty. Ophthalmol Clin North Am. 2005; 18:409–19.

5. Stein JD, Challa P. Mechanisms of action and efficacy of argon laser trabeculoplasty and selective laser trabeculoplasty. Curr Opin Ophthalmol. 2007; 18:140–5.

6. Jurych MS, Chopra V, Banitt MR, et al. Comparison of long-term outcomes of selective laser trabeculoplasty versus argon laser trabeculoplasty in open-angle glaucoma. Ophthalmology. 2004; 111:1853–9.

7. Weinand FS, Althen F. Long-term clinical results of selective laser trabeculoplasty in the treatment of primary open angle glaucoma. Eur J Ophthalmol. 2006; 16:100–4.

8. Lai JS, Chua JK, Tham CC, Lam DS. Five-year follow up of selective laser trabeculoplasty in Chinese eyes. Clin Experiment Ophthalmol. 2004; 32:368–72.

9. Martinez-de-la-Casa JM, Garcia-Feijoo J, Castillo A, et al. Selective vs argon laser trabeculoplasty: hypotensive efficacy, anterior chamber inflammation, and postoperative pain. Eye. 2004; 18:498–502.

10. Kajiya S, Hayakawa K, Sawaguchi S. Clinical results of selective laser trabeculoplasty. Jpn J Ophthalmol. 2000; 104:160–4.

11. Kim JS, Lee YG, Hong YJ. Q-switched, frequency doubled Nd:YAG laser trabeculoplasty. J Korean Ophthalmol Soc. 1999; 40:2591–6.
12. Lee HY, Baek NH, Moon JI. Comparison of short-term outcomes of argon laser versus selective laser trabeculoplasty in open-angle glaucoma. J Korean Ophthalmol Soc. 2005; 46:2004–9.
13. Suhk HJ, Kook MS. Three year follow up of laser trabeculoplasty using Q-switched frequency doubled Nd:YAG laser. J Korean Ophthalmol Soc. 2003; 44:93–9.
14. Chen E, Golchin S, Blomdahl S. A comparison between 90° and 180° selective laser trabeculoplasty. J Glaucoma. 2004; 13:62–5.

Go to : 
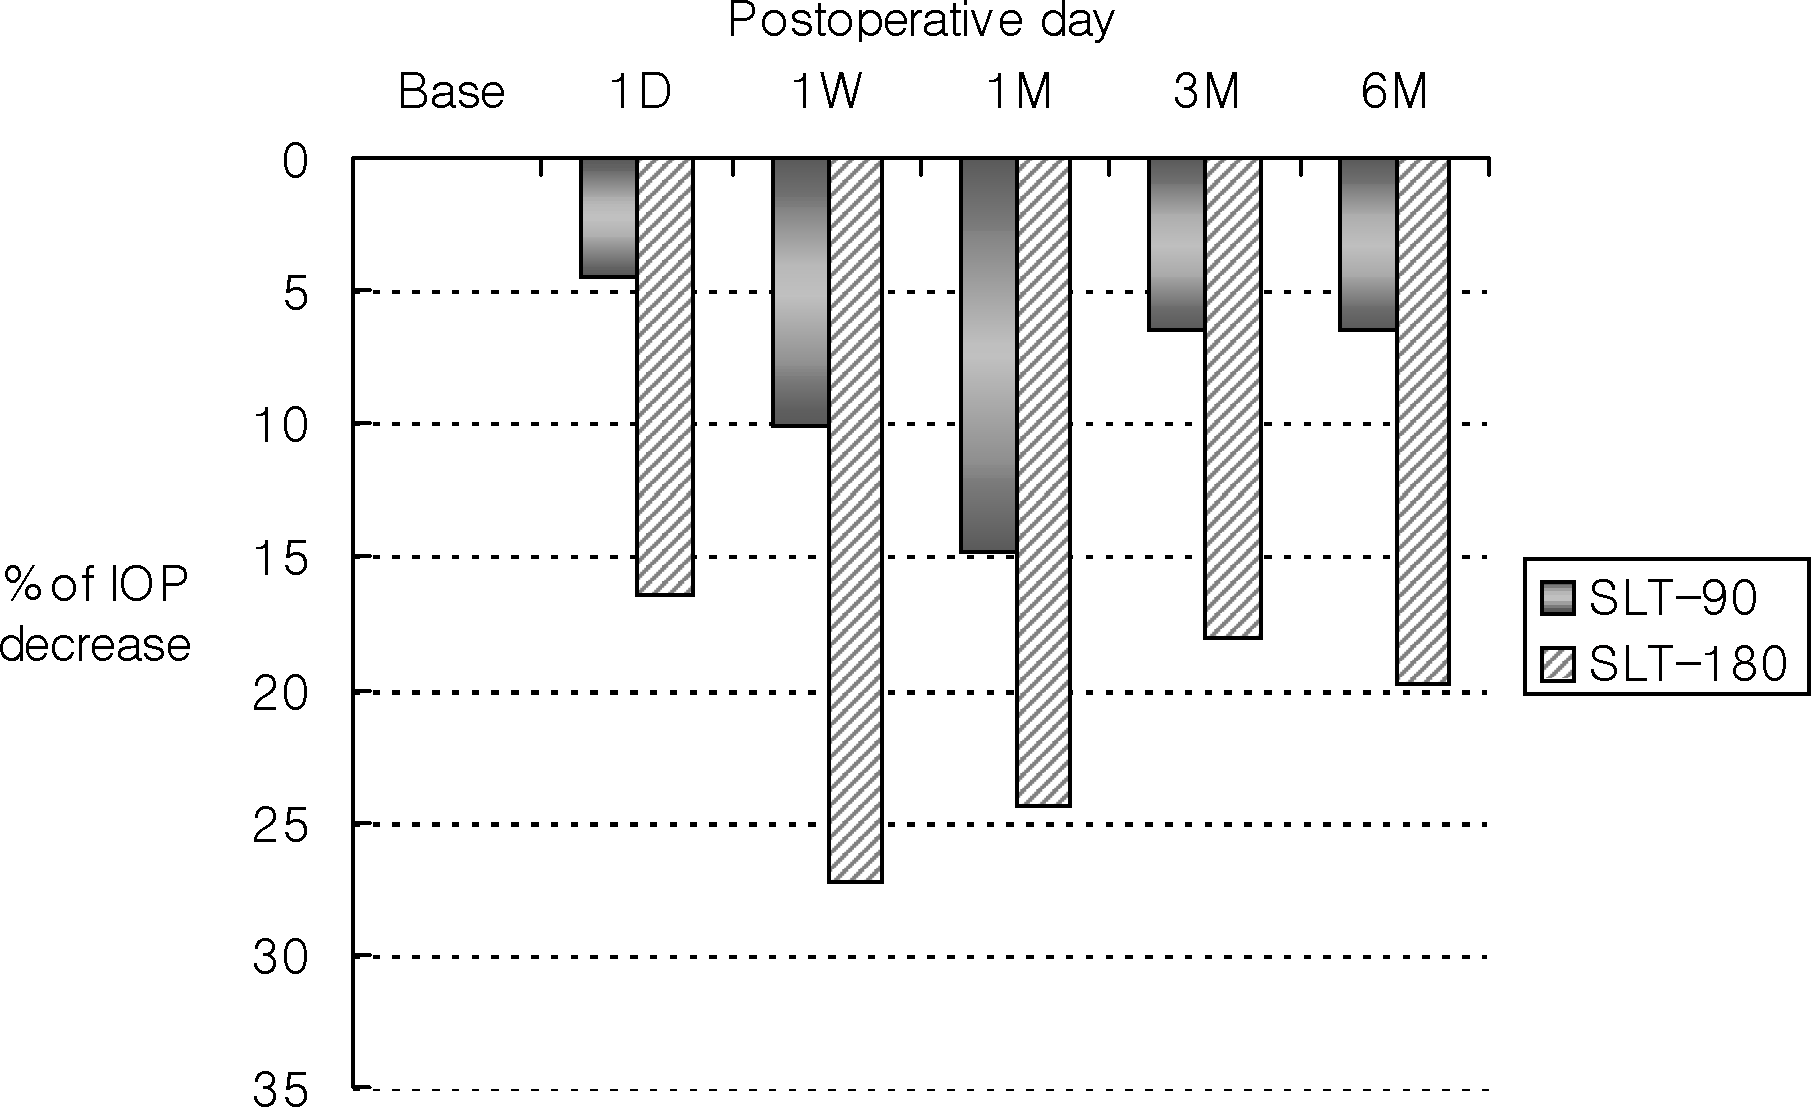
 | Figure 2.Mean reduction of intraocular pressure from baseline intraocular pressure (percentage) after selective laser trabeculoplasty. |
Table 1.
Patient demographics
| Age (mean±SD) (years) | 52.7±17.0 |
|---|---|
| Gender | |
| Male | 7 |
| Female | 9 |
| Diagnosis | |
| POAG* | 14 |
| OHT† | 2 |
| No. of Medication (mean±SD) | 1.8±0.8 |
| Baseline IOP‡ (mean±SD) (mmHg) | |
| OD | 16.3±1.5§ |
| OS | 16.8±1.8 |
Table 2.
Mean changes in intraocular pressure after selective laser trabeculoplasty
| Baseline | 1 d | 1 wk | 1 mo | 3 mos | 6 mos | ||
|---|---|---|---|---|---|---|---|
| 90° group | IOP* (mmHg) | 16.3± 1.5 | 15.6±2.3 | 14.8±3.0 | 14.2±3.3 | 15.3±3.0 | 15.3±3.1 |
| % of decrease† | 4.5 | 10.1 | 14.8 | 6.5 | 6.5 | ||
| 180° group | IOP (mmHg) | 16.8±1.8 | 14.0±2.5 | 12.8±3.6 | 13.1±2.7 | 13.8±3.0 | 13.6±3.1 |
| % of decrease† | 16.4 | 27.3 | 24.4 | 18.1 | 19.8 | ||
| p‡ | >0.05 | 0.004 | 0.001 | 0.003 | 0.005 | 0.004 |
Table 3.
Success rate of selective laser trabeculoplasty (No. of eyes)
| Success |
Fail |
||
|---|---|---|---|
| No Change | IOP* Increase | ||
| 90° group | 32% (5) | 68% (11) | |
| 56% (9) | 12% (2) | ||
| 180° group | 75% (12) | 25% (4) | |
| 19% (3) | 6% (1) | ||


 PDF
PDF ePub
ePub Citation
 Print
Print


 XML Download