

 PDF
PDF ePub
ePub Citation
 Print
Print


Abstract
Purpose
The objective of this study is to compare optic nerve head (ONH) analysis parameters and retinal nerve fiber layer (RNFL) thickness parameters as measured by optical coherence tomography (OCT) among age-matched normal eyes, glaucoma-suspect eyes, and early glaucomatous eyes; and to determine the discriminating parameter best suited to distinguish early glaucoma in age-matched normal eyes and glaucoma- suspect eyes.
Methods
One hundred two normal eyes, 72 glaucoma-suspect eyes, and 85 eyes with early glaucoma that had been submitted to OCT and Humphrey field analysis were enrolled in this study. Optic nerve head analysis values and RNFL thickness values with OCT scans were compared among all groups. Sensitivity and specificity for the detection of early glaucoma were determined with a receiver operating characteristic (ROC) curve.
Results
The best-suited parameters were determined to be from 0.637 to 0.753 in optic nerve head parameters and from 0.506 to 0.759 in RNFL thickness parameters calculated with the area under the ROC curve (AUROC). The average thickness for early glaucomatous eye (0.818) had the widest AUROC among all parameters. The sensitivity and specificity of RNFL thickness parameter were determined to be 49.4% and 93.1%, respectively, at the cut-off value 92.17 pm.
Conclusions
Optic nerve head and RNFL thickness parameters measured with OCT have relatively high sensitivity and specificity for detecting early glaucomatous eyes. Furthermore, they may provide clinically relevant information for the detection of early glaucomatous damage and for monitoring glaucomatous changes.
Go to : 
References
1. Gupta N, Weinerb RN. New definition of glaucoma. Curr Opin Ophthalmol. 1997; 8:38–41.
2. Quigley HA, Miller NR, George T. Clinical evaluation of nerve fiber layer atrophy as a indicator of glaucomatous optic nerve damage. Arch Ophthalmol. 1980; 98:1564–71.
3. Tuulonen A, Lehtola J, Airaksinen PJ. Nerve fiber layer defects with normal visual fields. Ophthalmology. 1993; 110:587–98.

4. Quigley HA, Dunkelberg GR, Green WR. Retinal ganglion cell atrophy correlated with automated perimetry in human eyes with glaucoma. Am J Ophthalmol. 1989; 107:453–64.
5. Sommer A, Katz J, Quigley HA, et al. Clinically detectable nerve fiber layer atrophy precedes the onset of glaucomatous field loss. Arch Ophthalmol. 1991; 109:77–83.
6. Schuman JS, Tamar PK, Hertzmark E, et al. Reproducibility of nerve fiber layer thickness measurements using optical coherence tomography. Ophthalmology. 1996; 103:1889–98.
7. Blumenthal EZ, Williams JM, Weinreb RN, et al. Reproducibility of nerve fiber layer thickness measurements by use of optical coherence tomography. Ophthalmology. 2000; 107:2278–82.
8. Jonas JB, Schmidt AM, Muller-Bergh JA, et al. Human optic nerve fiber count and optic disc size. Invest Ophthalmol Vis Sci. 1992; 33:2012–8.
9. Varma R, Skaf M, Barrone E. Retinal nerve fiber layer thickness in normal human eyes. Ophthalmology. 1996; 103:2114–9.
10. Tsai CS, Zangwill L, Gonzalez C, et al. Ethnic differences in optic nerve topography. J Glaucoma. 1995; 4:248–57.
11. Huang D, Swanson EA, Lin CP, et al. Optical coherence tomography. Science. 1991; 54:1178–81.
12. Schuman JS, Hee MR, Arya Av, et al. Optical coherence tomography of the human retina. Arch Ophthalmol. 1995; 113:325–32.
13. Schuman JS, Hee MR, Puliafito CA, et al. Quantification of nerve fiber layer thickness in normal and glaucomatous eyes using optical coherence tomography. Arch Ophthalmol. 1995; 113:586–96.
14. Balazsi AG, Rootman J, Drance SM, et al. The effect of age on the nerve fiber population of the human optic nerve. Am J Ophthalmol. 1984; 97:760–6.
15. Johnson BM, Miao M, Sadun M. Age related decline of human optic nerve axon populations. Age. 1987; 10:5–9.
16. Hrynchak P, Hutchings N, Jones D, Simpson T. A comparison of cup-to-disc ratio measurement in normal subjects using optical coherence tomography image analysis of the optic nerve head and stereo fundus biomicroscopy. Ophthalmic Physiol Opt. 2004; 24:543–50.
17. Sim JO, Park CK. Optic nerve head analysis obtained by optical coherence tomography for the diagnosis of glaucoma in Koreans. J Korean Ophthalmol Soc. 2004; 45:1885–92.
18. Kanamori A, Nakamura M, Escano M, et al. Evaluation of the glaucomatous damage on retinal nerve fiber layer thickness measured by optical coherence tomography. Am J Ophthalmol. 2003; 135:513–20.
19. Zangwill LM, Bowd C, Berry CC, et al. Discriminating between normal and glaucomatous eye using the Heidelberg Retina Tomography, GDx Nerve Fiber Analyser, and Optical Coherence Tomographt. Arch Ophthalmol. 2001; 119:985–93.
20. Hoh ST, Greenfield DS, Mistberger A, et al. Optical coherence tomography and scanning laser polarimetry in normal, ocular hypertension and glaucomatous eyes. Am J Ophthalmol. 2000; 129:129–33.
Go to :
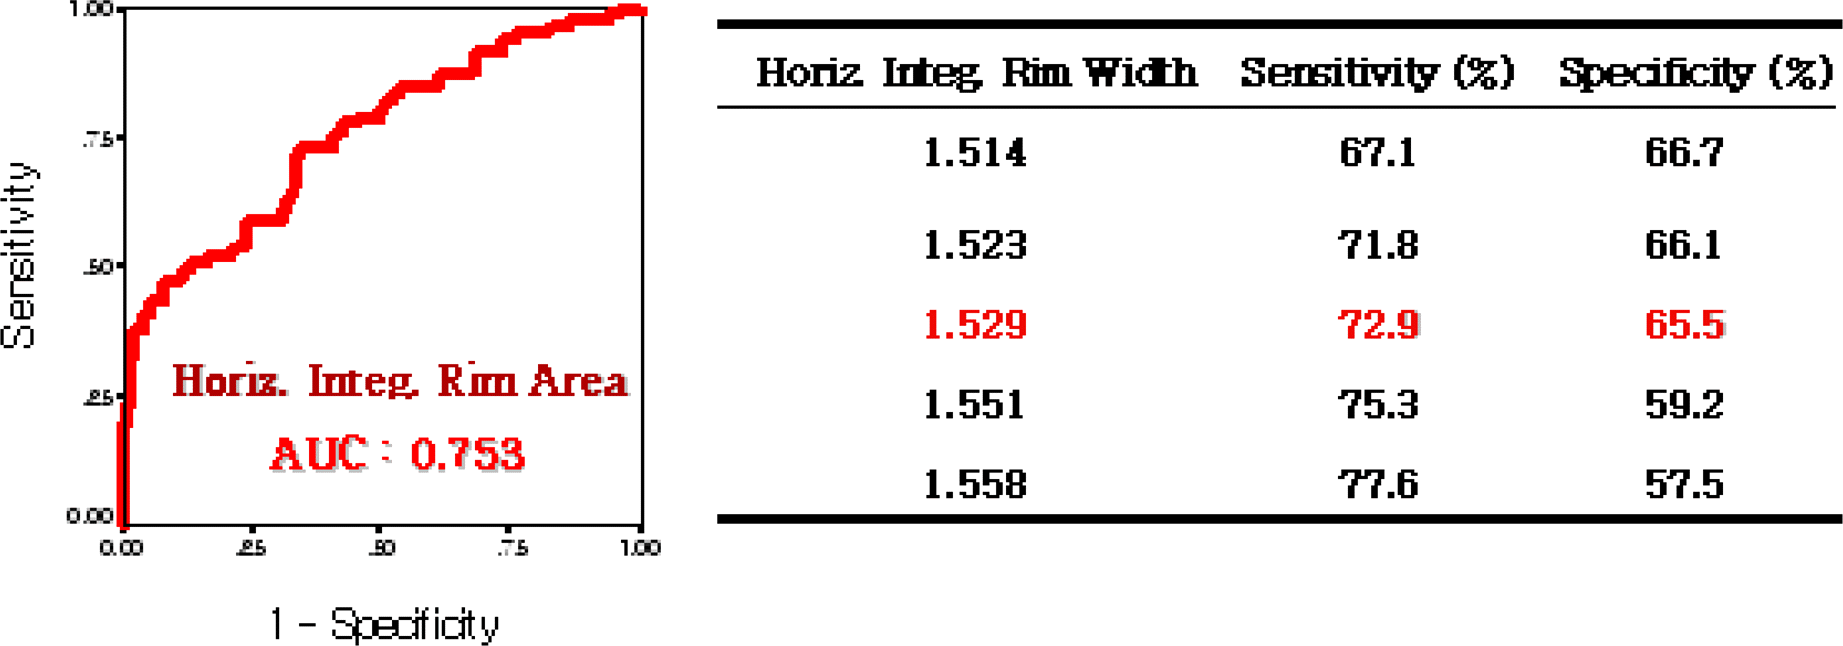 | Figure 1.Receiver operating characteristic (ROC) curve of horizontal integrated rim width in control group and early glaucoma group. It has the best discriminating capability. Cut-off value 1.529 mm2 yields high diagnostic value with sensitivity 72.9% and specificity 65.5%. |
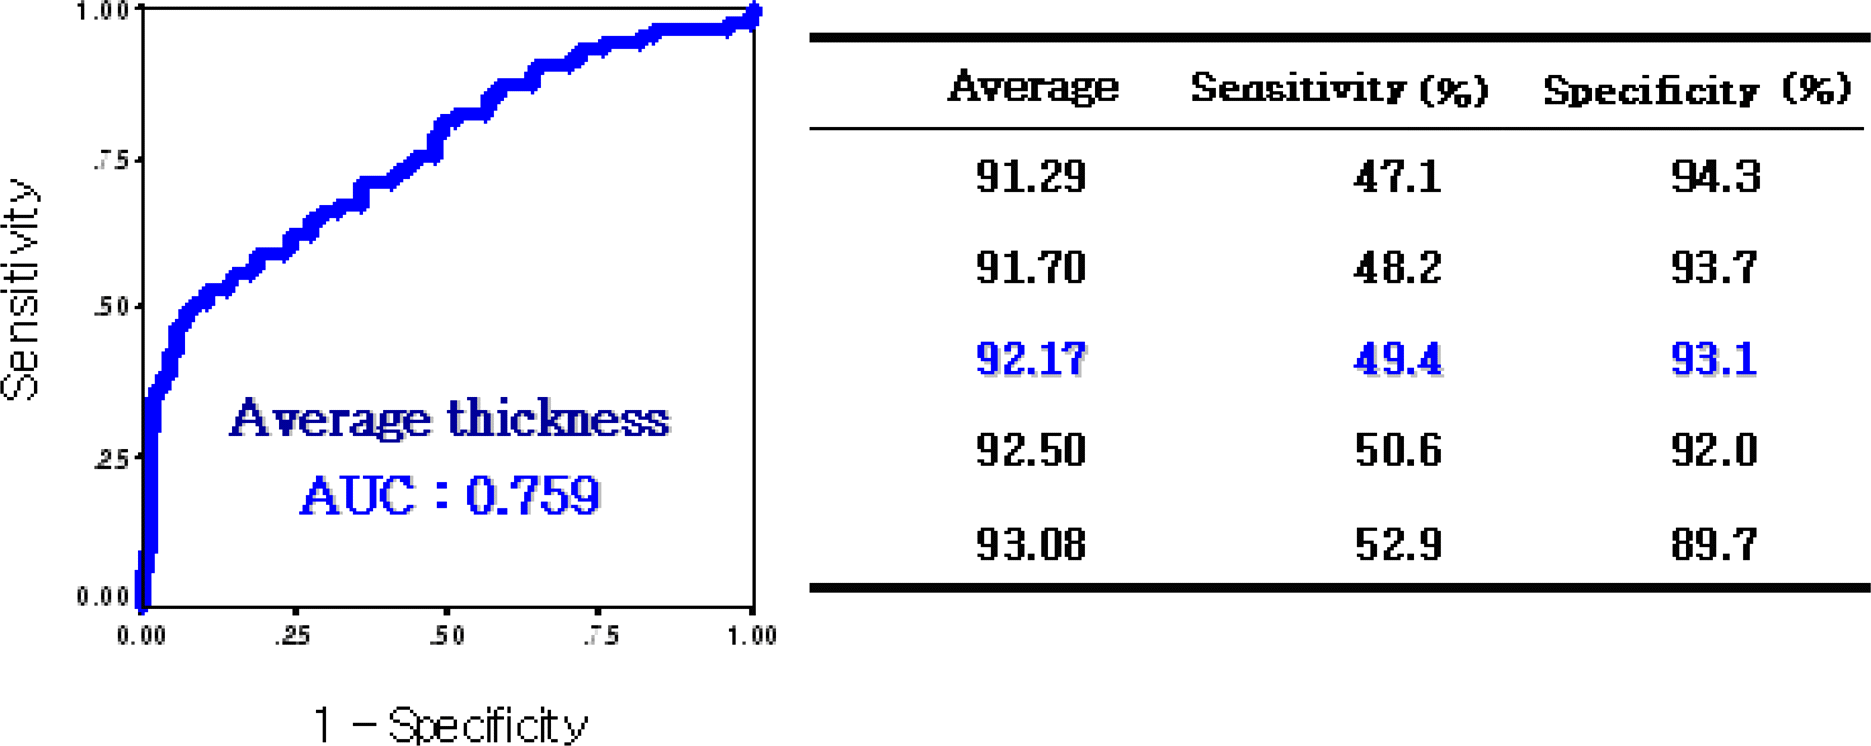 | Figure 2.Receiver operating characteristic (ROC) curve of average thickness in control group and early glaucoma group. It has the best discriminating capability among thickness parameters. Cut off value 92.17 pm yields high diagnostic value with sensitivity 49.4% and specificity 93.1%. |
Table 1.
Criteria for each subject
Table 2.
Backgrounds of subjects
| Normal | Glaucoma suspect | Early glaucoma | P valueΠ | |
|---|---|---|---|---|
| Number of patient | 102 | 72 | 85 | |
| Age (years) | 52.40±9.41 | 51.51±9.5 8 | 52.76± 11.02 | .728 |
| MD* (dB) | -1.76±.06 | -1.79±1.17 | -3.52± 1.38 | .000 |
| R.E.† (diopter) | -1.26±2.19 | -0.59± 1.72 | -0.53±2.17 | .217 |
| Cup/disk ratio | 0.42±0.12 | 0.61±0.13 | 0.65±0.21 | .000 |
| CCT‡ (gm) | 518.7±37.0 | 520.5±43.7 | 522.7±25.9 | .835 |
| IOP§ (mmHg) | 16.23±3.11 | 16.40±3.09 | 16.78±5.14 | .623 |
Table 3.
Comparison of OCT measured optic nerve head (ONH) analysis parameter value among groups
| Measurement | Normal | Glaucoma suspect | Early glaucoma | P* |
|---|---|---|---|---|
| vert. integrated rim vol. (mm3) | 0.27±0.16 | 0.22±0.13 | 0.18±0.14 | .000† |
| horiz. Integrated Rim Area (mm2) | 1.62±0.20 | 1.60±0.21 | 1.39±0.24 | .000‡ |
| rim area (mm2) | 1.54±0.35 | 1.44±0.33 | 1.20±0.45 | .000‡ |
| cup/disk area ratio | 0.42±0.14 | 0.51±0.13 | 0.55±0.16 | .000† |
| cup/disk horiz. ratio | 0.69±0.15 | 0.76±0.12 | 0.78±0.13 | .000† |
| cup/disk vert. ratio | 0.59±0.13 | 0.66±0.10 | 0.68±0.14 | .012† |
Table 4.
Comparison of OCT measured retinal nerve fiber layer (RNFL) thickness (pm) analysis parameter value among groups
| Measurement | Normal | Glaucoma Suspect | Early Glaucoma | P* | P† | P‡ | P§ |
|---|---|---|---|---|---|---|---|
| Average | 104.2±9.7 | 103.6±9.6 | 92.8±14.5 | .000 | .938 | .000 | .000 |
| Superior quadrant | 126.7±14.0 | 125.8± 15.4 | 114.3± 19.4 | .000 | .922 | .000 | .000 |
| Temporal quadrant | 73.7± 10.0 | 74.1±11.7 | 66.4± 15.4 | .000 | .982 | .000 | .000 |
| Inferior quadrant | 137.1±16.8 | 131.6± 16.0 | 118.9±22.2 | .000 | .140 | .000 | .000 |
| Nasal quadrant | 79.1± 15.6 | 82 7±18.8 | 7 4.1 ± 17.3 | .007 | .351 | .116 | .005 |
| SmaxΠ | 159.5±19.4 | 159.2± 18.6 | 146.4±22.9 | .000 | .993 | .000 | .000 |
| Imax# | 170.3±18.8 | 167.4± 17.6 | 150.3±27.3 | .000 | .658 | .000 | .000 |
| CH (Clock hour) 12 | 130.4±20.2 | 129.1±23.4 | 117.3±24.5 | .000 | .928 | .000 | .003 |
| CH11 | 133.1±19.4 | 132.7±22.0 | 119.5±27.8 | .000 | .994 | .000 | .001 |
| CH10 | 86.4±14.5 | 86.2±16.8 | 77.7±19.6 | .001 | .995 | .001 | .005 |
| CH9 (temporal) | 60.3±10.4 | 60.8± 10.9 | 5 5.4± 14.9 | .008 | .961 | .021 | .019 |
| CH8 | 77.7±14.9 | 78.4± 15.7 | 68.9± 18.4 | .000 | .965 | .001 | .001 |
| CH7 | 142.4±20.2 | 137.3±23.4 | 121.1±30.3 | .000 | .381 | .000 | .000 |
| CH6 (inferior) | 149.1±22.9 | 144.2±20.6 | 130.9±27.4 | .000 | .384 | .000 | .002 |
| CH5 | 118.9±23.3 | 117.9±23.0 | 106.2±21.7 | .000 | .955 | .001 | .004 |
| CH4 | 77.9± 16.8 | 81.1±16.0 | 72.9±18.6 | .001 | .451 | .111 | .008 |
| CH3 (nasal) | 64.7± 13.9 | 66.1±16.5 | 61.3± 16.0 | .125 | .820 | .290 | .125 |
| CH2 | 91. 1±22.6 | 93.2±22.0 | 84.0±22.3 | .024 | .819 | .081 | .030 |
| CHl | 117.1± 19.4 | 115.4± 19.0 | 102.5±25.6 | .000 | .868 | .000 | .001 |
Table 5.
Area under the receiver operating characteristic (AUROC) curve, best combination of sensitivity/specificity with specificity ≥90% for the individual OCT parameters detecting early glaucoma
| Measurement | AUROC‡ | Cut off value | Sensitivity | Specificity |
|---|---|---|---|---|
| ONH* parameters | ||||
| horiz. integrated rim area | 0.753 | 1.35 | 47.1% | 92.0% |
| rim area | 0.729 | 1.11 | 45.9% | 91.4% |
| vert. integrated rim vol. | 0.713 | 0.13 | 41.2% | 91.4% |
| RNFL† thickness parameters | ||||
| Imax§ | 0.718 | 144.5 | 37.6% | 92.0% |
| average thickness | 0.759 | 92.5 | 50.6% | 92.0% |
| inferior | 0.728 | 111.5 | 35.3% | 93.7% |
Table 6.
Area under the receiver operating characteristic (AUROC) curve, best combination of sensitivity/specificity with specificity ≥80% for the individual OCT parameters detecting early glaucoma
| Measurement | AUROC‡ | Cut off value | Sensitivity | Specificity |
|---|---|---|---|---|
| ONH* parameters | ||||
| horiz. integrated rim area | 0.753 | 1.42 | 51.8 | 83.9 |
| rim area | 0.729 | 1.56 | 55.3 | 81.6 |
| vert. integrated rim vol. | 0.713 | 0.14 | 48.2 | 84.5 |
| RNFL† thickness parameters Imax§ | ||||
| 0.718 | 154.5 | 54.1 | 81.0 | |
| average thickness | 0.759 | 94.3 | 58.8 | 81.0 |
| Inferior | 0.728 | 120.5 | 50.6 | 81.6 |
 XML Download