Abstract
Background/Aims
Since the development of ambulatory esophageal pH monitoring test to diagnose gastroesophageal reflux disease (GERD), several parameters have been introduced. The aim of this study was to assess whether using the symptom index (SI), symptom sensitivity index (SSI), and symptom association probability (SAP), in addition to the DeMeester score (DS), would be useful for inter-preting the Bravo pH monitoring test.
Methods
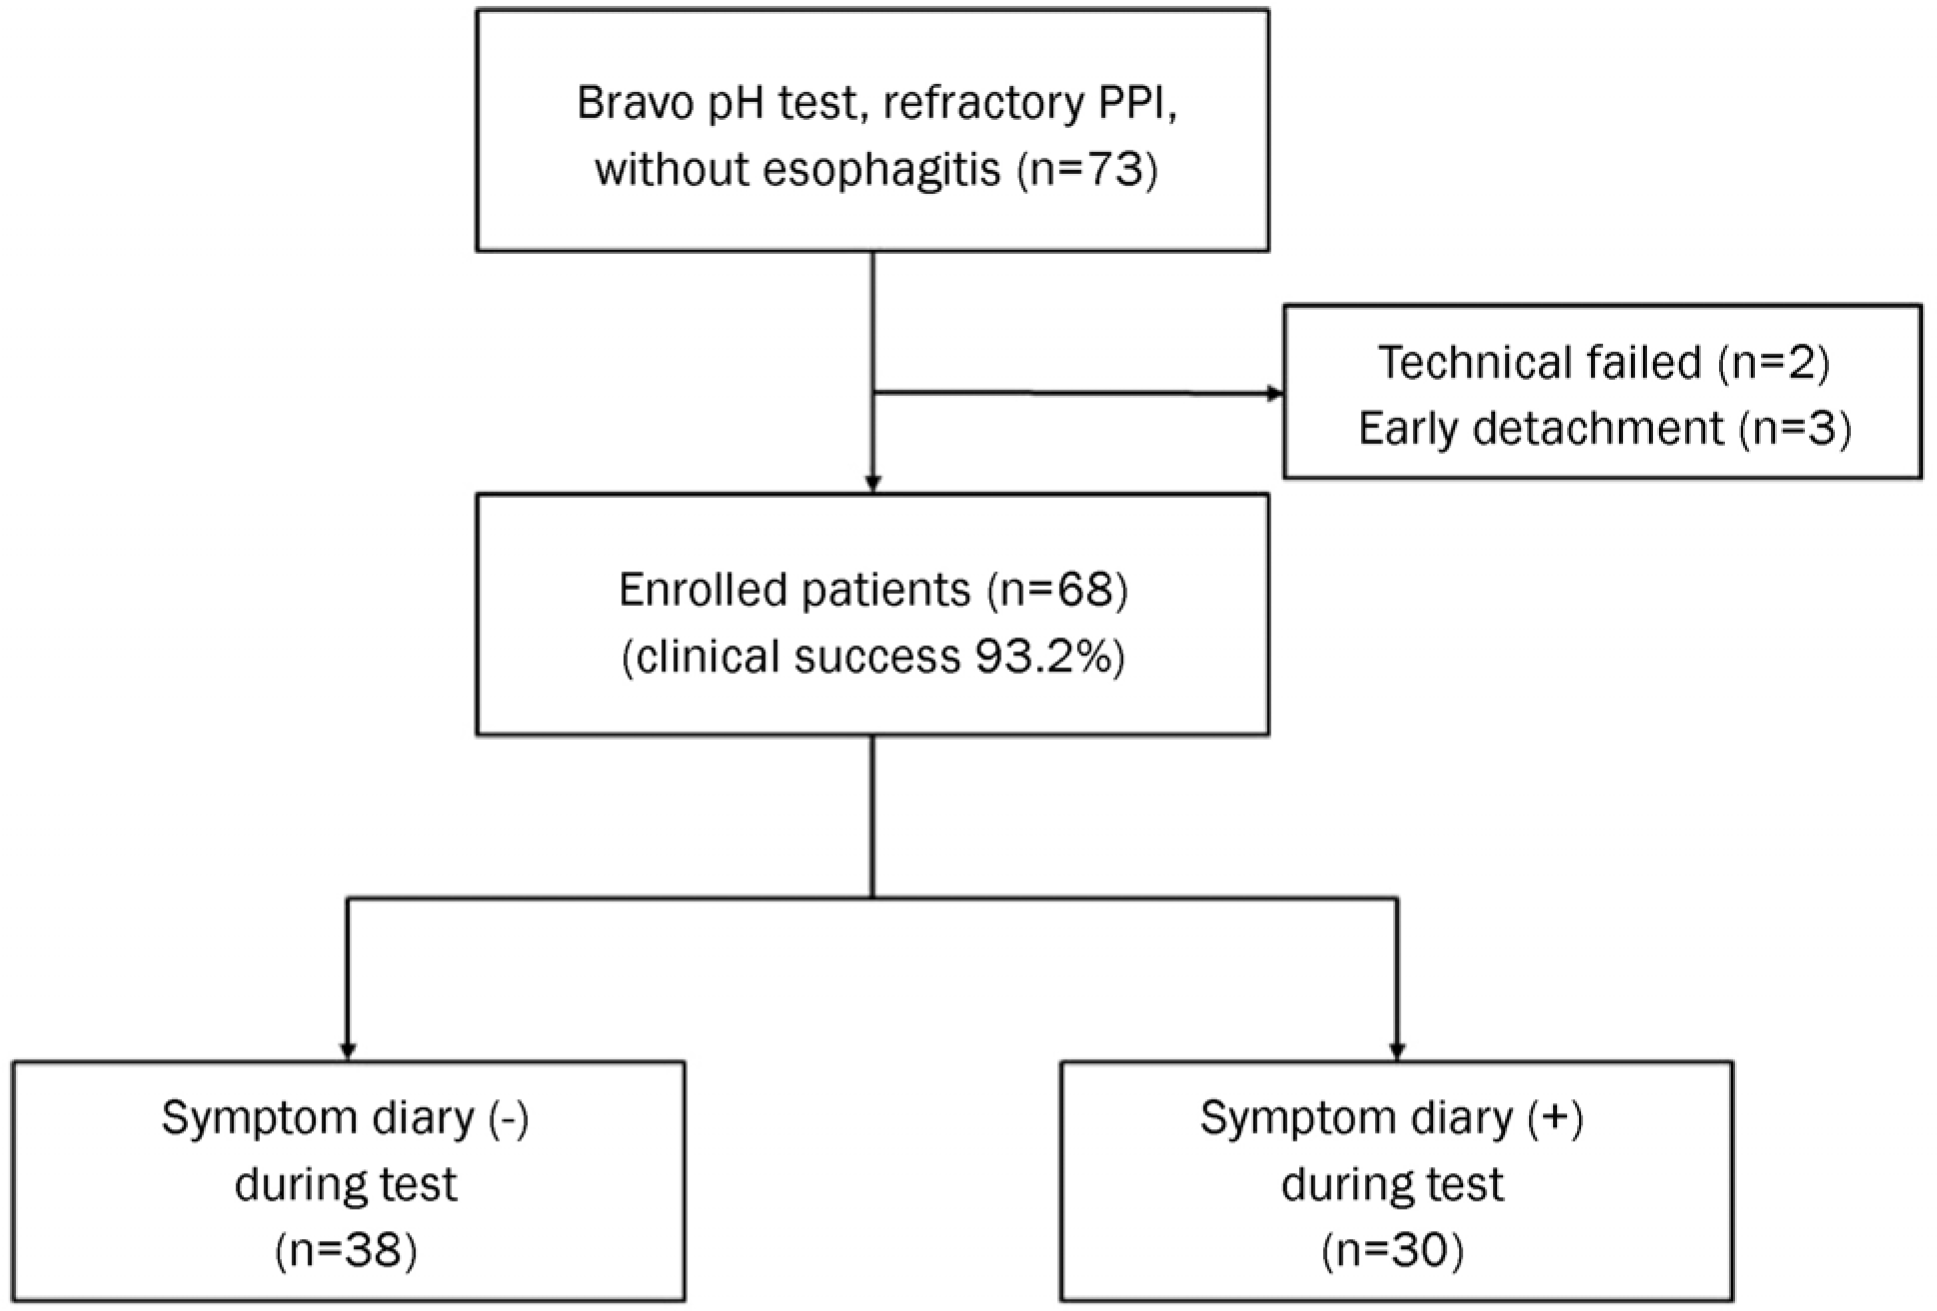
A retrospective study, which included 68 patients with reflux symptoms refractory to proton pump inhibitor (PPI) therapy who underwent a Bravo capsule pH test between October 2006 and May 2015, was carried out. Acid reflux parameters and symptom reflux association parameters were analyzed.
Results
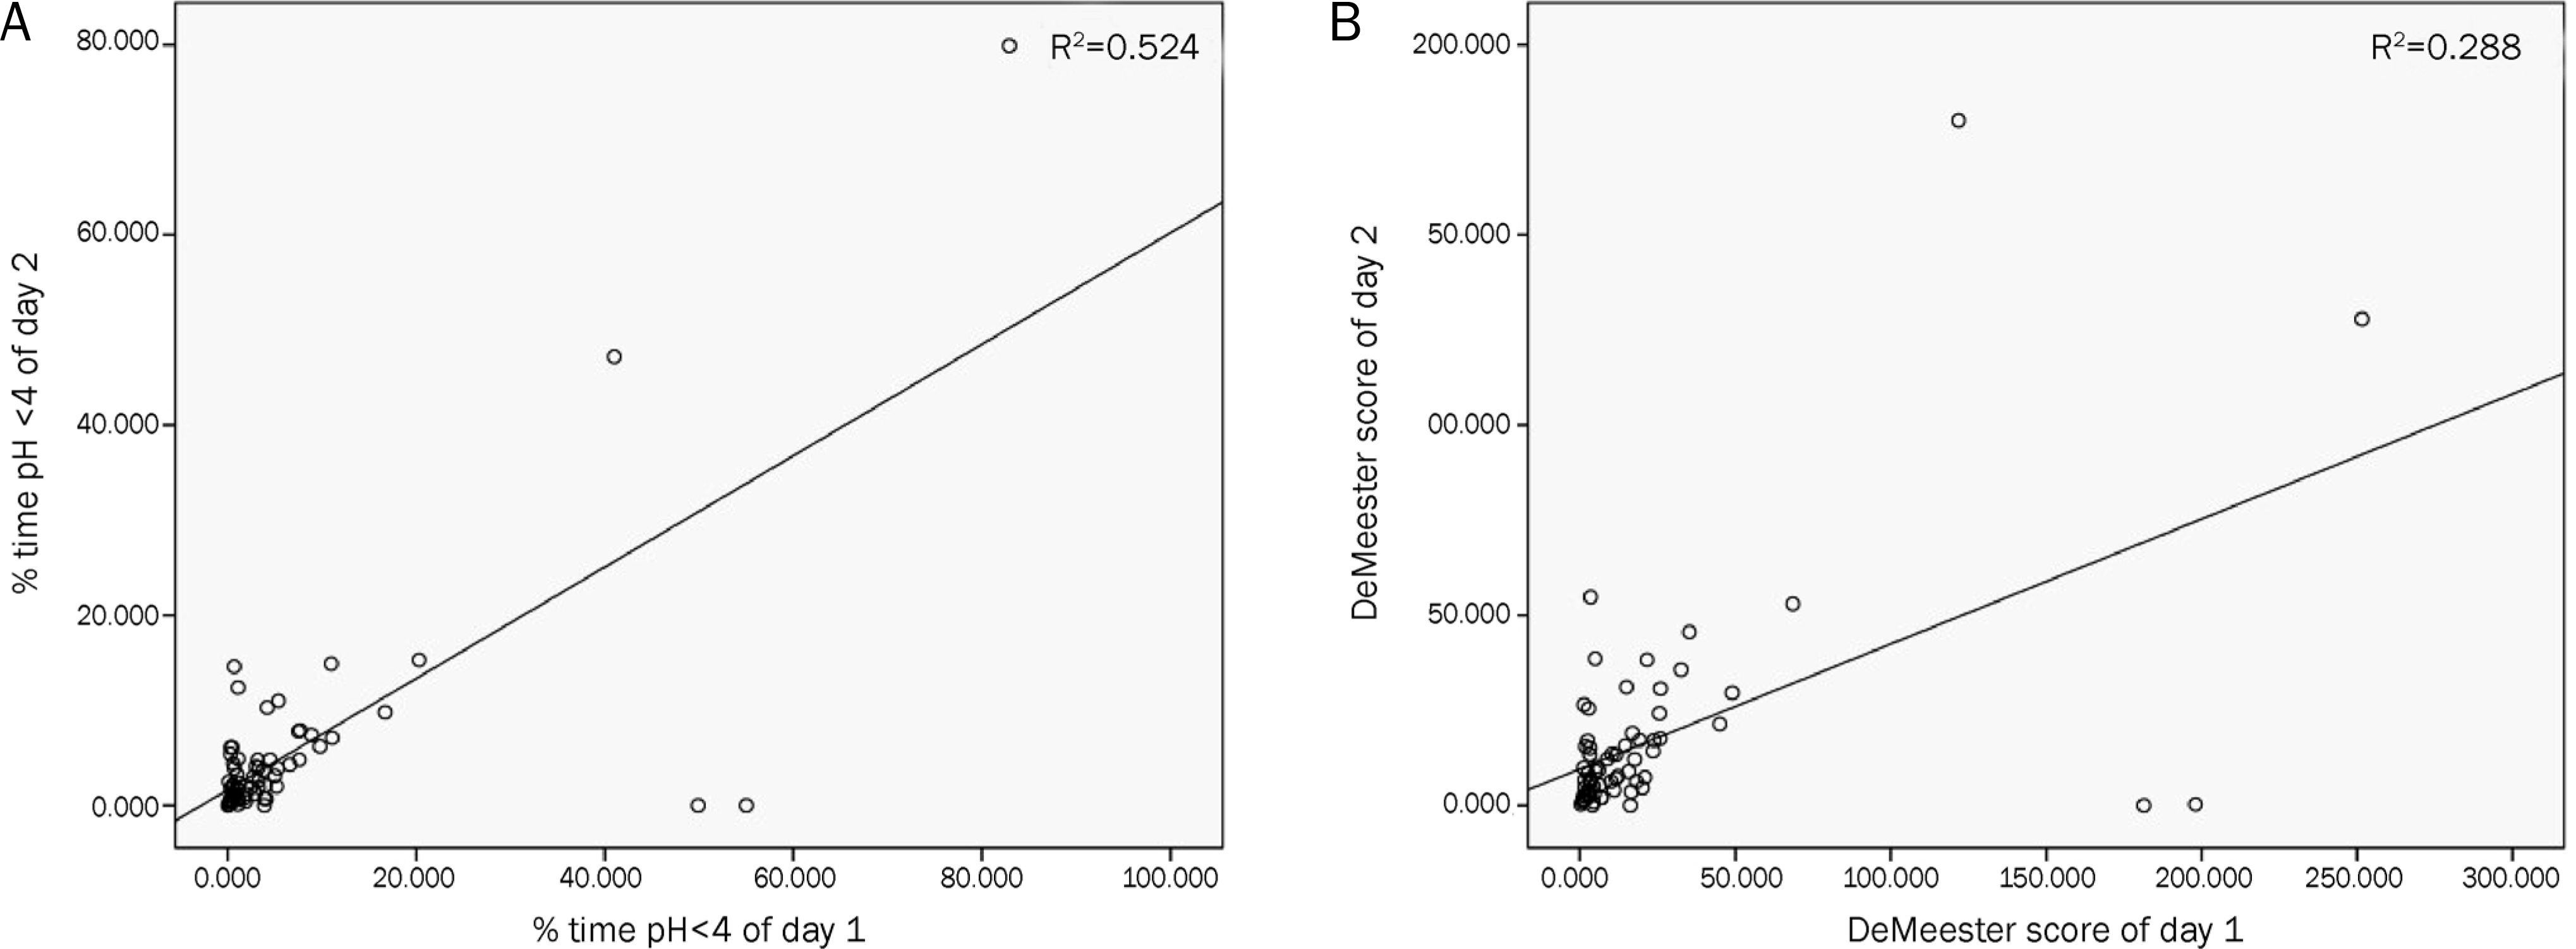
The median percent time of total pH<4 and DS were 2.90% (interquartile range [IQR] 1.13–6.03%) and 11.10 (IQR 4.90–22.80), respectively. According to the analysis of the day-to-day variation in percent time of total pH<4 (r=0.724) and DS (r=0.537), there was a significant correlation between Day 1 and Day 2. The positive rate of Bravo test according to DS was 27 (39.7%). Although thirty patients experienced symptoms during the test, there were no significant differences of reflux parameters compared with other patients. In the symptom group, 7 patients (23.3%) were identified as having negative DS and an abnormal symptom-related index. There were no significant test-related complications.
References
1. Wang WH, Huang JQ, Zheng GF, et al. Is proton pump inhibitor testing an effective approach to diagnose gastroesophageal reflux disease in patients with noncardiac chest pain?: a metaanalysis. Arch Intern Med. 2005; 165:1222–1228.
2. Hirano I, Richter JE. Practice Parameters Committee of the American College of Gastroenterology. ACG practice guidelines: esophageal reflux testing. Am J Gastroenterol. 2007; 102:668–685.

3. Lawenko RM, Lee YY. Evaluation of gastroesophageal reflux disease using the bravo capsule pH system. J Neurogastroenterol Motil. 2016; 22:25–30.

4. Roman S, Mion F, Zerbib F, Benamouzig R, Letard JC, Bruley des Varannes S. Wireless pH capsule–yield in clinical practice. Endoscopy. 2012; 44:270–276.
5. Chander B, Hanley-Williams N, Deng Y, Sheth A. 24 versus 48-hour bravo pH monitoring. J Clin Gastroenterol. 2012; 46:197–200.

6. Ang D, Xu Y, Ang TL, et al. Wireless oesophageal pH monitoring: establishing values in a multiracial cohort of asymptomatic Asian subjects. Dig Liver Dis. 2013; 45:371–376.

7. Bredenoord AJ, Weusten BL, Smout AJ. Symptom association analysis in ambulatory gastro-oesophageal reflux monitoring. Gut. 2005; 54:1810–1817.

8. Eckardt VF, Dilling B, Bernhard G. The impact of open access 24-h pH-metry on the diagnosis and management of esophageal reflux disease. Am J Gastroenterol. 1999; 94:616–621.

9. Netzer P, Gut A, Heer R, et al. Five-year audit of ambulatory 24-hour esophageal pH-manometry in clinical practice. Scand J Gastroenterol. 1999; 34:676–682.
10. Lacy BE, Weiser K, Chertoff J, et al. The diagnosis of gastroesophageal reflux disease. Am J Med. 2010; 123:583–592.

11. Grigolon A, Bravi I, Cantù P, Conte D, Penagini R. Wireless pH monitoring: better tolerability and lower impact on daily habits. Dig Liver Dis. 2007; 39:720–724.

12. Sweis R, Fox M, Anggiansah A, Wong T. Prolonged, wireless pH-studies have a high diagnostic yield in patients with reflux symptoms and negative 24-h catheter-based pH-studies. Neurogastroenterol Motil. 2011; 23:419–426.

13. Cho YK, Choi MG, Chang JH, et al. The performance and safety of bravo esophageal pH monitoring in Korean patients. Korean J Neurogastroenterol Motil. 2007; 13:111–117.
14. Vaezi MF, Schroeder PL, Richter JE. Reproducibility of proximal probe pH parameters in 24-hour ambulatory esophageal pH monitoring. Am J Gastroenterol. 1997; 92:825–829.
15. Jamieson JR, Stein HJ, DeMeester TR, et al. Ambulatory 24-h esophageal pH monitoring: normal values, optimal thresholds, specificity, sensitivity, and reproducibility. Am J Gastroenterol. 1992; 87:1102–1111.
16. Wenner J, Johnsson F, Johansson J, Oberg S. Wireless esophageal pH monitoring is better tolerated than the catheter-based technique: results from a randomized crossover trial. Am J Gastroenterol. 2007; 102:239–245.

17. Ang D, Teo EK, Ang TL, et al. To Bravo or not? A comparison of wireless esophageal pH monitoring and conventional pH catheter to evaluate non-erosive gastroesophageal reflux disease in a multiracial Asian cohort. J Dig Dis. 2010; 11:19–27.

18. de Hoyos A, Esparza EA. Technical problems produced by the bravo pH test in nonerosive reflux disease patients. World J Gastroenterol. 2010; 16:3183–3186.
19. Aziz Q, Fass R, Gyawali CP, Miwa H, Pandolfino JE, Zerbib F. Functional esophageal disorders. Gastroenterology 2016 Feb 15. pii: S0016–5085(16)00178–5. [Epub ahead of print] 20. Mainie I, Tutuian R, Castell DO. Comparison between the combined analysis and the DeMeester Score to predict response to PPI therapy. J Clin Gastroenterol. 2006; 40:602–605.
Fig. 2.
Correlation between Day 1 and Day 2 of the Bravo capsule pH test. (A) There was positive correlation between % time pH<4 of Day 1 and Day 2 (r=0.724, p<0.01). (B) There was positive correlation between DeMeester score of Day 1 and Day 2 (r=0.537, p<0.01). Coefficient of determination (R2) was calculated by linear regression.

Table 1.
Baseline Characteristics of Patients
| Variable | n=68 (median, IQR) |
|---|---|
| Age (mean±SD) | 50.3±12.4 |
| Gender (%) | |
| Male | 26 (38.2) |
| Female | 42 (61.8) |
| Total % time of pH<4: >5.8% (%) a | 20 (29.4) |
| Total % time of pH<4 | 2.9 (1.0–6.9) |
| Upright % time of pH<4 | 3.5 (1.2–6.9) |
| Supine % time of pH<4 | 0.5 (0.0–3.1) |
| Total number of reflux episode | 42.5 (23.0–72.8) |
| Number of reflux episodes>5 min | 2.5 (1–6) |
| Longest time of reflux (min) | 9 (5.0–27.3) |
| DeMeester score | 10.8 (4.7–23.4) |
| DeMeester score>14.72 (%) a | 33 (48.5) |
Table 2.
Baseline Characteristics of Patients according to the Symptom Positivity
| Variable | Positive symptom group (n=30) | Negative symptom group (n=38) | p-value |
|---|---|---|---|
| Age (mean±SD) | 48.0±12.9 | 52.1±11.9 | 0.175 |
| Gender (%) | |||
| Male | 12 (46.2) | 14 (53.8) | |
| Female | 18 (42.9) | 24 (57.1) | 0.807 |
| Total % time of pH<4: >5.8% (%)a | 6 (20.0) | 14 (36.8) | 0.130 |
| Total % time of pH<4 | 2.6 (1.2–3.8) | 3.3 (1.0–8.3) | 0.150 |
| Upright % time of pH<4 | 2.6 (1.2–6.0) | 4.2 (1.2–9.9) | 0.154 |
| Supine % time of pH<4 | 0.5 (0.0–2.3) | 0.6 (0.0–3.6) | 0.464 |
| Total number of reflux episode | e 54 (25.3–79.3) | 39 (21.3–67.3) | 0.089 |
| Number of reflux episodes>5 | min 3 (1.0–5.3) | 2 (0.0–6.0) | 0.313 |
| Longest time of reflux (min) | 9 (5.0–18.8) | 9 (4.0–31.5) | 0.482 |
| DeMeester score | 9.9 (5.3–16.9) | 13.2 (4.2–27.1) | 0.197 |
| DeMeester score>14.72 (%) a | 15 (50.0) | 18 (47.4) | 0.829 |
| % time of meal (mean±SD) | 4.2±1.9 | 4.7±2.9 | 0.380 |
Table 3.
Subanalysis of Symptom-Reflux Association in the Symptom Positive Group (n=30)
| Variable | Day 1 | Day 2 | Day 1 or Day 2a |
|---|---|---|---|
| Total % time of pH<4: >5.8% | 4 | 4 | 6 (20.0) |
| DeMeester score>14.72 | 10 | 8 | 15 (50.0) |
| SI≥50% | 12 | 5 | 15 (50.0) |
| SSI≥10% | 3 | 5 | 6 (20.0) |
| SAP≥95% | 6 | 2 | 7 (23.3) |
| DeMeester score (negative, <14.72)+more than two abornmal findings among symtom-reflux association analysis (SI, SSI, SAP) | 5 | 2 | 4 (13.3) |


 PDF
PDF ePub
ePub Citation
 Print
Print


 XML Download