Abstract
Background/Aims
Gallbladder polyps (GBP) are a common clinical finding that can express malignant potential. The aim of this study was to evaluate whether vegetarianism protects against GBP, together with other putative risk factors.
Methods
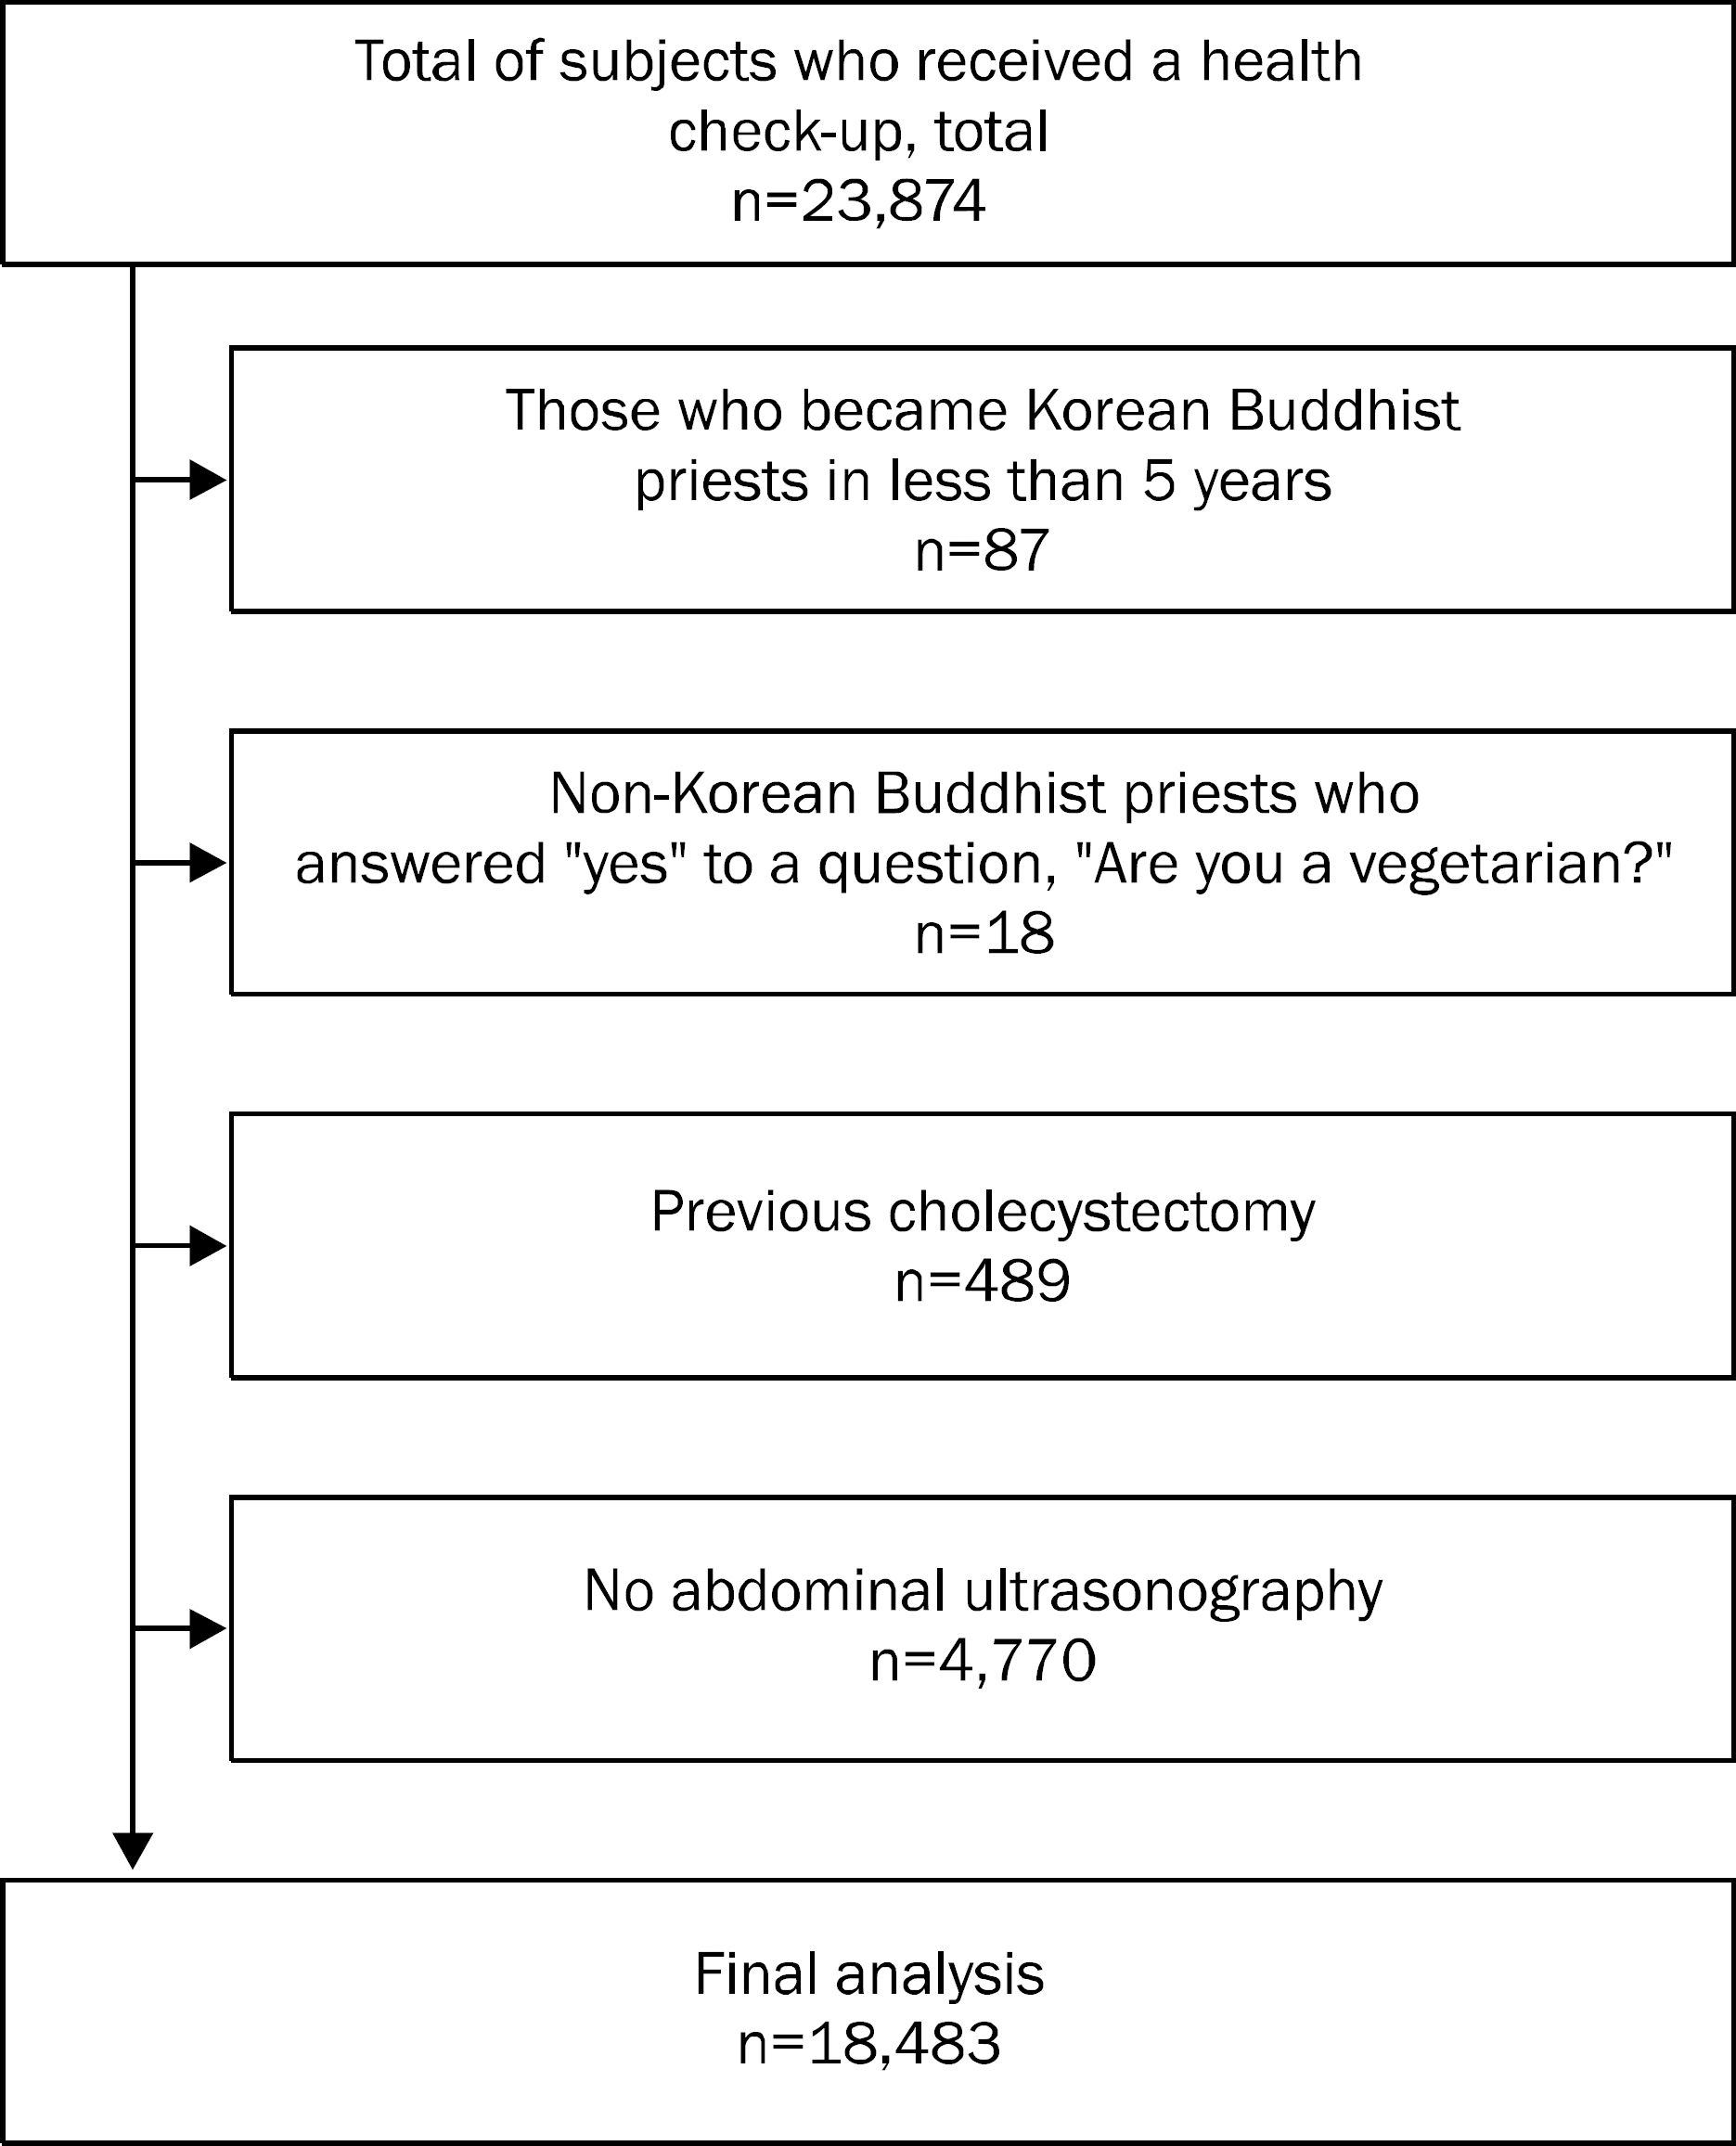
A retrospective, cross-sectional study was conducted with subjects who received a health check-up from July 2005 to December 2011. Korean Buddhist priests, who are obligatory vegetarians by religious belief, were identified as vegetarians (vegetarian group) and compared with a non-vegetarian control group sampled from those coming for health check-ups at the same institution.
Results
Out of 18,483 subjects, GBP were found in 810 (4.4%). Although GBP tended to be less common in the vegetarian group (23 [3.5%] out of 666) than in control group (787 [4.4%] out of 17,817), the difference was insignificant statistically (p=0.233). By logistic regression, old age (OR=1.61, 95% CI=1.19–2.26 for 30–39 years; OR=1.47, 95% CI=1.08–1.98 for 40–49 years), male gender (OR=1.51, 95% CI=1.31–1.75), high BMI (OR=1.18, 95% CI=1.00–1.39 for ≥23.0 kg/m2 and <25.0 kg/m2) and HBsAg positivity (OR=1.53, 95% CI=1.19–1.98) were independent risk factors of GBP.
Go to : 
References
1. Lee KF, Wong J, Li JC, Lai PB. Polypoid lesions of the gallbladder. Am J Surg. 2004; 188:186–190.

2. Hayashi Y, Liu JH, Moriguchi H, et al. Prevalence of polypoid lesions of the gallbladder in urban and rural areas of Japan: comparison between 1988 and 1993. J Clin Gastroenterol. 1996; 23:158–159.

3. Lin WR, Lin DY, Tai DI, et al. Prevalence of and risk factors for gallbladder polyps detected by ultrasonography among healthy Chinese: analysis of 34 669 cases. J Gastroenterol Hepatol. 2008; 23:965–969.
4. Pandey M, Khatri AK, Sood BP, Shukla RC, Shukla VK. Cholecys-tosonographic evaluation of the prevalence of gallbladder diseases. A university hospital experience. Clin Imaging. 1996; 20:269–272.

5. Yang HL, Sun YG, Wang Z. Polypoid lesions of the gallbladder: diagnosis and indications for surgery. Br J Surg. 1992; 79:227–229.

6. Wan YL. Polypoid lesions of the gallbladder. Zhonghua Wai Ke Za Zhi. 1989; 27:450–453. 507.
7. Segawa K, Arisawa T, Niwa Y, et al. Prevalence of gallbladder polyps among apparently healthy Japanese: ultrasonographic study. Am J Gastroenterol. 1992; 87:630–633.
8. Lim SH, Kim DH, Park MJ, et al. Is metabolic syndrome one of the risk factors for gallbladder polyps found by ultrasonography during health screening? Gut Liver. 2007; 1:138–144.

9. Chen CY, Lu CL, Chang FY, Lee SD. Risk factors for gallbladder polyps in the Chinese population. Am J Gastroenterol. 1997; 92:2066–2068.
10. Cantürk Z, Sentürk O, Cantürk NZ, Anik YA. Prevalence and risk factors for gall bladder polyps. East Afr Med J. 2007; 84:336–341.
11. Jørgensen T, Jensen KH. Polyps in the gallbladder. A prevalence study. Scand J Gastroenterol. 1990; 25:281–286.
12. Panagiotakos DB, Pitsavos C, Skoumas Y, Stefanadis C. The association between food patterns and the metabolic syndrome using principal components analysis: The ATTICA Study. J Am Diet Assoc. 2007; 107:979–987.

13. Rizzo NS, Sabaté J, Jaceldo-Siegl K, Fraser GE. Vegetarian dietary patterns are associated with a lower risk of metabolic syndrome: the adventist health study 2. Diabetes Care. 2011; 34:1225–1227.
14. Chiang JK, Lin YL, Chen CL, et al. Reduced risk for metabolic syndrome and insulin resistance associated with ovo-lacto-vegeta-rian behavior in female Buddhists: a case-control study. PLoS One. 2013; 8:e71799.

15. Garduño-Diaz SD, Khokhar S. South Asian dietary patterns and their association with risk factors for the metabolic syndrome. J Hum Nutr Diet. 2013; 26:145–155.

16. Fraser GE. Vegetarian diets: what do we know of their effects on common chronic diseases? Am J Clin Nutr. 2009; 89:1607S–1612S.

18. Key TJ, Appleby PN, Rosell MS. Health effects of vegetarian and vegan diets. Proc Nutr Soc. 2006; 65:35–41.

19. Appleby PN, Davey GK, Key TJ. Hypertension and blood pressure among meat eaters, fish eaters, vegetarians and vegans in EPIC-Oxford. Public Health Nutr. 2002; 5:645–654.

20. Western Pacific Regional Office of the World Health Organization TIOTF. The Asia-Pacific perspective: redefining obesity and its treatment. Sydney: Health Communications Austrailia;2000. p. 19–20.
21. National Cholesterol Education Program (NCEP) Expert Panel on Detection, Evaluation, and Treatment of High Blood Cholesterol in Adults (Adult Treatment Panel III). Third Report of the National Cholesterol Education Program (NCEP) Expert Panel on Detection, Evaluation, and Treatment of High Blood Cholesterol in Adults (Adult Treatment Panel III) final report. Circulation. 2002; 106:3143–3421.
22. Yang HL, Kong L, Hou LL, et al. Analysis of risk factors for polypoid lesions of gallbladder among health examinees. World J Gastroenterol. 2012; 18:3015–3019.

23. Larsson SC, Wolk A. Obesity and the risk of gallbladder cancer: a metaanalysis. Br J Cancer. 2007; 96:1457–1461.

24. Hosseini-Esfahani F, Jessri M, Mirmiran P, Bastan S, Azizi F. Adherence to dietary recommendations and risk of metabolic syndrome: Tehran Lipid and Glucose Study. Metabolism. 2010; 59:1833–1842.

25. Amini M, Esmaillzadeh A, Shafaeizadeh S, Behrooz J, Zare M. Relationship between major dietary patterns and metabolic syndrome among individuals with impaired glucose tolerance. Nutrition. 2010; 26:986–992.

27. Lee Y, Krawinkel M. Body composition and nutrient intake of Buddhist vegetarians. Asia Pac J Clin Nutr. 2009; 18:265–271.
28. Cha BK. A study of nutreint intake states and the prevalence of obesity in buddhist nuns. Korean J Community Nutr. 2001; 6:227–233.
29. Yoon JS, Lee WJ. A nutritional survey of Buddhist nuns. Korean J Nutr. 1982; 15:268–276.
30. Seo HK. Sachalui sigsaenghwal [Dietary life in Buddhist temple]. J Korean Soc Food Cult. 1995; 10:497–503. Korean.
31. Lai SW, Lai HC, Liu CS, Liao KF, Lin T, Lin CC. The prevalence of gallbladder polyps is higher in HBsAg positive population. Acta Gastroenterol Belg. 2010; 73:294–295.
Go to : 
Table 1.
Comparison of Baseline Characteristics between Vegetarian and Control Group
Table 2.
Characteristics of Gallbladder Polyps
Table 3.
Univariate Analysis for Possible Risk Factors for Gallbladder Polyp
Table 4.
Multivariate Analysis for Possible Risk Factors for Gallbladder Polyp


 PDF
PDF ePub
ePub Citation
 Print
Print


 XML Download