Abstract
Background/Aims
Methods
Results
References
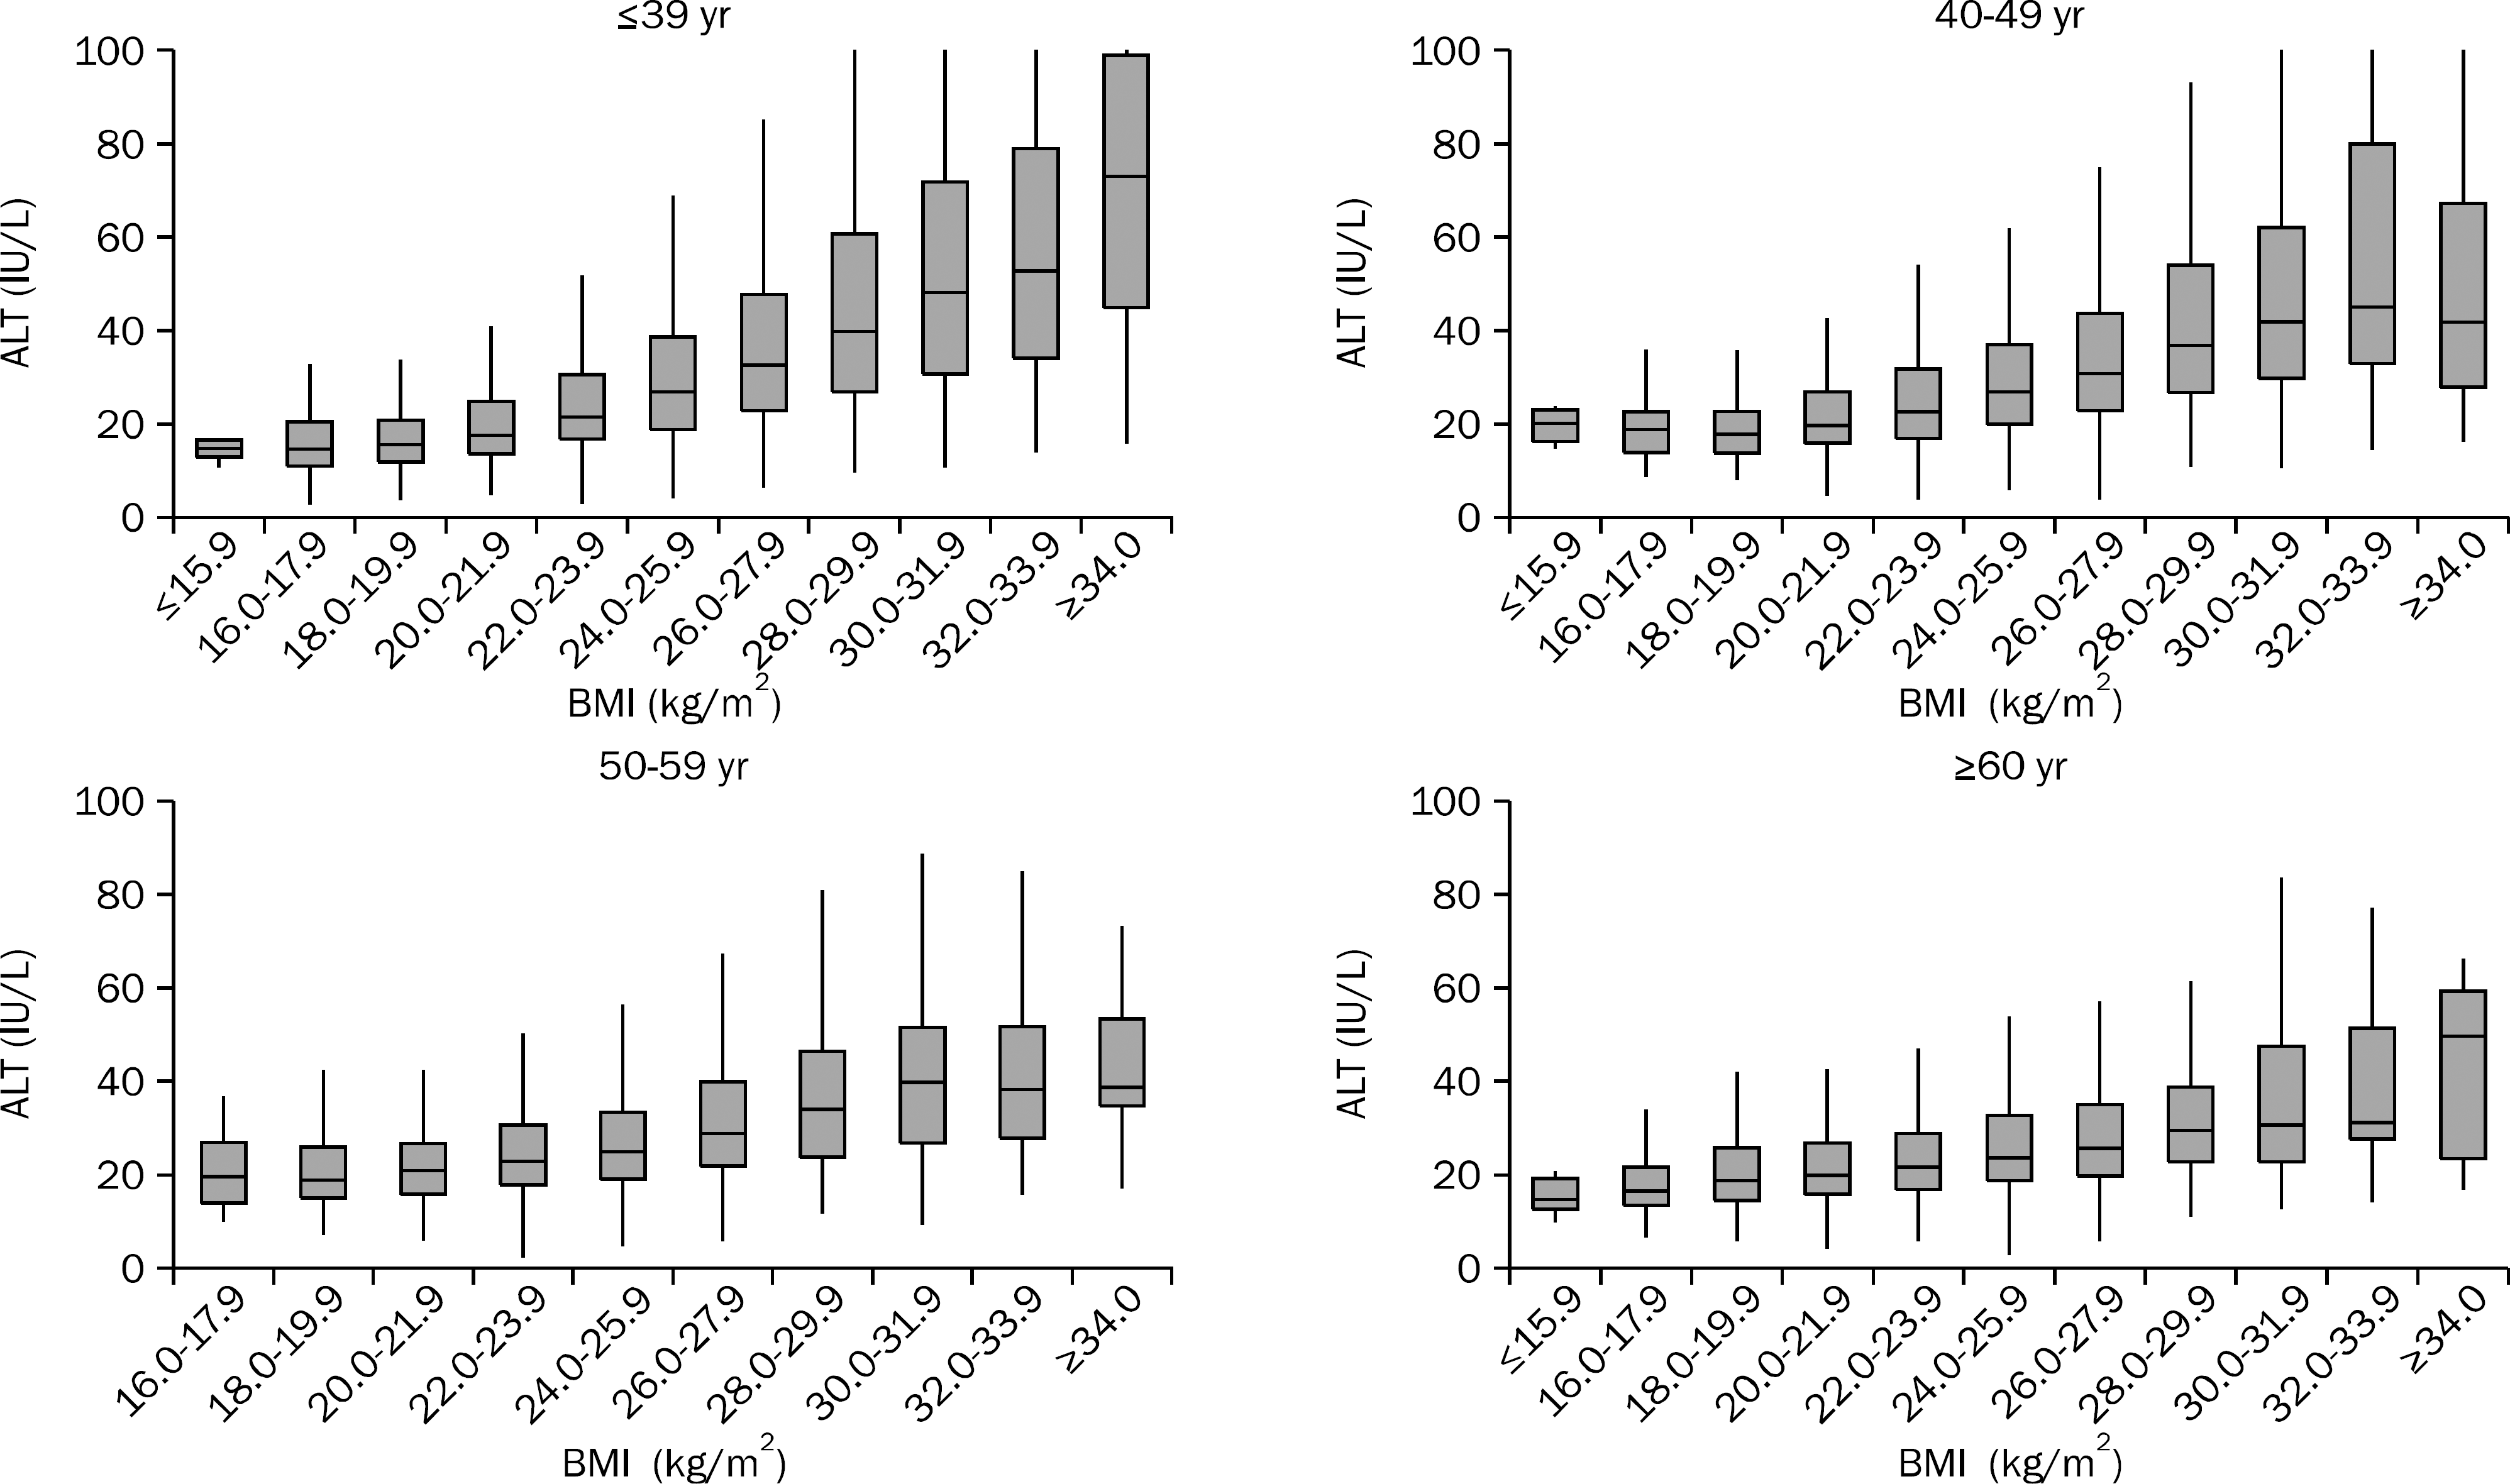 | Fig. 1.The distribution of range of ALT levels according to age and BMI in male subjects. The range of ALT level varied widely according to the increase in BMI, and this finding was more prominent in younger subjects than in older subjects. |
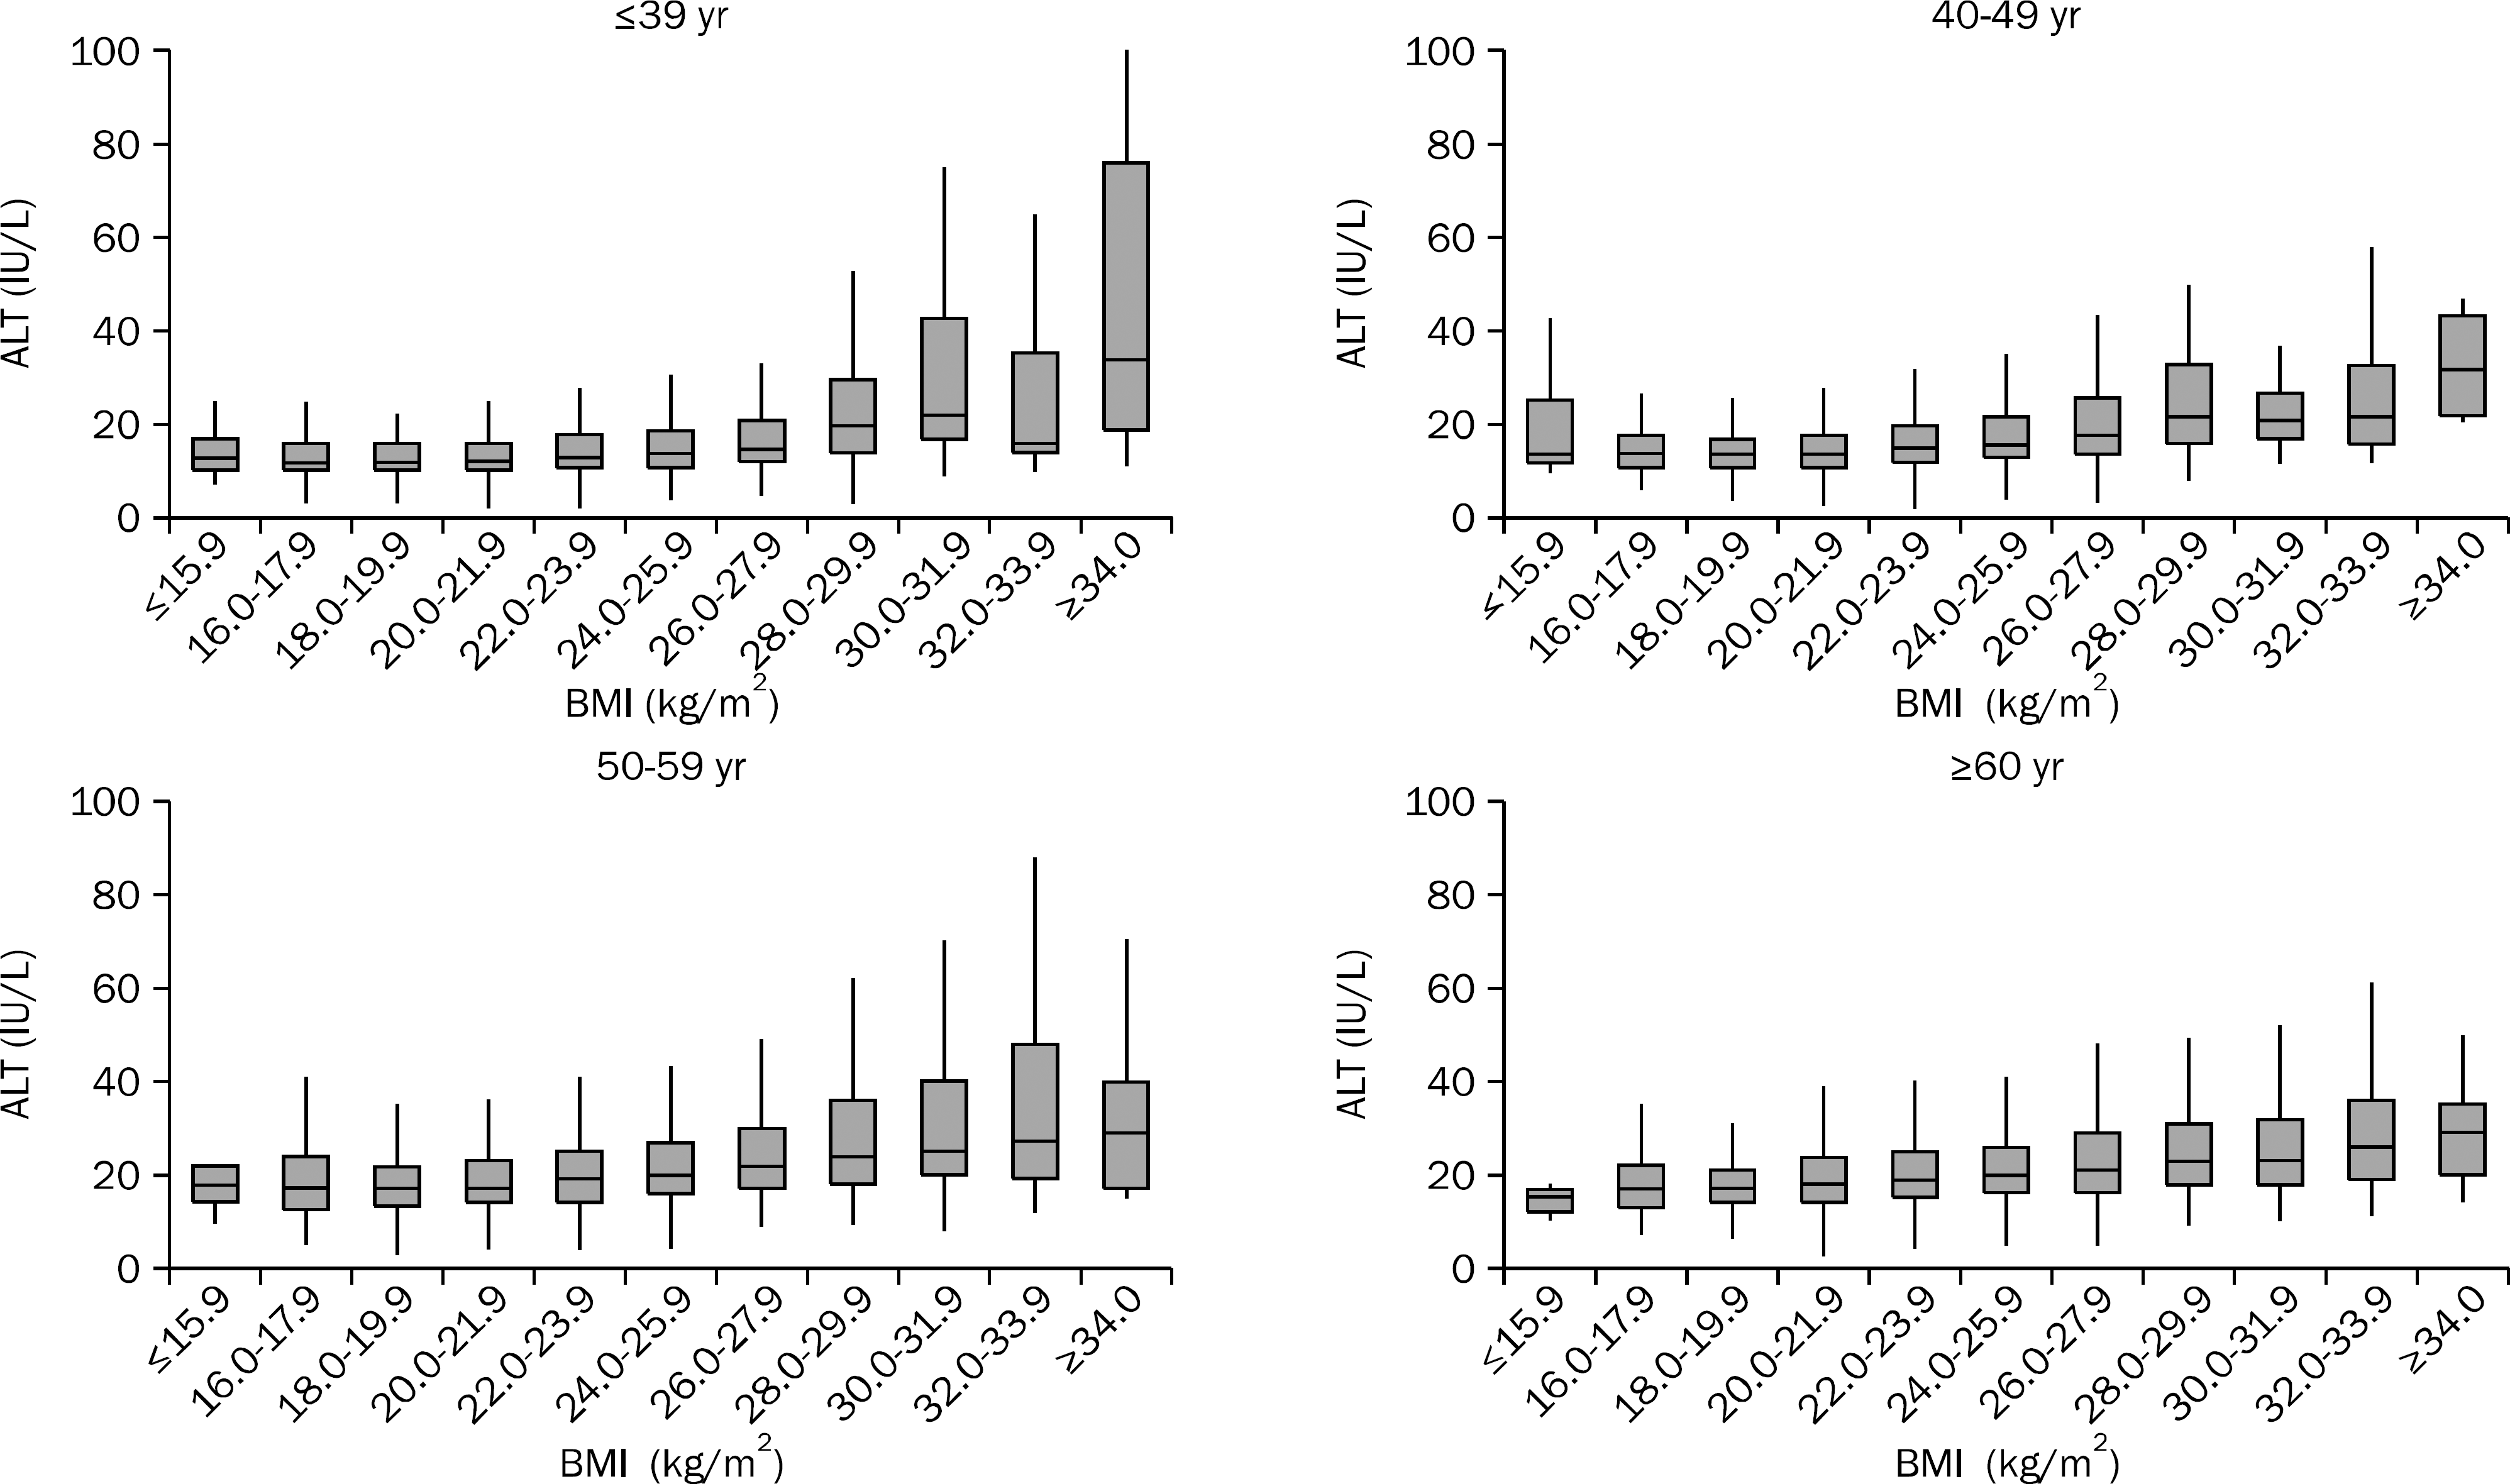 | Fig. 2.The distribution of range of ALT levels according to age and BMI in female subjects. The range of ALT level varied more widely according to the increase in BMI in males than in females, and this finding was more prominent in younger subjects than in older subjects. |
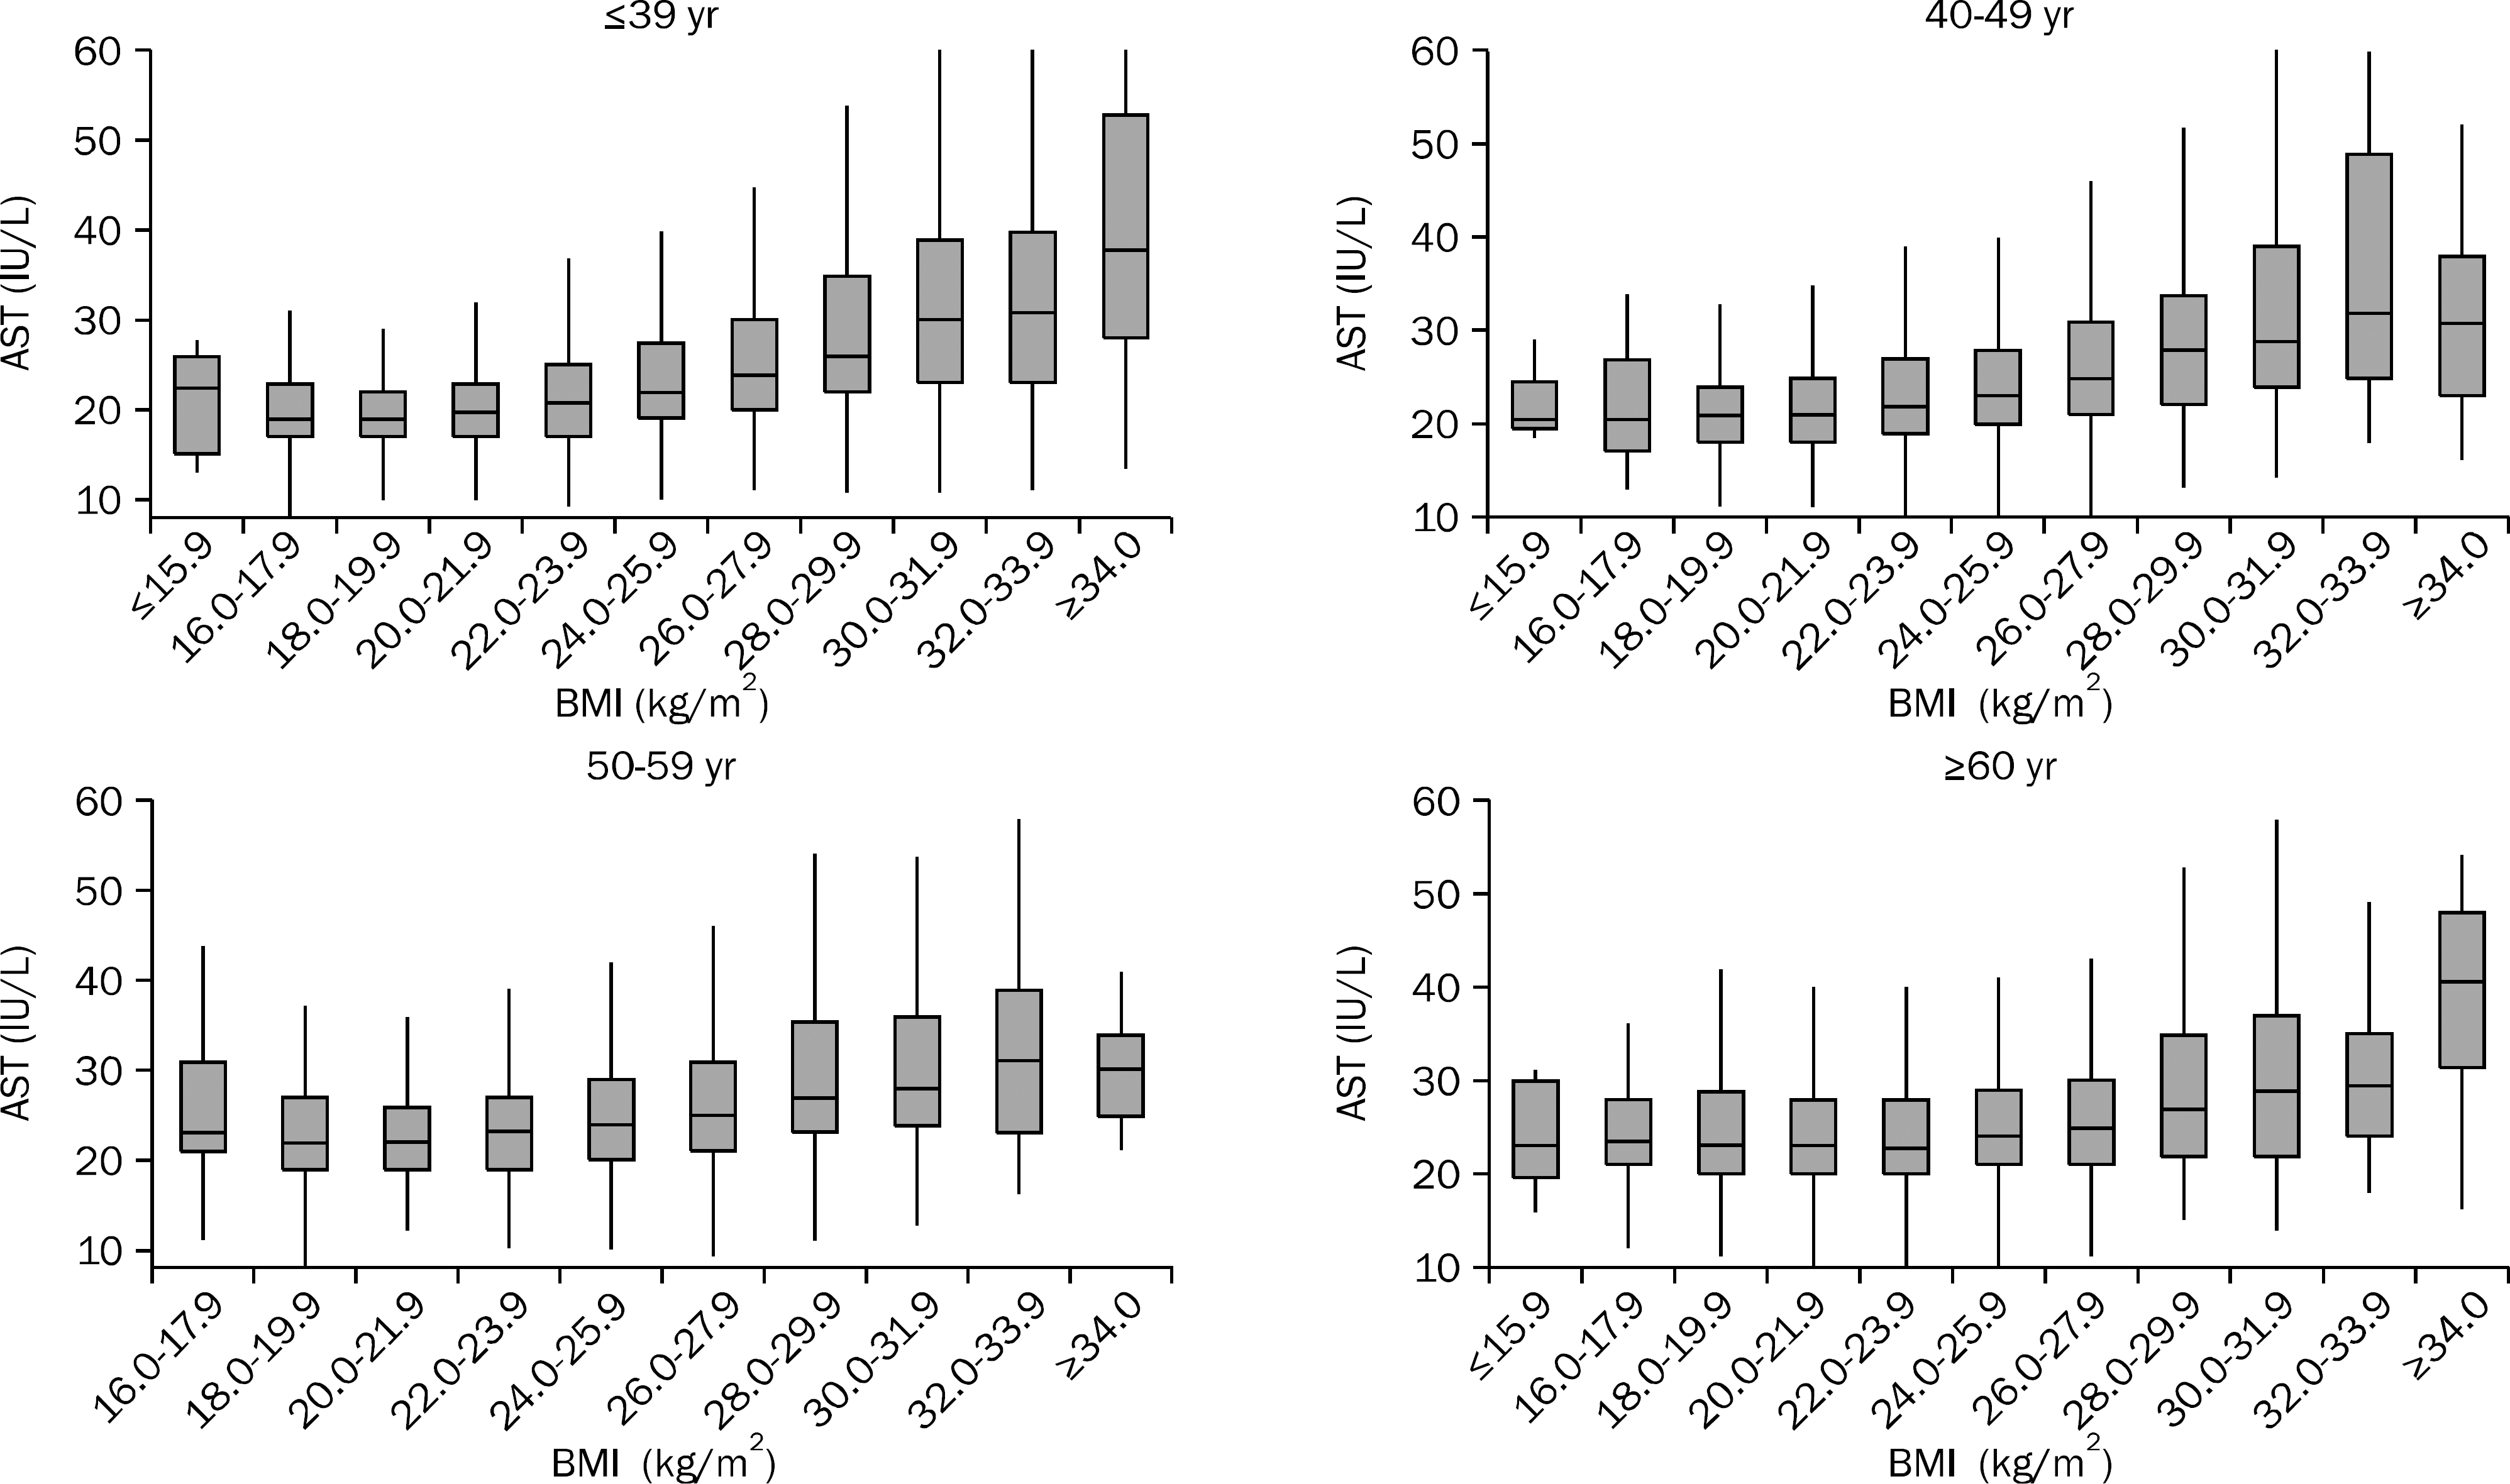 | Fig. 3.The distribution of range of AST levels according to age and BMI in male subjects. The range of AST level varied widely according to the increase in BMI in male subjects, and this finding was more prominent in younger subjects than in older subjects. |
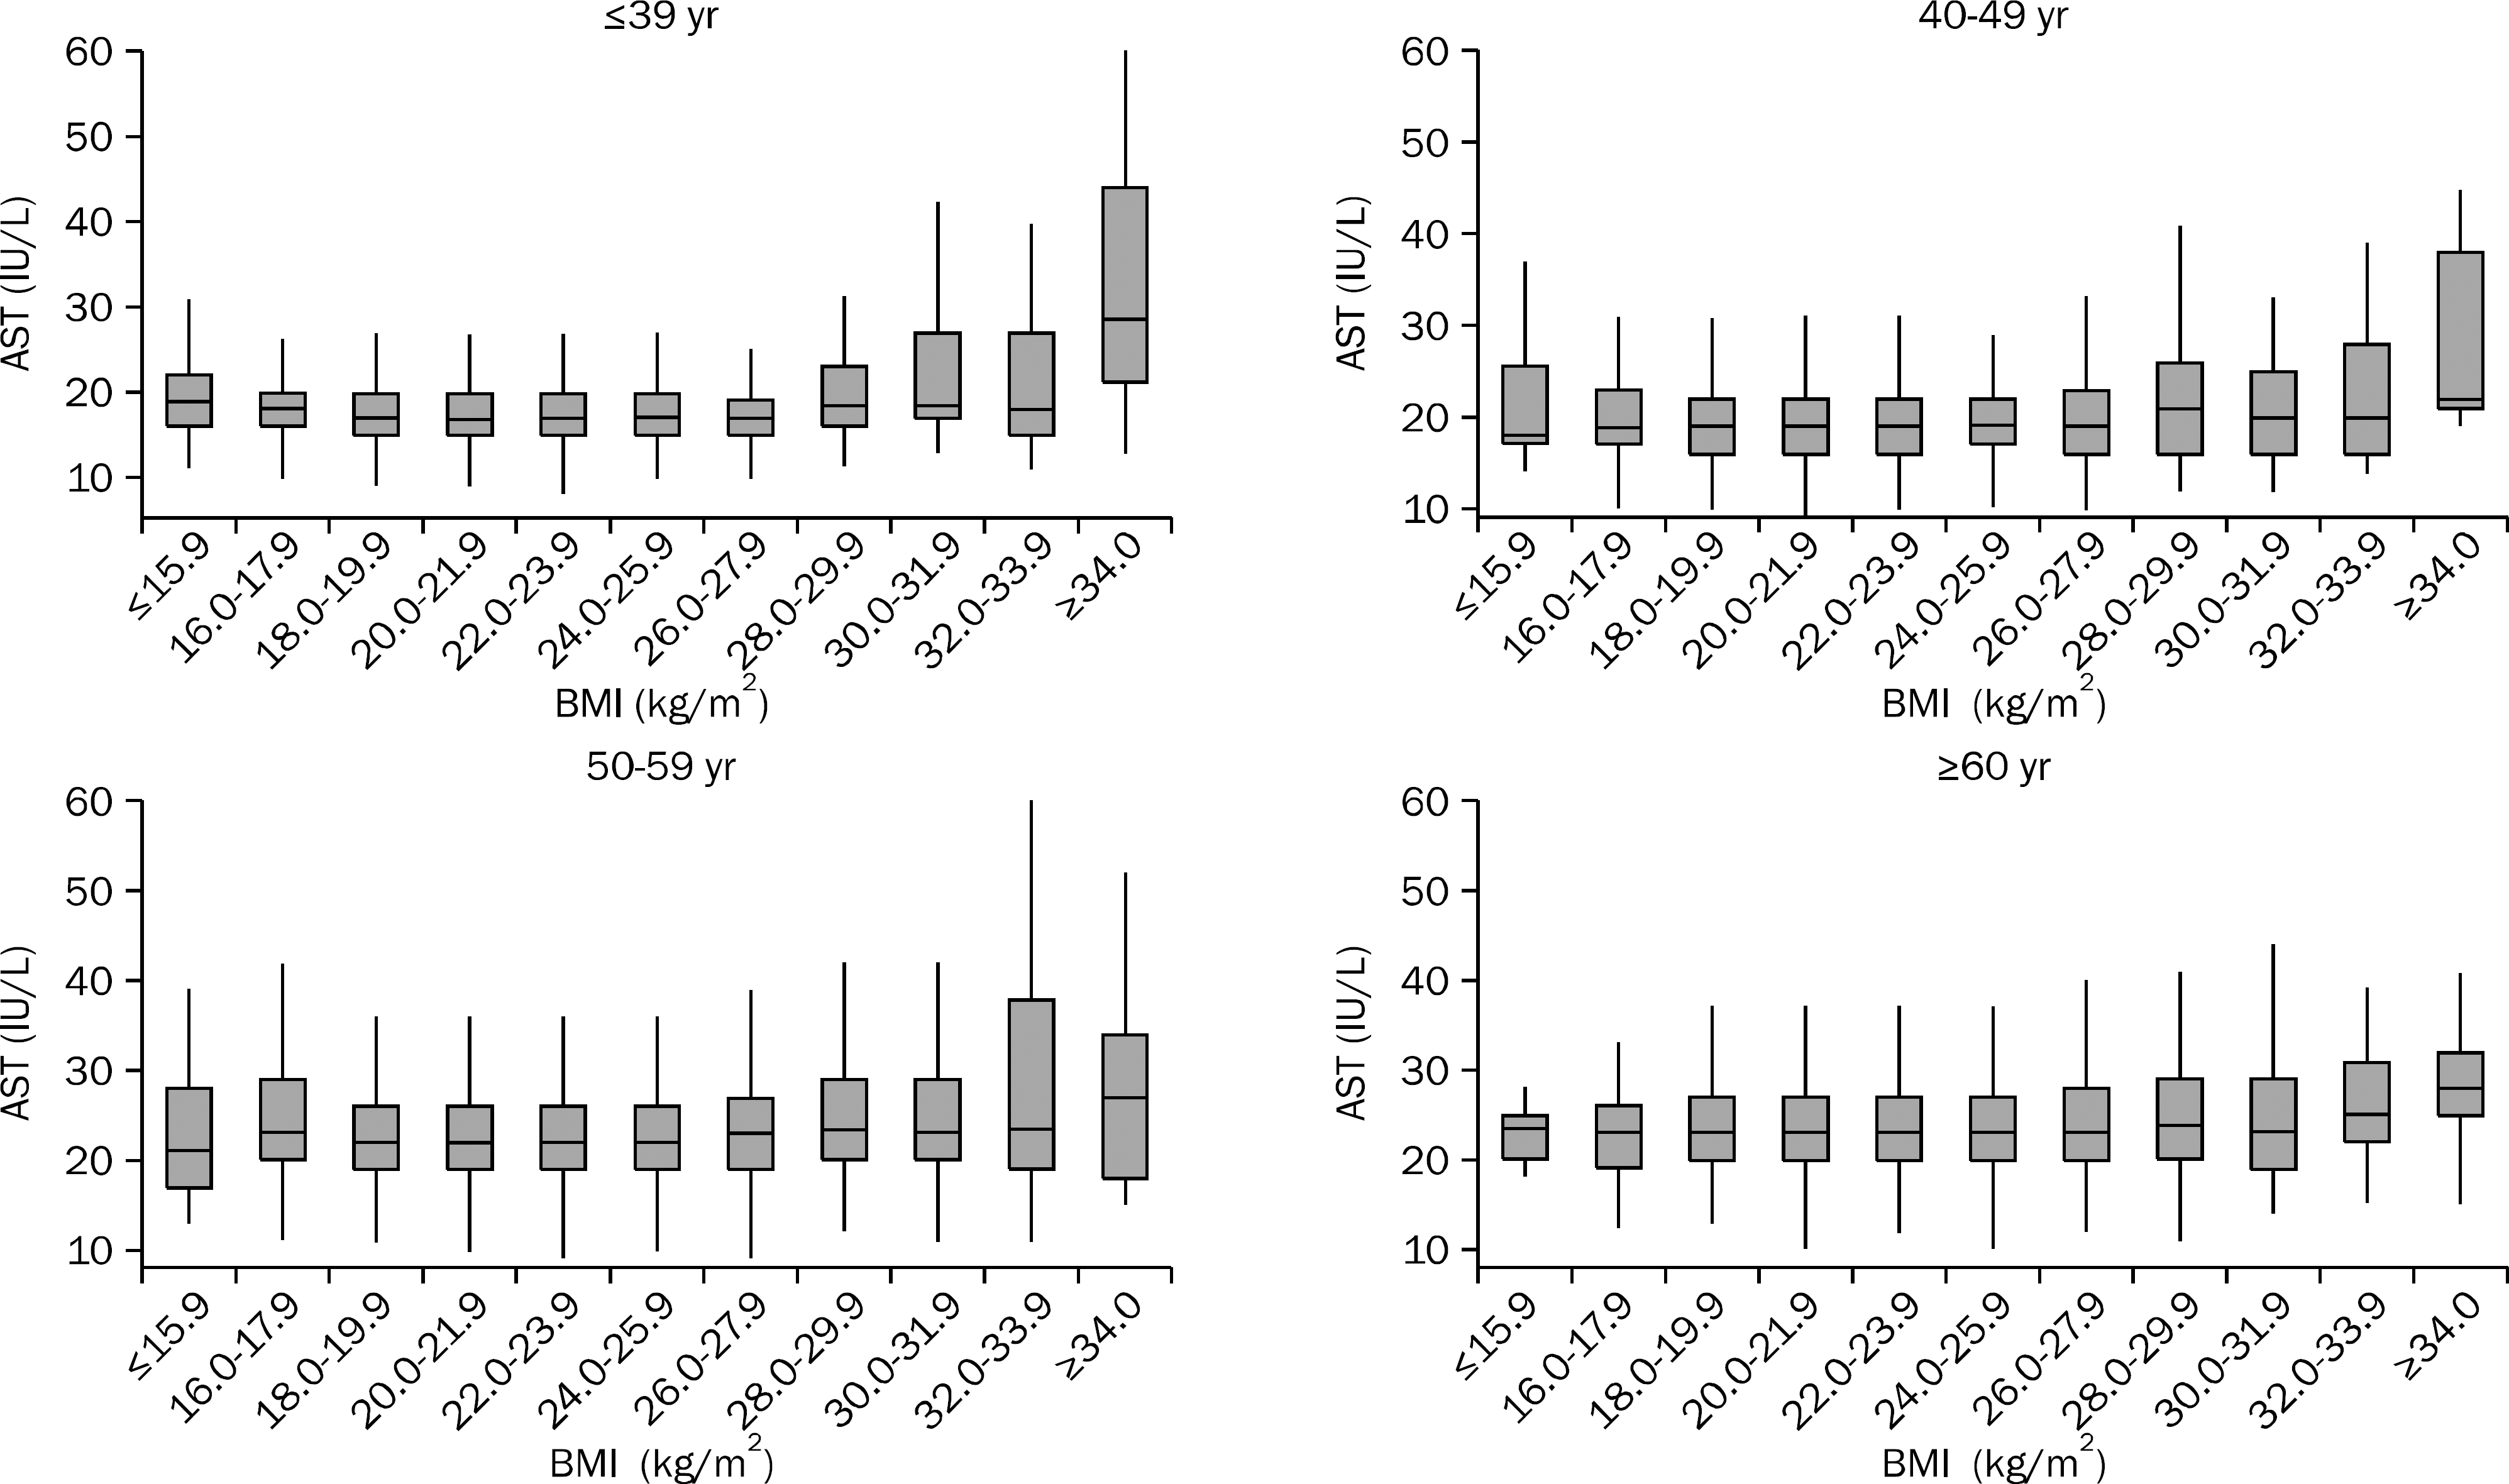 | Fig. 4.The distribution of range of AST levels according to age and BMI in female subjects. |
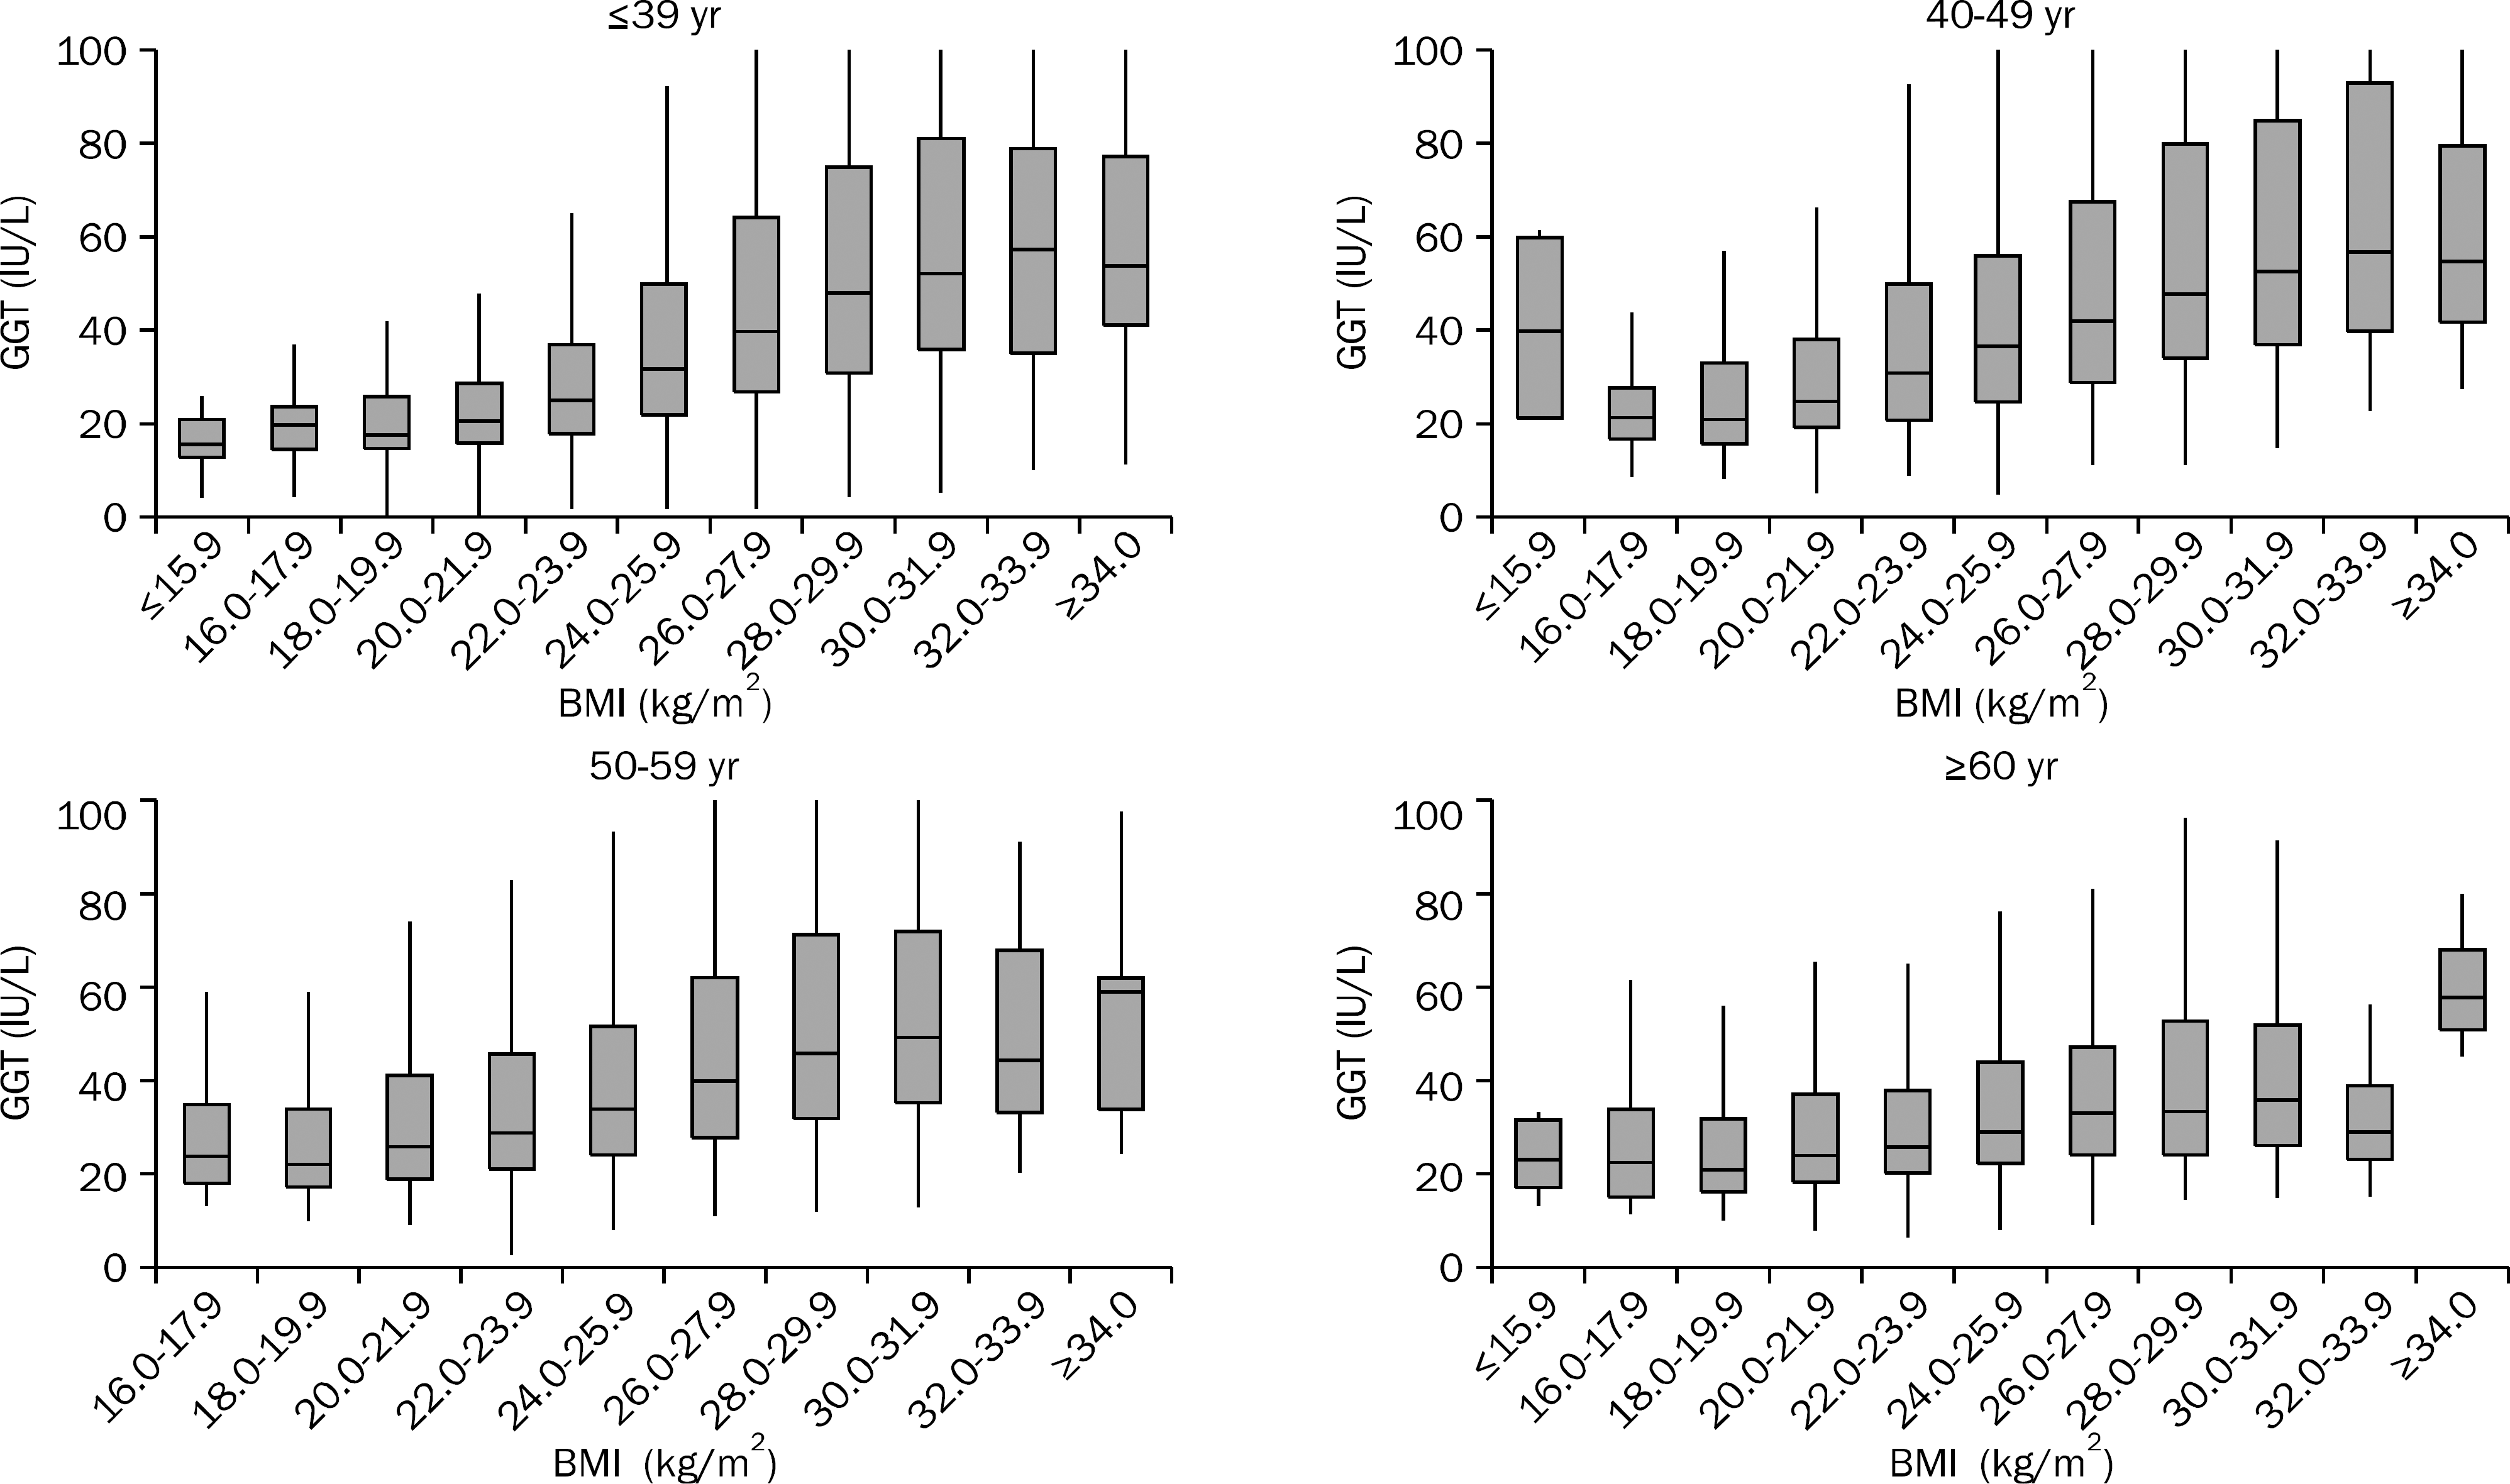 | Fig. 5.The distribution of range of GGT levels according to age and BMI in male subjects. The range of GGT level varied widely according to the increase in BMI, and this finding was more prominent in younger subjects than in older subjects. |
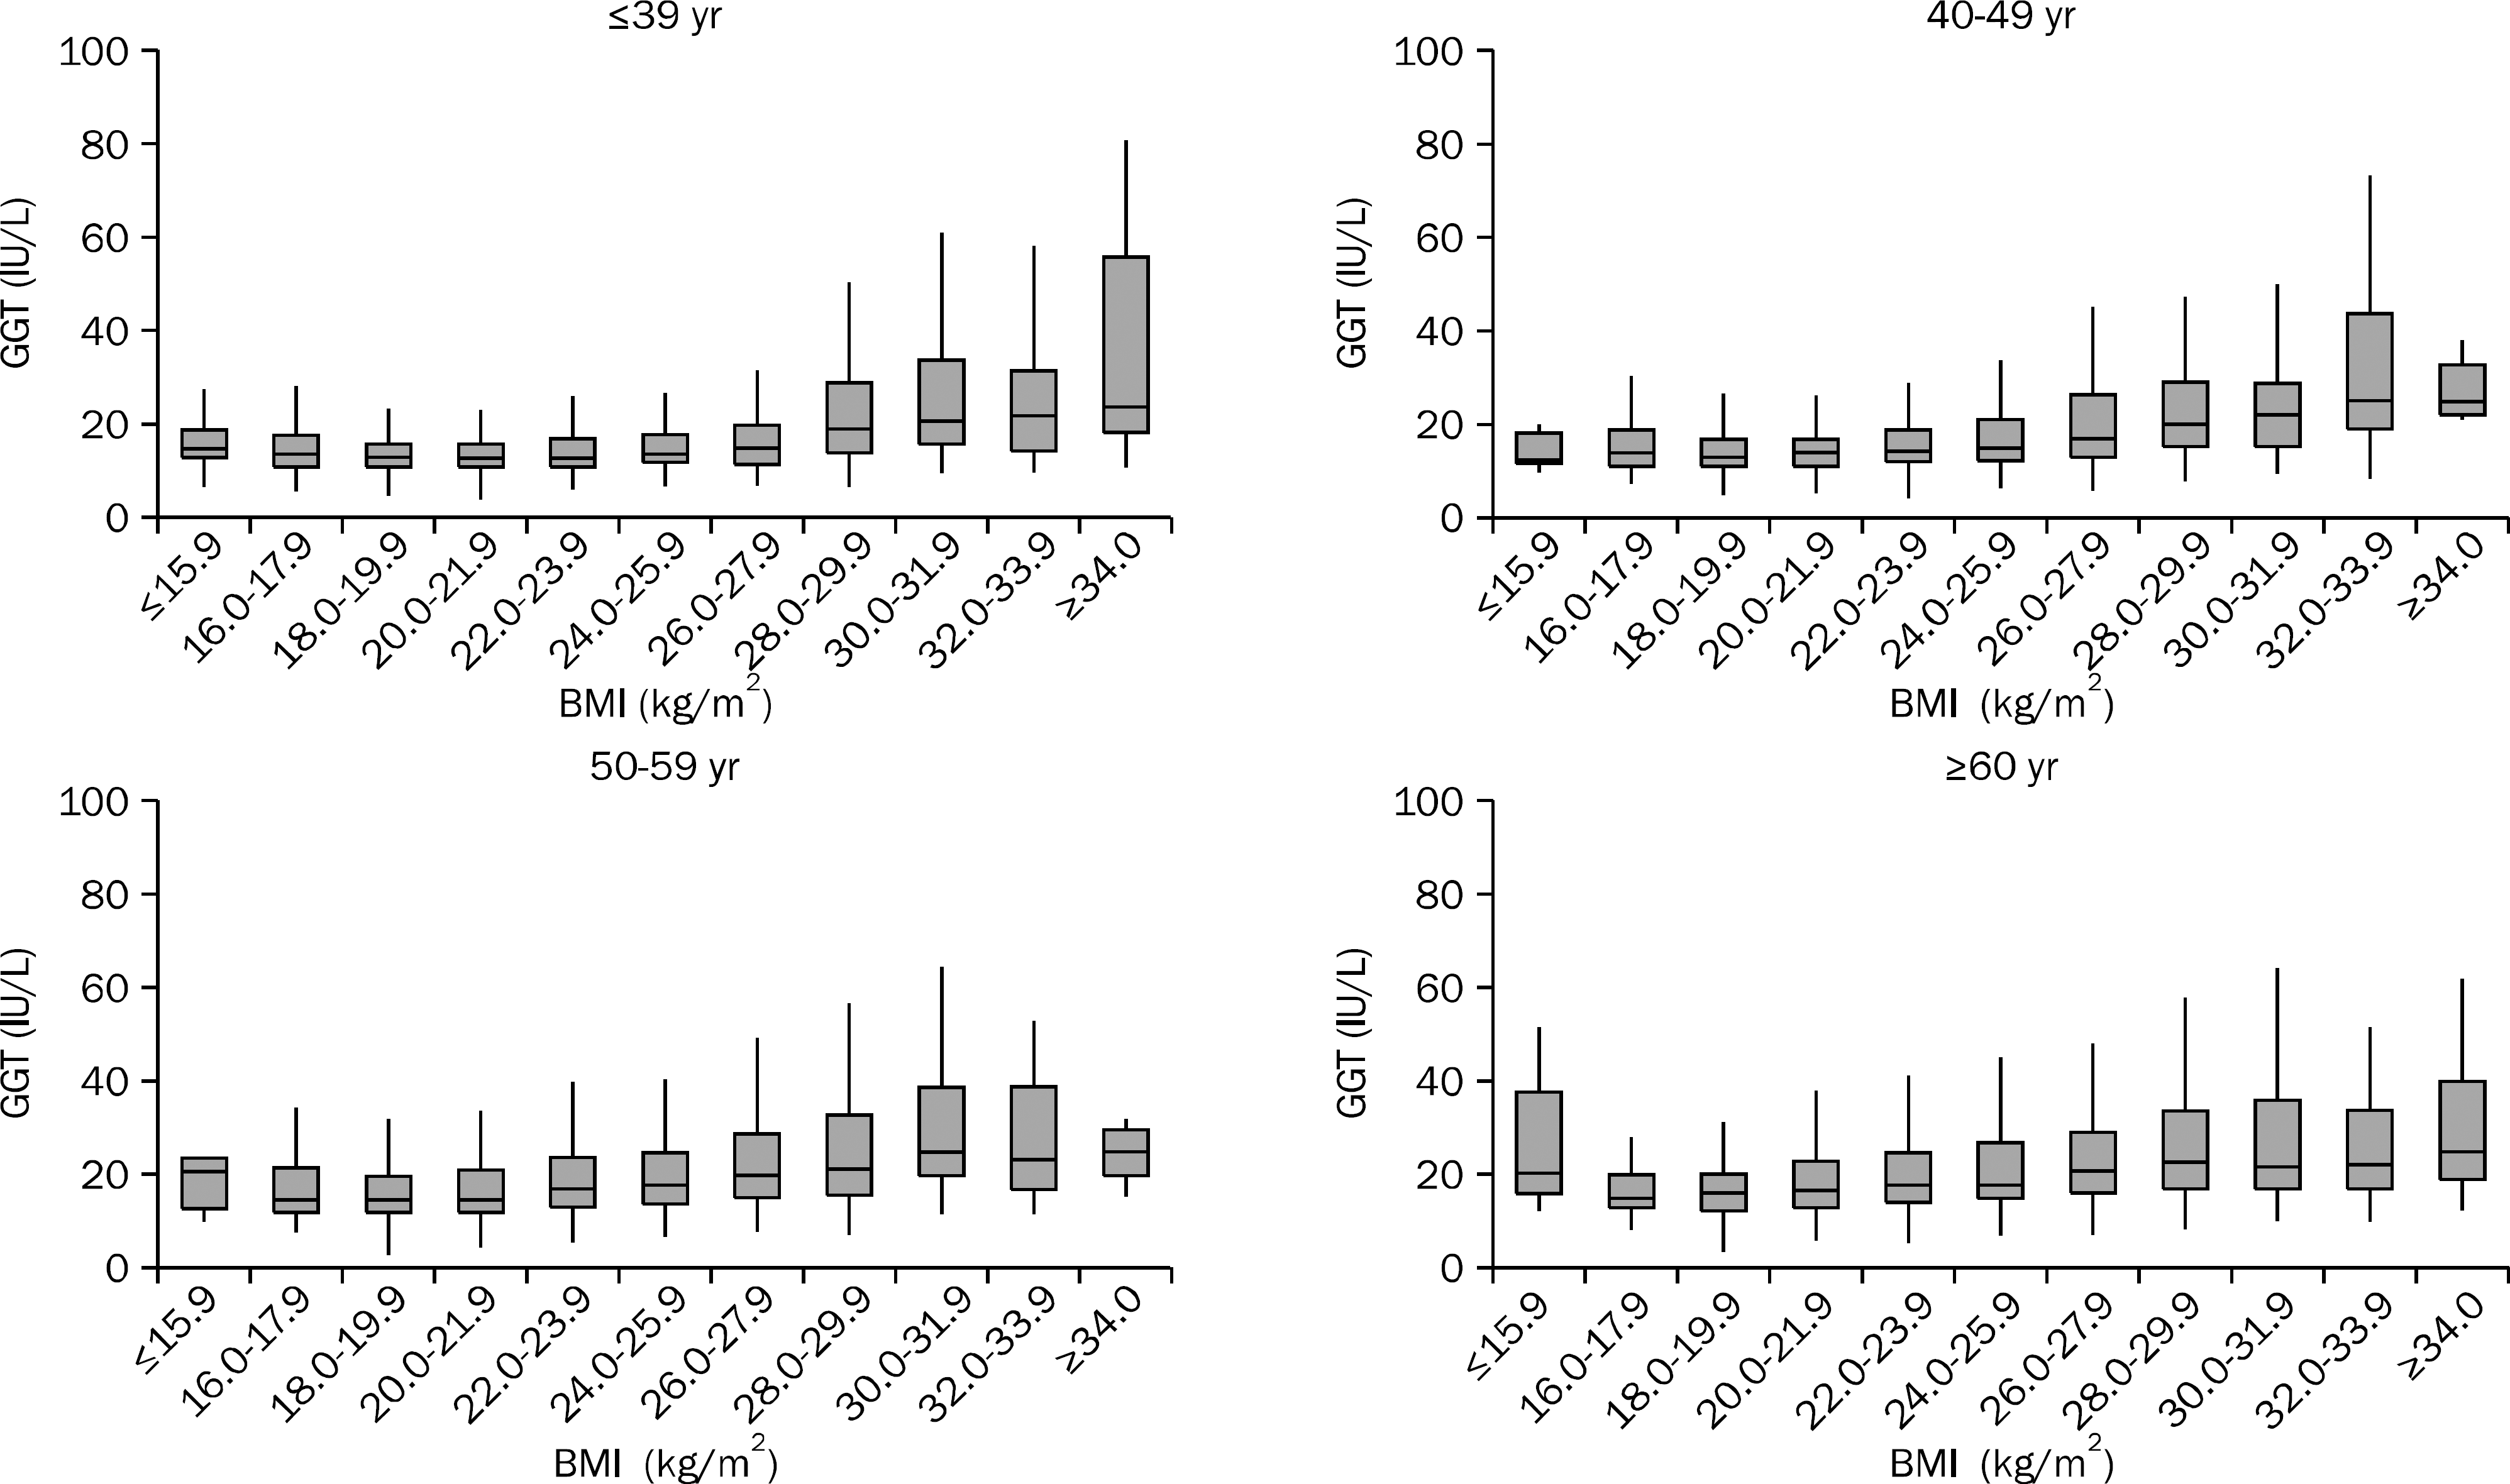 | Fig. 6.The distribution of range of GGT levels according to age and BMI in female subjects. The range of GGT level varied more widely according to the increase in BMI in males than in females, and this finding was more prominent in younger subjects than in older subjects. |
Table 1.
| Characteristic | Total | Males | Females |
|---|---|---|---|
| Subjects (n) | 65,715 | 34,915 | 30,800 |
| Age (yr) a | 47 (38–55) | 47 (39–55) | 47 (38–55) |
| Height (cm) a | 164.8 (158.4-171.1) | 170.6 (166.6-174.5) | 158.2 (154.6-161.9) |
| Body weight (kg) a | 63.0 (54.6-71.9) | 70.7 (65.0-76.9) | 54.6 (50.4-59.5) |
| BMI (kg/m2) a | 23.3 (21.2-25.4) | 24.4 (22.7-26.1) | 21.8 (20.0-23.9) |
| ALT (IU/L) a | 20 (14–30) | 25 (18–36) | 16 (12–21) |
| AST (IU/L) a | 21 (18–26) | 23 (19–29) | 20 (17–24) |
| GGT (IU/L) a | 22 (15–37) | 32 (22–51) | 15 (12–20) |
| Systolic BP (mmHg) a | 116 (106–128) | 120 (111–130) | 111 (102–123) |
| Diastolic BP (mmHg) a | 75 (68–84) | 80 (72–87) | 70 (64–79) |
| Fasting glucose (mg/dL) a | 95 (88–103) | 98 (91–106) | 92 (86–99) |
| Triglyceride (mg/dL) a | 94 (67–138) | 114 (81–165) | 77 (59–107) |
| HDL-cholesterol (mg/dL) a | 53 (44–63) | 48 (41–56) | 59 (50–68) |
| Obesity (BMI ≥25 kg/m2) | 18,749 (28.5) | 13,955 (40.0) | 4,794 (15.6) |
| BP ≥130 / ≥85 mmHg | 20,056 (30.5) | 13,914 (39.9) | 6,142 (19.9) |
| Fasting glucose ≥100 mg/dL | 22,176 (33.7) | 15,316 (43.9) | 6,860 (22.8) |
| Triglycerides ≥150 mg/dL | 13,781 (21.0) | 10,769 (30.8) | 3,012 (9.8) |
| HDL-C <40 mg/dL (male); <50 mg/dL (female) | 13,883 (21.1) | 6,441 (18.5) | 7,442 (24.2) |
Table 2.
|
Age |
BMI |
R-squared c | |||||
|---|---|---|---|---|---|---|---|
| Unstandardized coefficient (SD) a | Standardized coefficient (95% CI) b | p-value | Unstandardized coefficient (SD) a | Standardized coefficient (95% CI) b | p-value | ||
| ALT | −0.00211 (0.00022) | −0.04812 (−0.05775-−0.03849) | <0.0001 | 0.07277 (0.00090) | 0.39591 (0.38629-0.40554) | <0.0001 | 0.1605 |
| AST | 0.00279 (0.00014) | 0.10044 (0.09035-0.11053) | <0.0001 | 0.03086 (0.00060) | 0.26439 (0.25431-0.27448) | <0.0001 | 0.0777 |
| GGT | 0.00102 (0.00027) | 0.01884 (0.00887-0.02881) | 0.0002 | 0.07133 (0.00115) | 0.31547 (0.30550-0.32543) | <0.0001 | 0.0993 |
a Calculated by multivariate regression analysis using log-transformed liver enzyme levels as a dependent variable, and age and BMI as independent variables.
Table 3.
|
Age |
BMI |
R-squared c | |||||
|---|---|---|---|---|---|---|---|
| Unstandardized coefficient (SD) a | Standardized coefficient (95% CI) b | p-value | Unstandardized coefficient (SD) a | Standardized coefficient (95% CI) b | p-value | ||
| ALT | 0.01045 (0.00023) | 0.26233 (0.25115-0.27350) | <0.0001 | 0.03563 (0.00092) | 0.22127 (0.21011-0.23244) | <0.0001 | 0.1646 |
| AST | 0.00872 (0.00014) | 0.35123 (0.33992-0.36254) | <0.0001 | 0.00608 (0.00058) | 0.06053 (0.04922-0.07183) | <0.0001 | 0.1440 |
| GGT | 0.00860 (0.00024) | 0.20698 (0.19544-0.21853) | <0.0001 | 0.03075 (0.00099) | 0.18303 (0.17149-0.19458) | <0.0001 | 0.1069 |
a Calculated by multivariate regression analysis using log-transformed liver enzyme levels as a dependent variable, and age and BMI as independent variables.
Table 4.
| Liver enzyme | Risk factor of metabolic syndrome | Median of liver enzyme levels | Mann-Whitney U-test a |
Slope |
||||
|---|---|---|---|---|---|---|---|---|
| Risk factor for MS positive vs. negative | p-value | Unstandardized coefficient (SD) b | Standardized coefficient (95% CI) c | Variantion inflation factor d | p-value | R-squared e | ||
| ALT | Obesity (BMI≥25 kg/m2) | 31 vs. 22 | −0.0001 | 0.26245 (0.00548) | 0.24616 (0.23608-0.25624) | 1.08482 | −0.0001 | 0.1491 |
| Blood pressure ≥130/≥85 mmHg | 27 vs. 24 | −0.0001 | 0.05968 (0.00546) | 0.05595 (0.04592-0.06598) | 1.07344 | −0.0001 | ||
| Fasting glucose ≥100 mg/dL | 27 vs. 24 | −0.0001 | 0.06216 (0.00548) | 0.05907 (0.04886-0.06927) | 1.11206 | −0.0001 | ||
| Triglycerides ≥150 mg/dL | 31 vs. 23 | −0.0001 | 0.20565 (0.00594) | 0.18187 (0.17156-0.19217) | 1.13342 | −0.0001 | ||
| HDL-cholesterol −40 mg/dL | 29 vs. 24 | −0.0001 | 0.07365 (0.00689) | 0.05470 (0.04468-0.06473) | 1.07173 | −0.0001 | ||
| AST | Obesity (BMI≥25 kg/m2) | 25 vs. 22 | −0.0001 | 0.11608 (0.00363) | 0.17145 (0.16094-0.18195) | 1.08483 | −0.0001 | 0.0761 |
| Blood pressure ≥130/≥85 mmHg | 24 vs. 22 | −0.0001 | 0.04308 (0.00361) | 0.06359 (0.05314-0.07404) | 1.07344 | −0.0001 | ||
| Fasting glucose ≥100 mg/dL | 24 vs. 23 | −0.0001 | 0.02511 (0.00363) | 0.03757 (0.02694-0.04821) | 1.11206 | −0.0001 | ||
| Triglycerides ≥150 mg/dL | 25 vs. 22 | −0.0001 | 0.09288 (0.00393) | 0.12935 (0.11861-0.14008) | 1.13344 | −0.0001 | ||
| HDL-cholesterol −40 mg/dL | 24 vs. 23 | −0.0001 | −0.01500 (0.00456) | −0.01755 (−0.02799-−0.00710) | 1.07173 | 0.001 | ||
| GGT | Obesity (BMI≥25 kg/m2) | 40 vs. 27 | −0.0001 | 0.22062 (0.00661) | 0.16821 (0.15833-0.17809) | 1.08488 | −0.0001 | 0.1828 |
| Blood pressure ≥130/≥85 mmHg | 37 vs. 29 | −0.0001 | 0.12213 (0.00658) | 0.09307 (0.08325-0.10290) | 1.07354 | −0.0001 | ||
| Fasting glucose ≥100 mg/dL | 37 vs. 28 | −0.0001 | 0.16222 (0.00661) | 0.12529 (0.11530-0.13529) | 1.11178 | −0.0001 | ||
| Triglycerides ≥150 mg/dL | 45 vs. 28 | −0.0001 | 0.40950 (0.00717) | 0.29437 (0.28427-0.30447) | 1.13338 | −0.0001 | ||
| HDL-cholesterol −40 mg/dL | 34 vs. 31 | −0.0001 | −0.11024 (0.00830) | −0.06656 (−0.07638-−0.05673) | 1.07178 | −0.0001 | ||
a Mann-Whitney U-test was performed if there were significant differences in the level of liver enzymes according to the existence of each risk factor for metabolic syndrome.
b Calculated by multivariate regression analysis using log-transformed liver enzyme levels as a dependent variable, and age and each risk factor for metabolic syndrome as independent variables.
c Calculated by multivariate regression analysis after standardizing the independent variables to make their variances into 1. Standardized coefficient enables comparison of the effect of independent variables with different units on the dependent variables.
d Variance inflation factor for each risk factor for metabolic syndrome was calculated to quantify the severity of multicollinearity in multivariate regression analysis. There may be no colinearity among the risk factors for metabolic syndrome because variance inflation factor greater than 10 is regarded as suggesting the existence of collinearity.
Table 5.
| Liver enzyme | Risk factor of metabolic syndrome | Median of liver enzyme levels | Mann-Whitney U-test a |
Slope |
||||
|---|---|---|---|---|---|---|---|---|
| Risk factor for MS positive vs. negative | p-value | Unstandardized coefficient (SD) b | Standardized coefficient (95% CI) c | Variantion inflation factor d | p-value | R-squared e | ||
| ALT | Obesity (BMI ≥25 kg/m2) | 20 vs. 15 | −0.0001 | 0.18416 (0.00737) | 0.13896 (0.12806-0.14987) | 1.13875 | −0.0001 | 0.1640 |
| Blood pressure ≥130/≥85 mmHg | 18 vs. 15 | −0.0001 | 0.02197 (0.00680) | 0.01827 (0.00718-0.02936) | 1.17735 | 0.0012 | ||
| Fasting glucose ≥100 mg/dL | 19 vs. 15 | −0.0001 | 0.06556 (0.00647) | 0.05678 (0.04580-0.06775) | 1.15455 | −0.0001 | ||
| Triglycerides ≥150 mg/dL HDL-cholesterol −40 mg/dL | 21 vs. 15 17 vs. 15 | −0.0001 −0.0001 | 0.15030 (0.00906) 0.02409 (0.00617) | 0.09293 (0.08195-0.10390) 0.02146 (0.01068-0.03224) | 1.15399 1.11202 | −0.0001 −0.0001 | ||
| AST | Obesity (BMI ≥25 kg/m2) | 22 vs. 19 | −0.0001 | 0.05057 (0.00464) | 0.06120 (0.05019-0.07221) | 1.13879 | −0.0001 | 0.1482 |
| Blood pressure ≥130/≥85 mmHg | 21 vs. 19 | −0.0001 | 0.01047 (0.00428) | 0.01397 (0.00277-0.02516) | 1.17733 | 0.0145 | ||
| Fasting glucose ≥100 mg/dL | 21 vs. 19 | −0.0001 | 0.00037728 (0.00407) | 0.00052397 (–0.01055-0.01160) | 1.15442 | 0.9261 | ||
| Triglycerides ≥150 mg/dL | 22 vs. 19 | −0.0001 | 0.05487 (0.00570) | 0.05440 (0.04333-0.06548) | 1.15387 | −0.0001 | ||
| HDL-cholesterol −40 mg/dL | 20 vs. 19 | −0.0001 | −0.02418 (0.00388) | −0.03456 (–0.04543-–0.02368) | 1.11193 | −0.0001 | ||
| GGT | Obesity (BMI ≥25 kg/m2) | 19 vs. 14 | −0.0001 | 0.15822 (0.00782) | 0.11440 (0.10331-0.12548) | 1.13866 | −0.0001 | 0.1355 |
| Blood pressure ≥130/≥85 mmHg | 17 vs. 14 | −0.0001 | 0.04232 (0.00722) | 0.03372 (0.02245-0.04500) | 1.17742 | −0.0001 | ||
| Fasting glucose ≥100 mg/dL | 18 vs. 14 | −0.0001 | 0.12433 (0.00686) | 0.10317 (0.09202-0.11433) | 1.15418 | −0.0001 | ||
| Triglycerides ≥150 mg/dL | 21 vs. 15 | −0.0001 | 0.24552 (0.00961) | 0.14545 (0.13430-0.15661) | 1.15371 | −0.0001 | ||
| HDL-cholesterol −40 mg/dL | 16 vs. 15 | −0.0001 | −0.00639 (0.00655) | −0.00545 (–0.01641-0.00550) | 1.11200 | 0.3293 | ||
a Mann-Whitney U-test was performed if there were significant differences in the level of liver enzymes according to the existence of each risk factor for metabolic syndrome.
b Calculated by multivariate regression analysis using log-transformed liver enzyme levels as a dependent variable, and age and each risk factor for metabolic syndrome as independent variables.
c Calculated by multivariate regression analysis after standardizing the independent variables to make their variances into 1. Standardized coefficient enables comparison of the effect of independent variables with different units on the dependent variables.
d Variance inflation factor for each risk factor for metabolic syndrome was calculated to quantify the severity of multicollinearity in multivariate regression analysis. There may be no colinearity among the risk factors for metabolic syndrome because variance inflation factor greater than 10 is regarded as suggesting the existence of collinearity.


 PDF
PDF ePub
ePub Citation
 Print
Print


 XML Download