Abstract
Background/Aims
Differentiating subepithelial tumor (SET) from non-neoplastic gastrointestinal subepithelial lesion (SEL) and gastrointestinal stromal tumor (GIST) from leiomyoma are very important for proper management. This study was conducted to analyze factors that could predict the presence of SET and GIST in patients with upper gastrointestinal (UGI) SELs.
Methods
A total of 527 patients were diagnosed with UGI SELs endosonographically at Gyeongsang National University Hospital from January 2008 to June 2013. Among these patients, histologic diagnosis was made in 84 patients. Data were collected by retrospectively reviewing the medical records. Variables that could differentiate neoplastic from non-neoplastic SELs and GIST from leiomyoma were analyzed.
Results
Among 84 patients with SELs, 64 (76.2%) had SETs including GIST (42.9%) and leiomyoma (19.0%). The patients’ mean age (p=0.047), peak age distribution (p=0.047), proportions of patient ≥50 years (p=0.015), and number of proper muscle-originated lesions (p=0.001) were higher in neoplastic than non-neoplastic group. There were no significant differences in gender (p=0.195), size (p=0.266) and echogenicity (p=0.051) of the lesions. Older age (57.7 vs. 47.0 years, p=0.049), age ≥50 years (p=0.016), location in gastric body (p<0.001), and proper muscle origin (p=0.003) were significantly related to the presence of GIST compared to leiomyoma. Multiple regression analysis showed that the patients’ age ≥50 years, size ≥30 mm, and proper muscle-origin of lesion were independent predictors of SET; however, there were no predictive factors that could differentiate GIST from leiomyoma.
Conclusions
In patients with SEL, the possibility of having SET should be considered for patients ≥50 years with UGI SELs ≥30 mm that arise from the proper muscle. Thorough monitoring and aggressive management is warranted for those with gastric muscular SET since factors predictive of GIST are lacking.
Go to : 
References
1. Hwang JH, Kimmey MB. The incidental upper gastrointestinal subepithelial mass. Gastroenterology. 2004; 126:301–307.

2. Kim SG. Incidental gastrointestinal subepithelial mass. Korean J Gastroenterol. 2010; 56:341–345.

3. Rösch T. Endoscopic ultrasonography in upper gastrointestinal submucosal tumors: a literature review. Gastrointest Endosc Clin N Am. 1995; 5:609–614.

4. Boyce GA, Sivak MV Jr, Rösch T, et al. Evaluation of submucosal upper gastrointestinal tract lesions by endoscopic ultrasound. Gastrointest Endosc. 1991; 37:449–454.

5. Heo JH, Roe IH, Lee MI, et al. Endosonographic criteria for differ-ential diagnosis between benign and malignant stromal cell tumor in gastroduodenum. Korean J Gastroenterol. 1999; 34:593–600.
6. Aibe T, Fuji T, Okita K, Takemoto T. A fundamental study of normal layer structure of the gastrointestinal wall visualized by endoscopic ultrasonography. Scand J Gastroenterol Suppl. 1986; 123:6–15.

7. Kwon JG, Kim EY, Kim YS, et al. Accuracy of endoscopic ultrasonographic impression compared with pathologic diagnosis in gastrointestinal submucosal tumors. Korean J Gastroenterol. 2005; 45:88–96.
8. Sato T, Peiper M, Fritscher-Ravens A, Gocht A, Soehendra N, Knoefel WT. Strategy of treatment of submucosal gastric tumors. Eur J Med Res. 2005; 10:292–295.
9. Shin SK, Chung JW, Lee JH, et al. Prevalence and predictive factors of malignant potential in resected gastric subepithelial tumors. Korean J Helicobacter Up Gastrointest Res. 2013; 13:104–108.

10. The Information Committee of the Korean Gastric Cancer Association. 2005∼2006 Nationwide gastric submucosal tumor report in Korea. J Korean Gastric Cancer Assoc. 2008; 8:104–109.
11. Hwang JH, Saunders MD, Rulyak SJ, Shaw S, Nietsch H, Kimmey MB. A prospective study comparing endoscopy and EUS in the evaluation of GI subepithelial masses. Gastrointest Endosc. 2005; 62:202–208.

13. Martin TR, Onstad GR, Silvis SE, Vennes JA. Lift and cut biopsy technique for submucosal sampling. Gastrointest Endosc. 1976; 23:29–30.

14. Yasuda K, Nakajima M, Kawai K. Endoscopic ultrasonography in the diagnosis of submucosal tumor of the upper digestive tract. Scand J Gastroenterol Suppl. 1986; 123:59–67.

15. Kojima T, Takahashi H, Parra-Blanco A, Kohsen K, Fujita R. Diagnosis of submucosal tumor of the upper GI tract by endoscopic resection. Gastrointest Endosc. 1999; 50:516–522.

16. Chak A, Canto MI, Rösch T, et al. Endosonographic differentiation of benign and malignant stromal cell tumors. Gastrointest Endosc. 1997; 45:468–473.

17. Kim HG, Ryu SY, Yun SK, Joo JK, Lee JH, Kim DY. Preoperative predictors of malignant gastric submucosal tumor. J Korean Surg Soc. 2012; 83:83–87.

18. Fletcher CD, Berman JJ, Corless C, et al. Diagnosis of gastrointestinal stromal tumors: a consensus approach. Hum Pathol. 2002; 33:459–465.

19. Miettinen M, Majidi M, Lasota J. Pathology and diagnostic criteria of gastrointestinal stromal tumors (GISTs): a review. Eur J Cancer. 2002; 38(Suppl 5):S39–S51.

20. Polkowski M. Endoscopic ultrasound and endoscopic ultrasound-guided fine-needle biopsy for the diagnosis of malignant submucosal tumors. Endoscopy. 2005; 37:635–645.

21. Trupiano JK, Stewart RE, Misick C, Appelman HD, Goldblum JR. Gastric stromal tumors: a clinicopathologic study of 77 cases with correlation of features with nonaggressive and aggressive clinical behaviors. Am J Surg Pathol. 2002; 26:705–714.
Go to : 
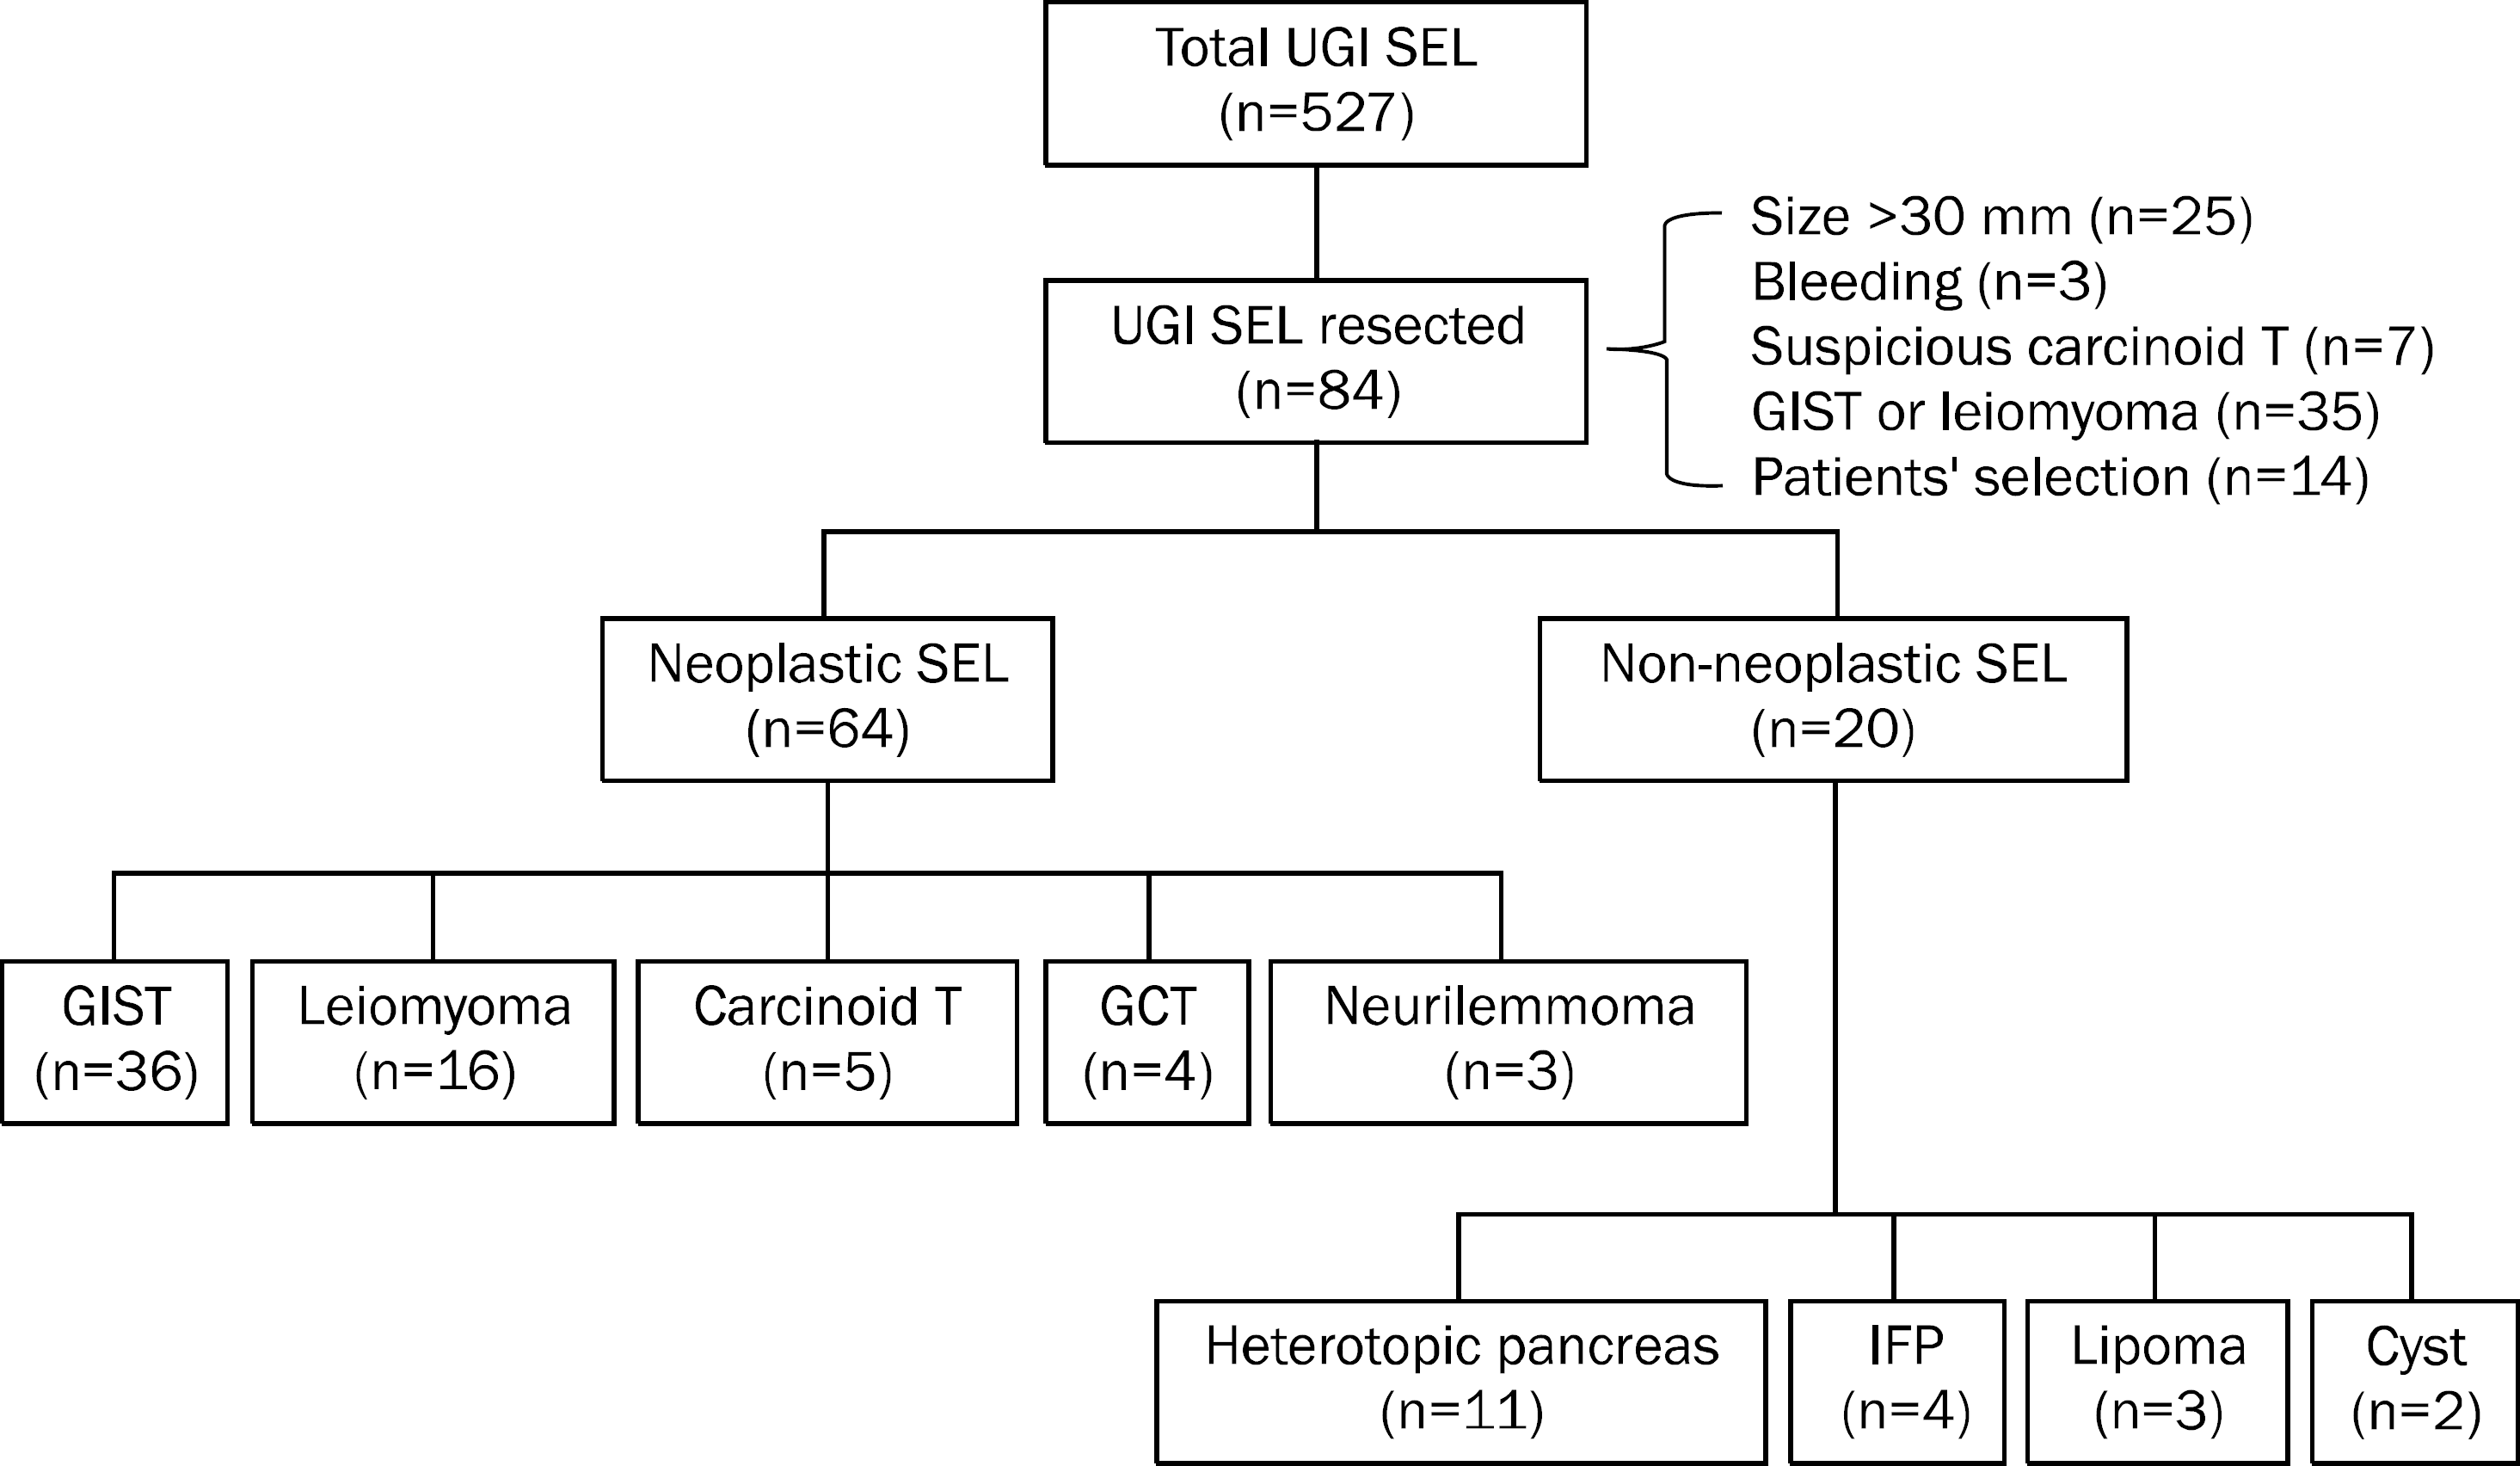
 | Fig. 1.Flow chart of patients with upper gastrointestinal subepitelial lesion. Among a total 527 patients with upper gastrointestinal (UGI) subepithelial lesion (SEL) evaluated endosonographically, 84 underwent endoscopic or surgical resection of the lesion and confirmative histological diagnosis was made. Sixty-four (76.2%) patients had neoplastic lesions (subepithelial tumor) including gastrointestinal stromal tumor (GIST), leiomyoma, carcinoid tumor, granular cell tumor (GCT), and neurilemmo-ma. The remaining 20 patients had non-neoplastic lesions such as hete-rotopic pancreas, inflammatory fibroid polyp (IFP), lipoma, and cyst. |
Table 1.
Baseline Characteristics of All Patients with Upper Gastrointestinal (UGI) Subepithelial Lesions (SEL) and Those with Histologically Confirmed Upper UGI SEL
Table 2.
Histologic Diagnosis and Location of 84 Patients with Upper Gastrointestinal Subepithelial Lesions
Table 3.
Comparison of Clinical and Ultrasonographic Characteristics of Neoplastic and Non-neoplastic Subepithelial Lesions
Table 4.
Univariate and Multivariate Analysis on Predictive Factors That Could Differentiate Neoplastic from Non-neoplastic Subepithelial Lesions
Table 5.
Comparison of the Clinical and Ultrasonographic Characteristics of Gastrointestinal Stromal Tumor (GIST) and Leiomyoma
Table 6.
Univariate and Multivariate Analysis on Predictive Factors That Could Differentiate Gastrointestinal Stromal Tumor from Leiomyoma


 PDF
PDF ePub
ePub Citation
 Print
Print


 XML Download