

 PDF
PDF ePub
ePub Citation
 Print
Print


Abstract
Background/Aims
It has been known that elderly patients with gastric cancer show worse general condition and higher comorbidities. Therefore, few elderly patients undergo surgery. This study was designed to determine clinicopathological characteristics of gastric cancer in elderly patients and evaluate their survival improvements by the surgical treatment.
Methods
Gastric cancer patients, diagnosed at Ewha Womans University Mokdong Hospital between 2000 to 2004, were divided into two groups those aged ≥65 years vs. <65 years. Clinicopathological characteristics, incidence of postoperative complications, and survival time of patients in each group were analyzed.
Results
Total 370 patients were subjected and divided into the elderly and the younger group (55.4% vs. 44.6%). The elderly group showed higher incidences of hypertension and cardiovascular disease. Well differentiated adenocarcinoma was more frequently found in the elderly group (19.0% vs. 10.0%, p=0.025). There were no differences of operation time (242.6±70.7 vs. 257.3±83.8 min, p=0.115), postoperative hospital stays (15.8±10.6 vs. 14.7±9.8 days, p=0.361), and incidence of any complications (6.7% vs. 9.9%, p=0.309) between the two subgroups. The significant factors related with the elderly patient's survival were the tumor-node-metastasis (TNM) stage (stage I, hazard ratio [HR] 1.00; stage II, HR 1.28, 95% confidence interval [CI] 0.44-3.72; stage III, HR 4.06, 95% CI 2.08-7.92, stage IV, HR 9.78, 95% CI 4.97-19.26; p<0.001) and the treatment modality (laparoscopy, HR 1.00; open surgery, HR 3.90, 95% CI 2.43-6.26; p<0.001). The elderly patients who underwent gastric cancer surgery showed prolonged survival on TNM stage I, II, and III than those who were treated conservatively.
Conclusions
In the elderly patients with gastric cancer, those who had received surgical treatments showed significantly higher survival rate than those who had treated conservatively. Therefore, aggressive surgical treatments should be seriously considered even for the elderly patients with gastric cancer.
References
1. Statistics Korea. Annual report on the cause of death statistics. Daejeon: Statistics Korea;2009.
2. Parkin DM, Pisani P, Ferlay J. Estimates of the worldwide incidence of 25 major cancers in 1990. Int J Cancer. 1999; 80:827–841.
3. Right information about cancer/Right understanding cancer. [Internet]. Right information about cancer/Right understanding cancer;2010. [cited 2010 Oct 10]. Available from:. http://www.cancer.go.kr/cms/statics/incidence/index.html.
4. Newcomb PA, Carbone PP. Cancer treatment and age: patient perspectives. J Natl Cancer Inst. 1993; 85:1580–1584.

5. Samet J, Hunt WC, Key C, Humble CG, Goodwin JS. Choice of cancer therapy varies with age of patient. JAMA. 1986; 255:3385–3390.
6. Carvalho R, Milne AN, van Rees BP, et al. Early-onset gastric carcinomas display molecular characteristics distinct from gastric carcinomas occurring at a later age. J Pathol. 2004; 204:75–83.
7. Yokota T, Kunii Y, Saito T, et al. Prognostic factors for gastric cancer in the elderly. Eur J Surg Oncol. 2001; 27:451–453.
8. Miyamoto S, Oota T, Oohashi I, et al. Problems in surgical treatment of carcinoma of the stomach in geriatric patients. J Jpn Surg Soc. 1982; 83:1090–1096.
9. Japanese Gastric Cancer Association. Japanese classification of gastric carcinoma-2nd English edition-. Gastric Cancer. 1998; 1:10–24.
10. ASA physical status classification system. [Internet]. ASA physical status classification system;1995. [updated 2010 Jun 8; cited 2010 Oct 10]. Available from:. http://www.asahq.org/clinical/physicalstatus.html.
11. Sobin LH. TNM classification of malignant tumours. 6th ed.New York: Wiley-Blackwell;2002.
12. Hamilton SR, Aaltonen LA. World Health Organization classification of tumours: Pathology and genetics of tumours of the digestive system. Lyon: IARC Press;2000.
13. Brown MR, Bhattacharyya N, McPheeters GO, McNamara JJ. Surgical resection of gastric cancer in the octogenarian population. J Gastrointest Surg. 1999; 3:561–564.
14. Winslet MC, Mohsen YM, Powell J, Allum WH, Fielding JW. The influence of age on the surgical management of carcinoma of the stomach. Eur J Surg Oncol. 1996; 22:220–224.
15. Yancik R, Havlik RJ, Wesley MN, et al. Cancer and comorbidity in older patients: a descriptive profile. Ann Epidemiol. 1996; 6:399–412.
16. Kim YJ, Lee CH, Paik WH, et al. Clinical and pathologic characteristics of gastric cancer in elderly Korean patients in Korea. Korean J Med. 2007; 72:256–265.
17. Feldman M, Friedman LS, Sleisenger MH. Sleisenger & Fordt-ran's gastrointestinal and liver disease: pathophysiology, diagnosis, management. 7th ed.Philadelphia: Saunders;2002.
18. Kwon SJ, Choi DH, Park YS, et al. Comparative studies on clinicopathologic charicteristics and surgical results in senile and young patients with gastric cancer. J Korean Surg Soc. 1997; 52:535–542.
19. Kang WS, Cheong O, Jeong MR, et al. Evaluation of the safety and feasibility of D2 lymphadenectomy in elderly patients with gastric cancer. J Korean Gastric Cancer Assoc. 2008; 8:85–90.
20. Kim HG, Lee CH, Choi KH, Lee SD, Seo JK. Clinical analysis of surgery in the elderly. J Korean Surg Soc. 1990; 39:792–799.
21. Gosain A, DiPietro LA. Aging and wound healing. World J Surg. 2004; 28:321–326.
22. Kubota H, Kotoh T, Dhar DK, et al. Gastric resection in the aged (> or = 80 years) with gastric carcinoma: a multivariate analysis of prognostic factors. Aust N Z J Surg. 2000; 70:254–257.
23. Jentschura D, Winkler M, Tsuji Y, Hagmüller E. Results of surgical therapy of stomach carcinoma in the elderly. Chirurg. 1997; 68:503–508.
24. Monson K, Litvak DA, Bold RJ. Surgery in the aged population: surgical oncology. Arch Surg. 2003; 138:1061–1067.
Fig. 1.
Age distribution of the patients and difference of treatment modality according to age distribution.
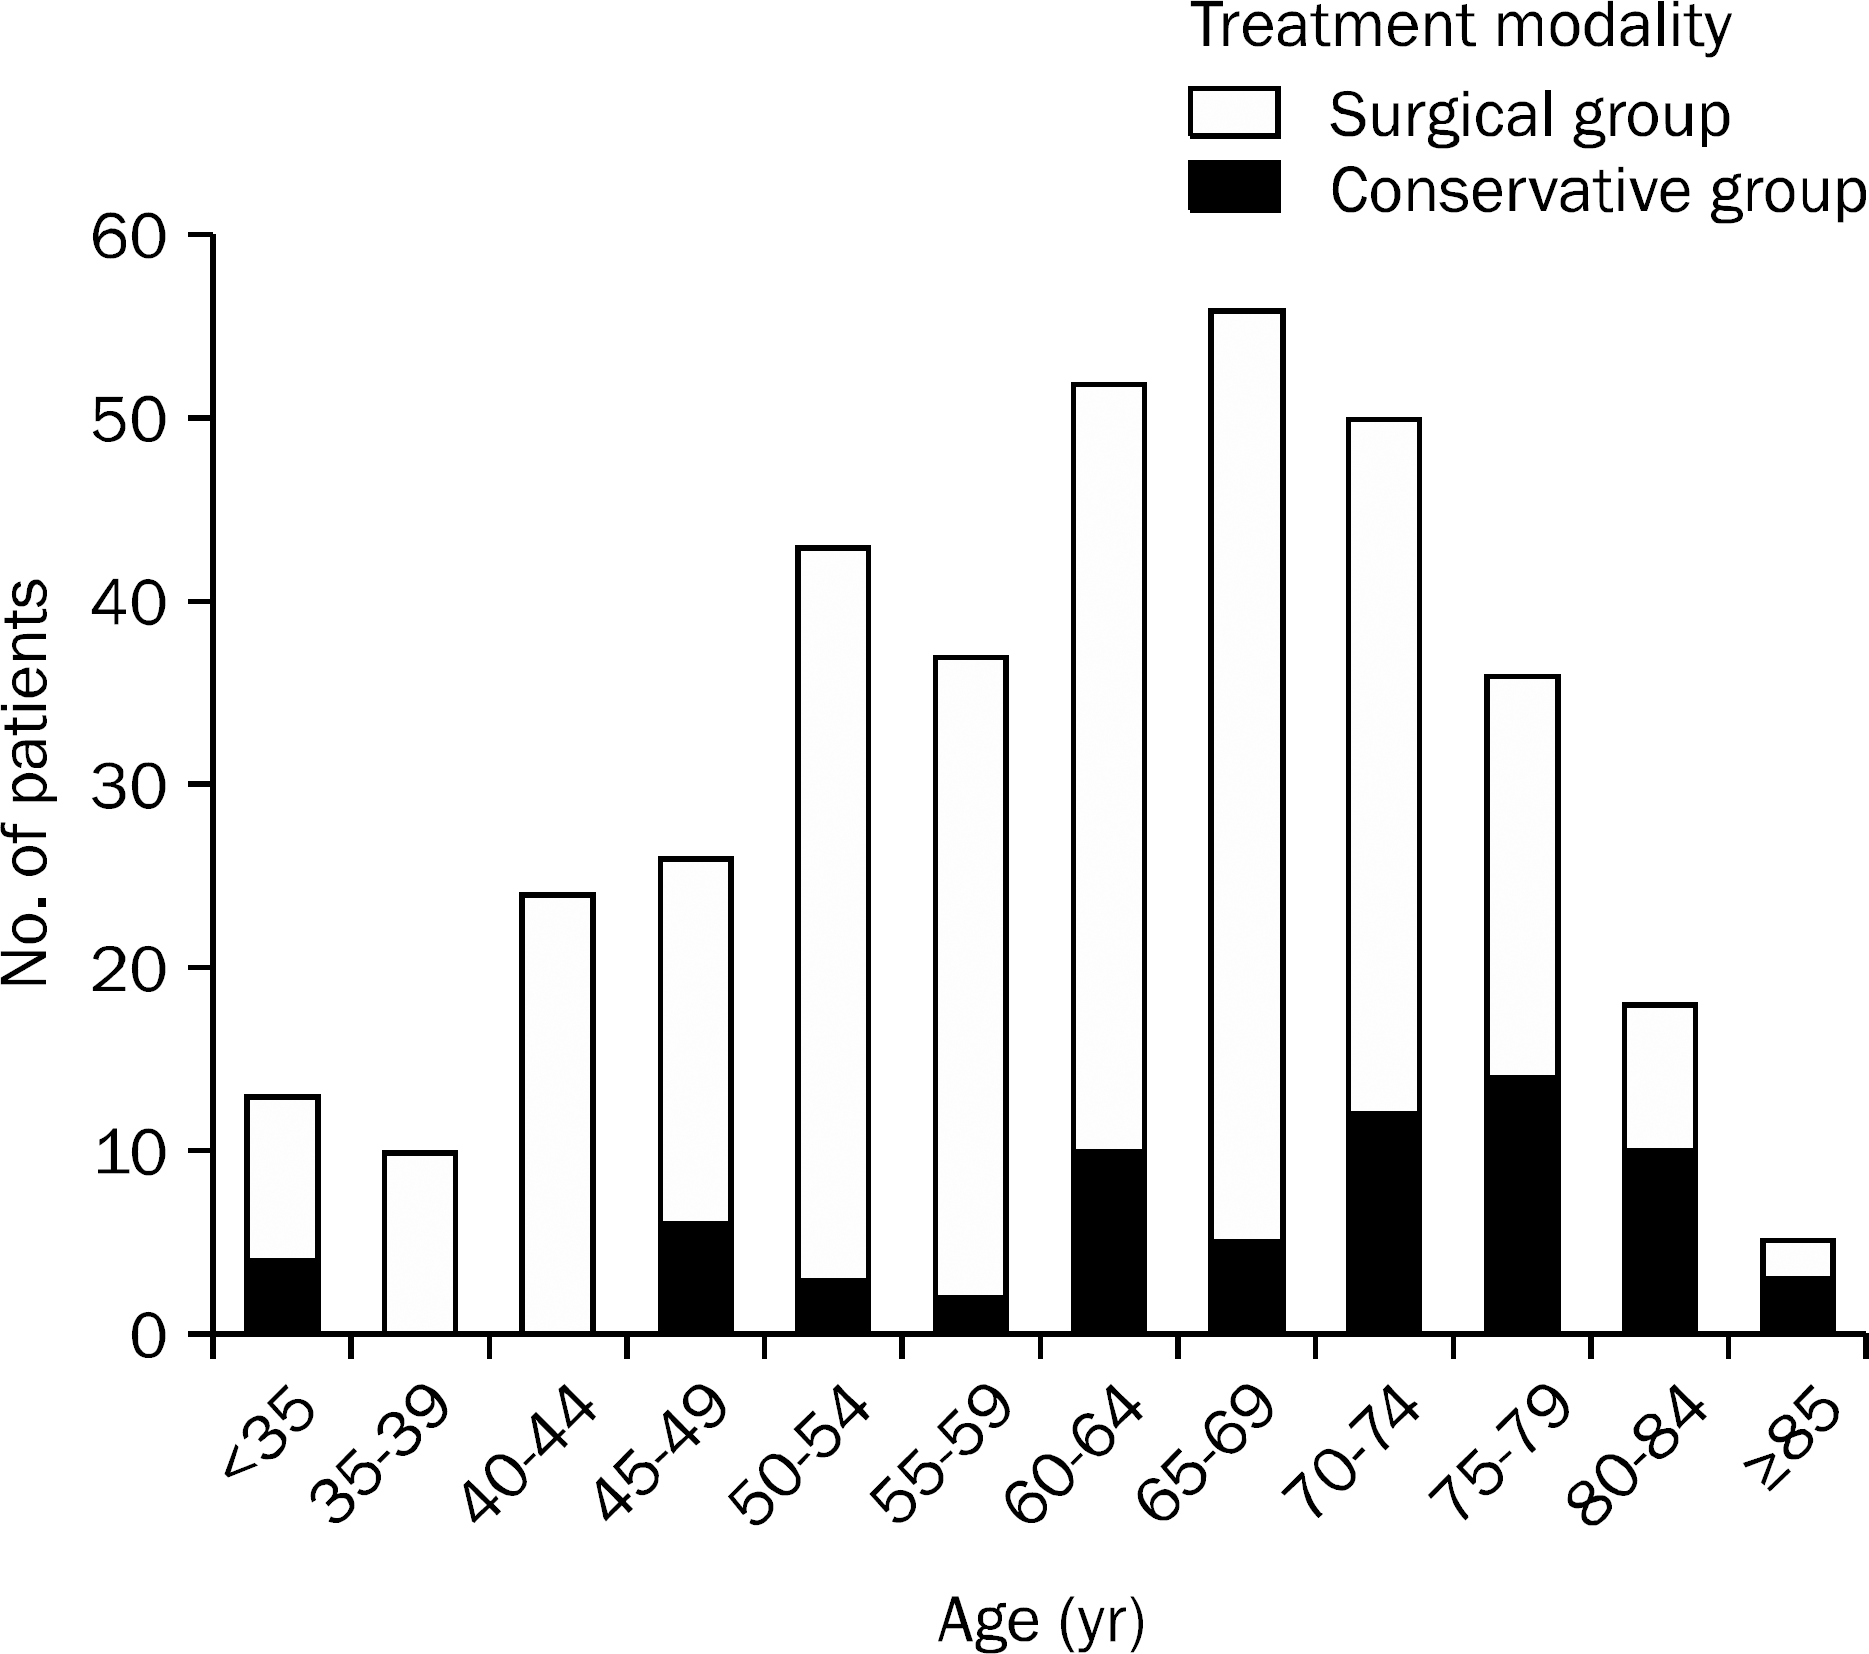
Fig. 2.
Kaplan-Meier overall survival curves for the younger group (age<65) and older group (age ≥65) according to the each stage of gastric cancer in surgery group. The cumulative survival rate of the older group (stippled line) was not significantly different from that of the younger group (solid line) in each stage (A; stage I, B; stage II, C; stage III, D; stage VI).
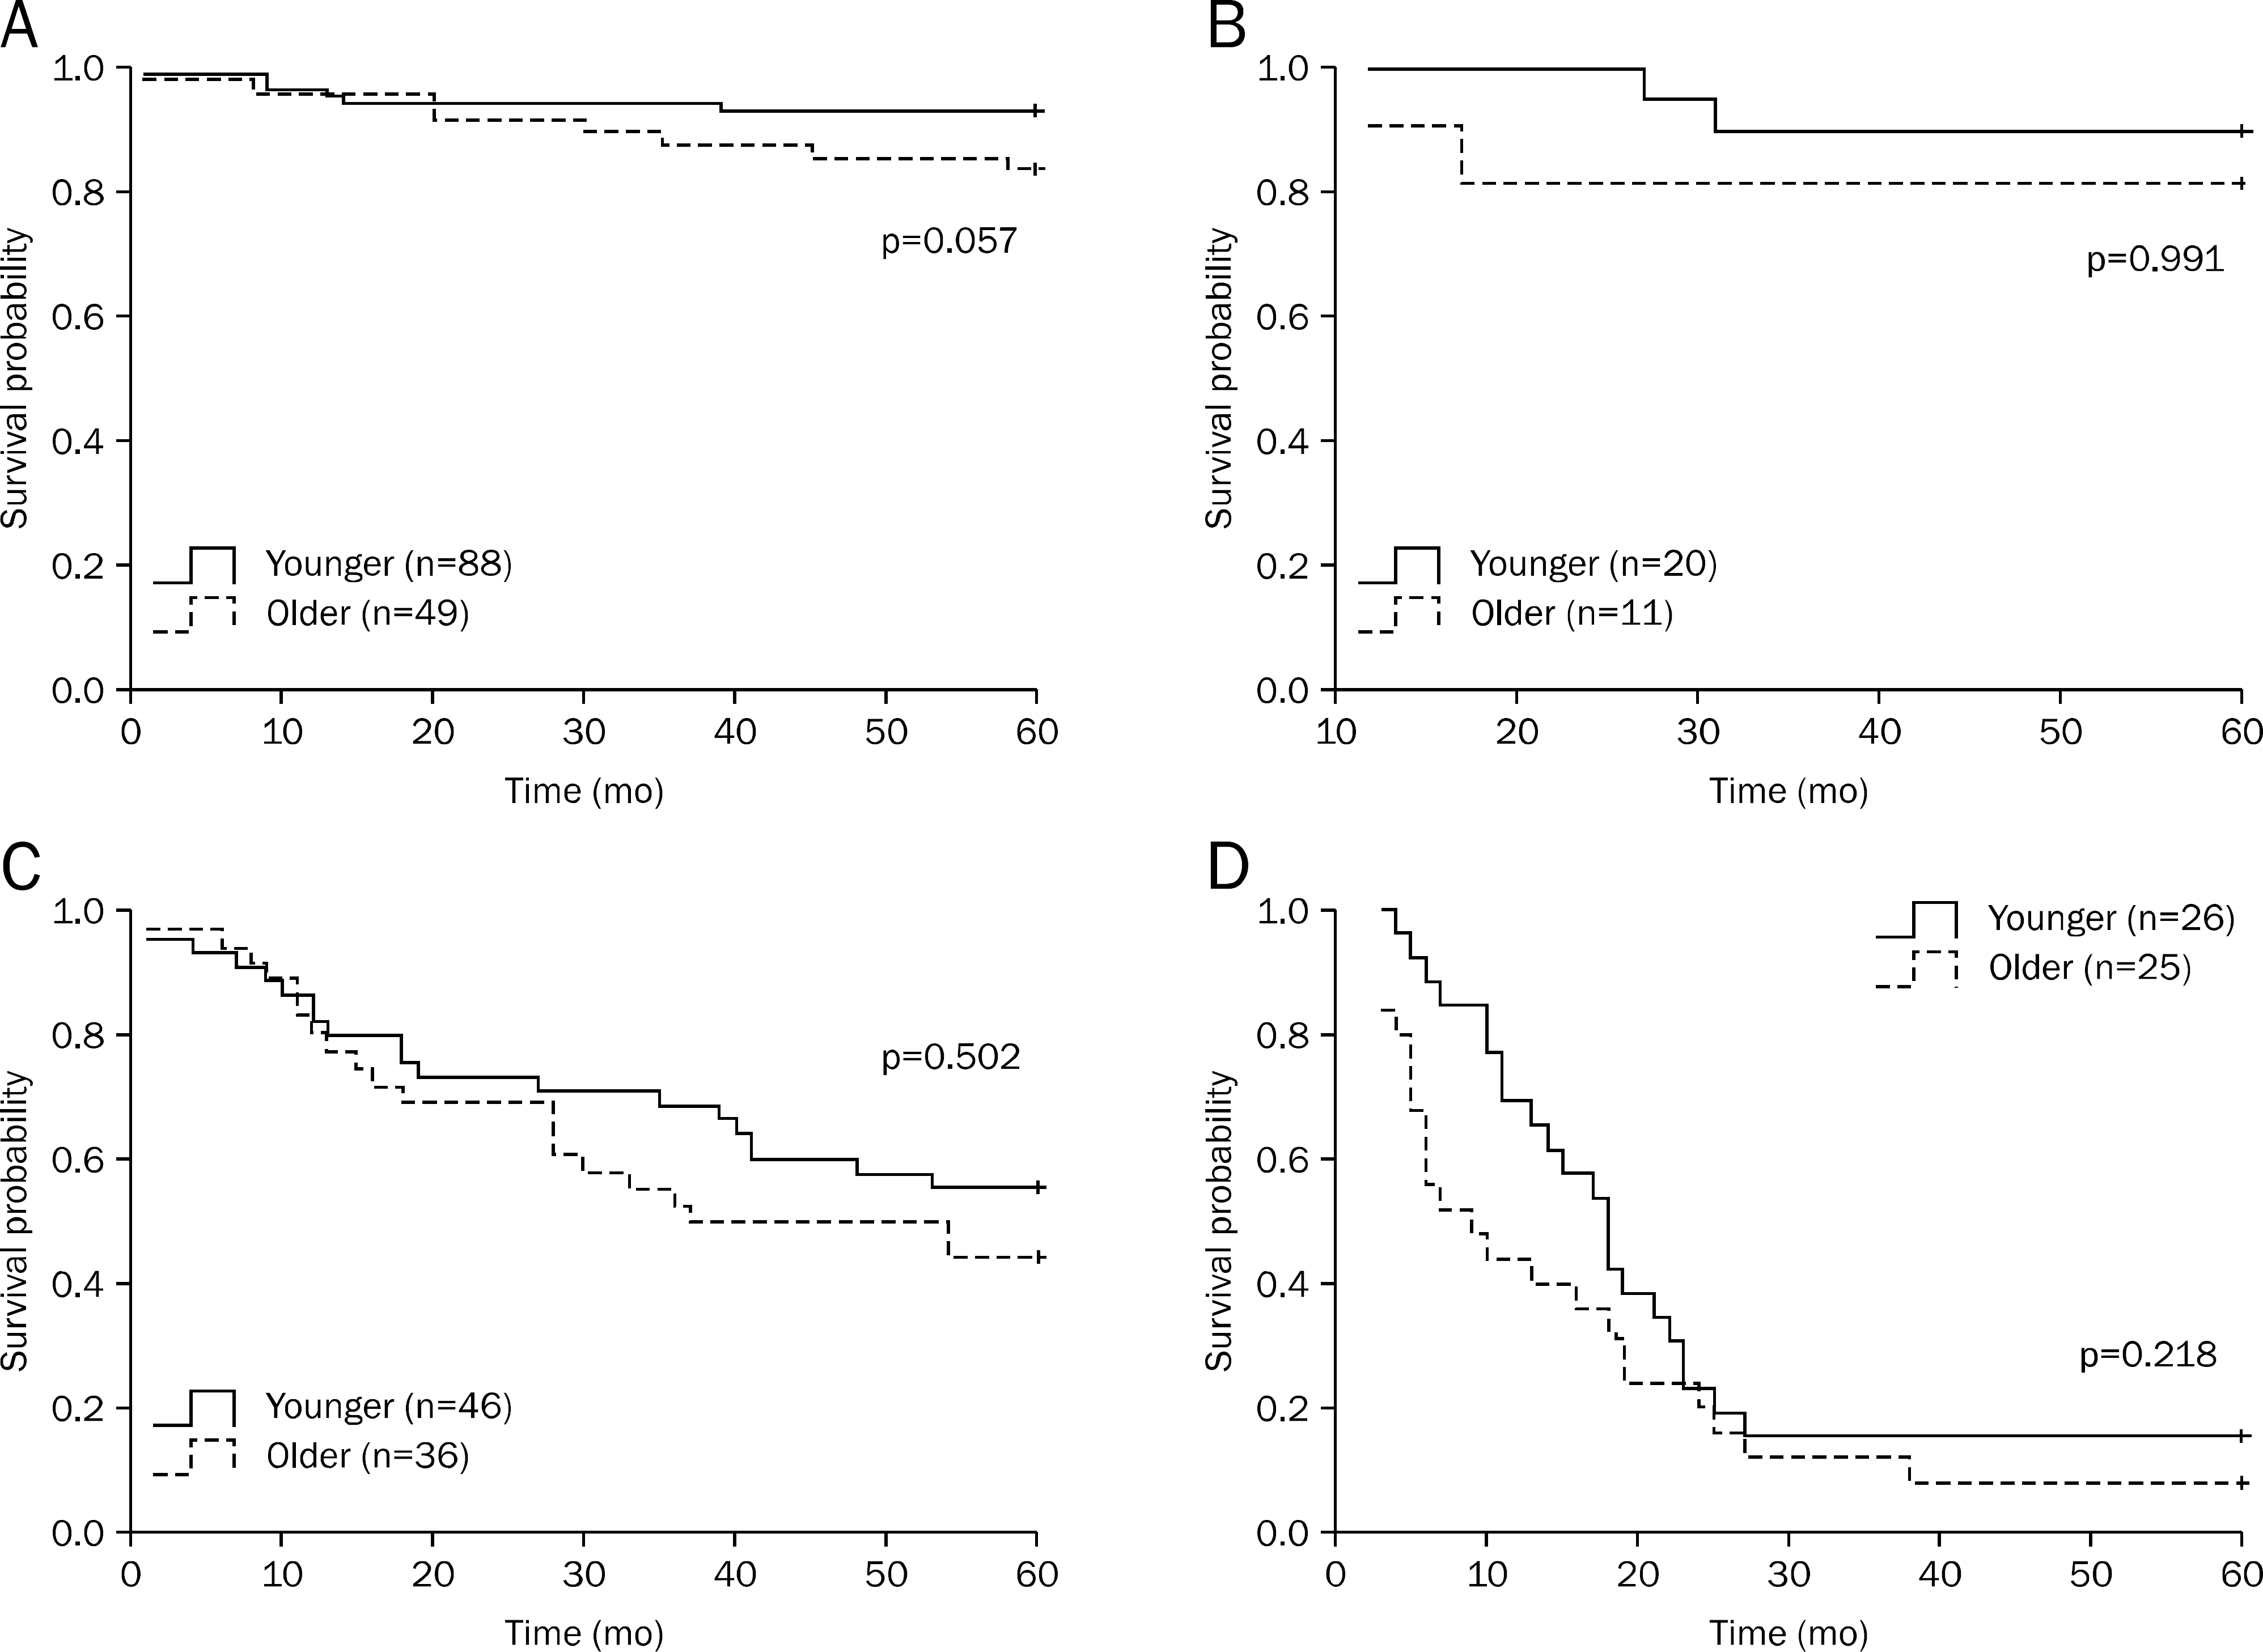
Fig. 3.
Kaplan-Meier overall survival curves for the surgery group and conservative group for each stage of gastric cancer in the older (age≥65), stage I (A), II (B), III (C), and IV (D). The cumulative survival rate of the surgery group (solid line) was significantly better than that of the conservative group (stippled line) in the stage I, II, and III, but not in stage IV.
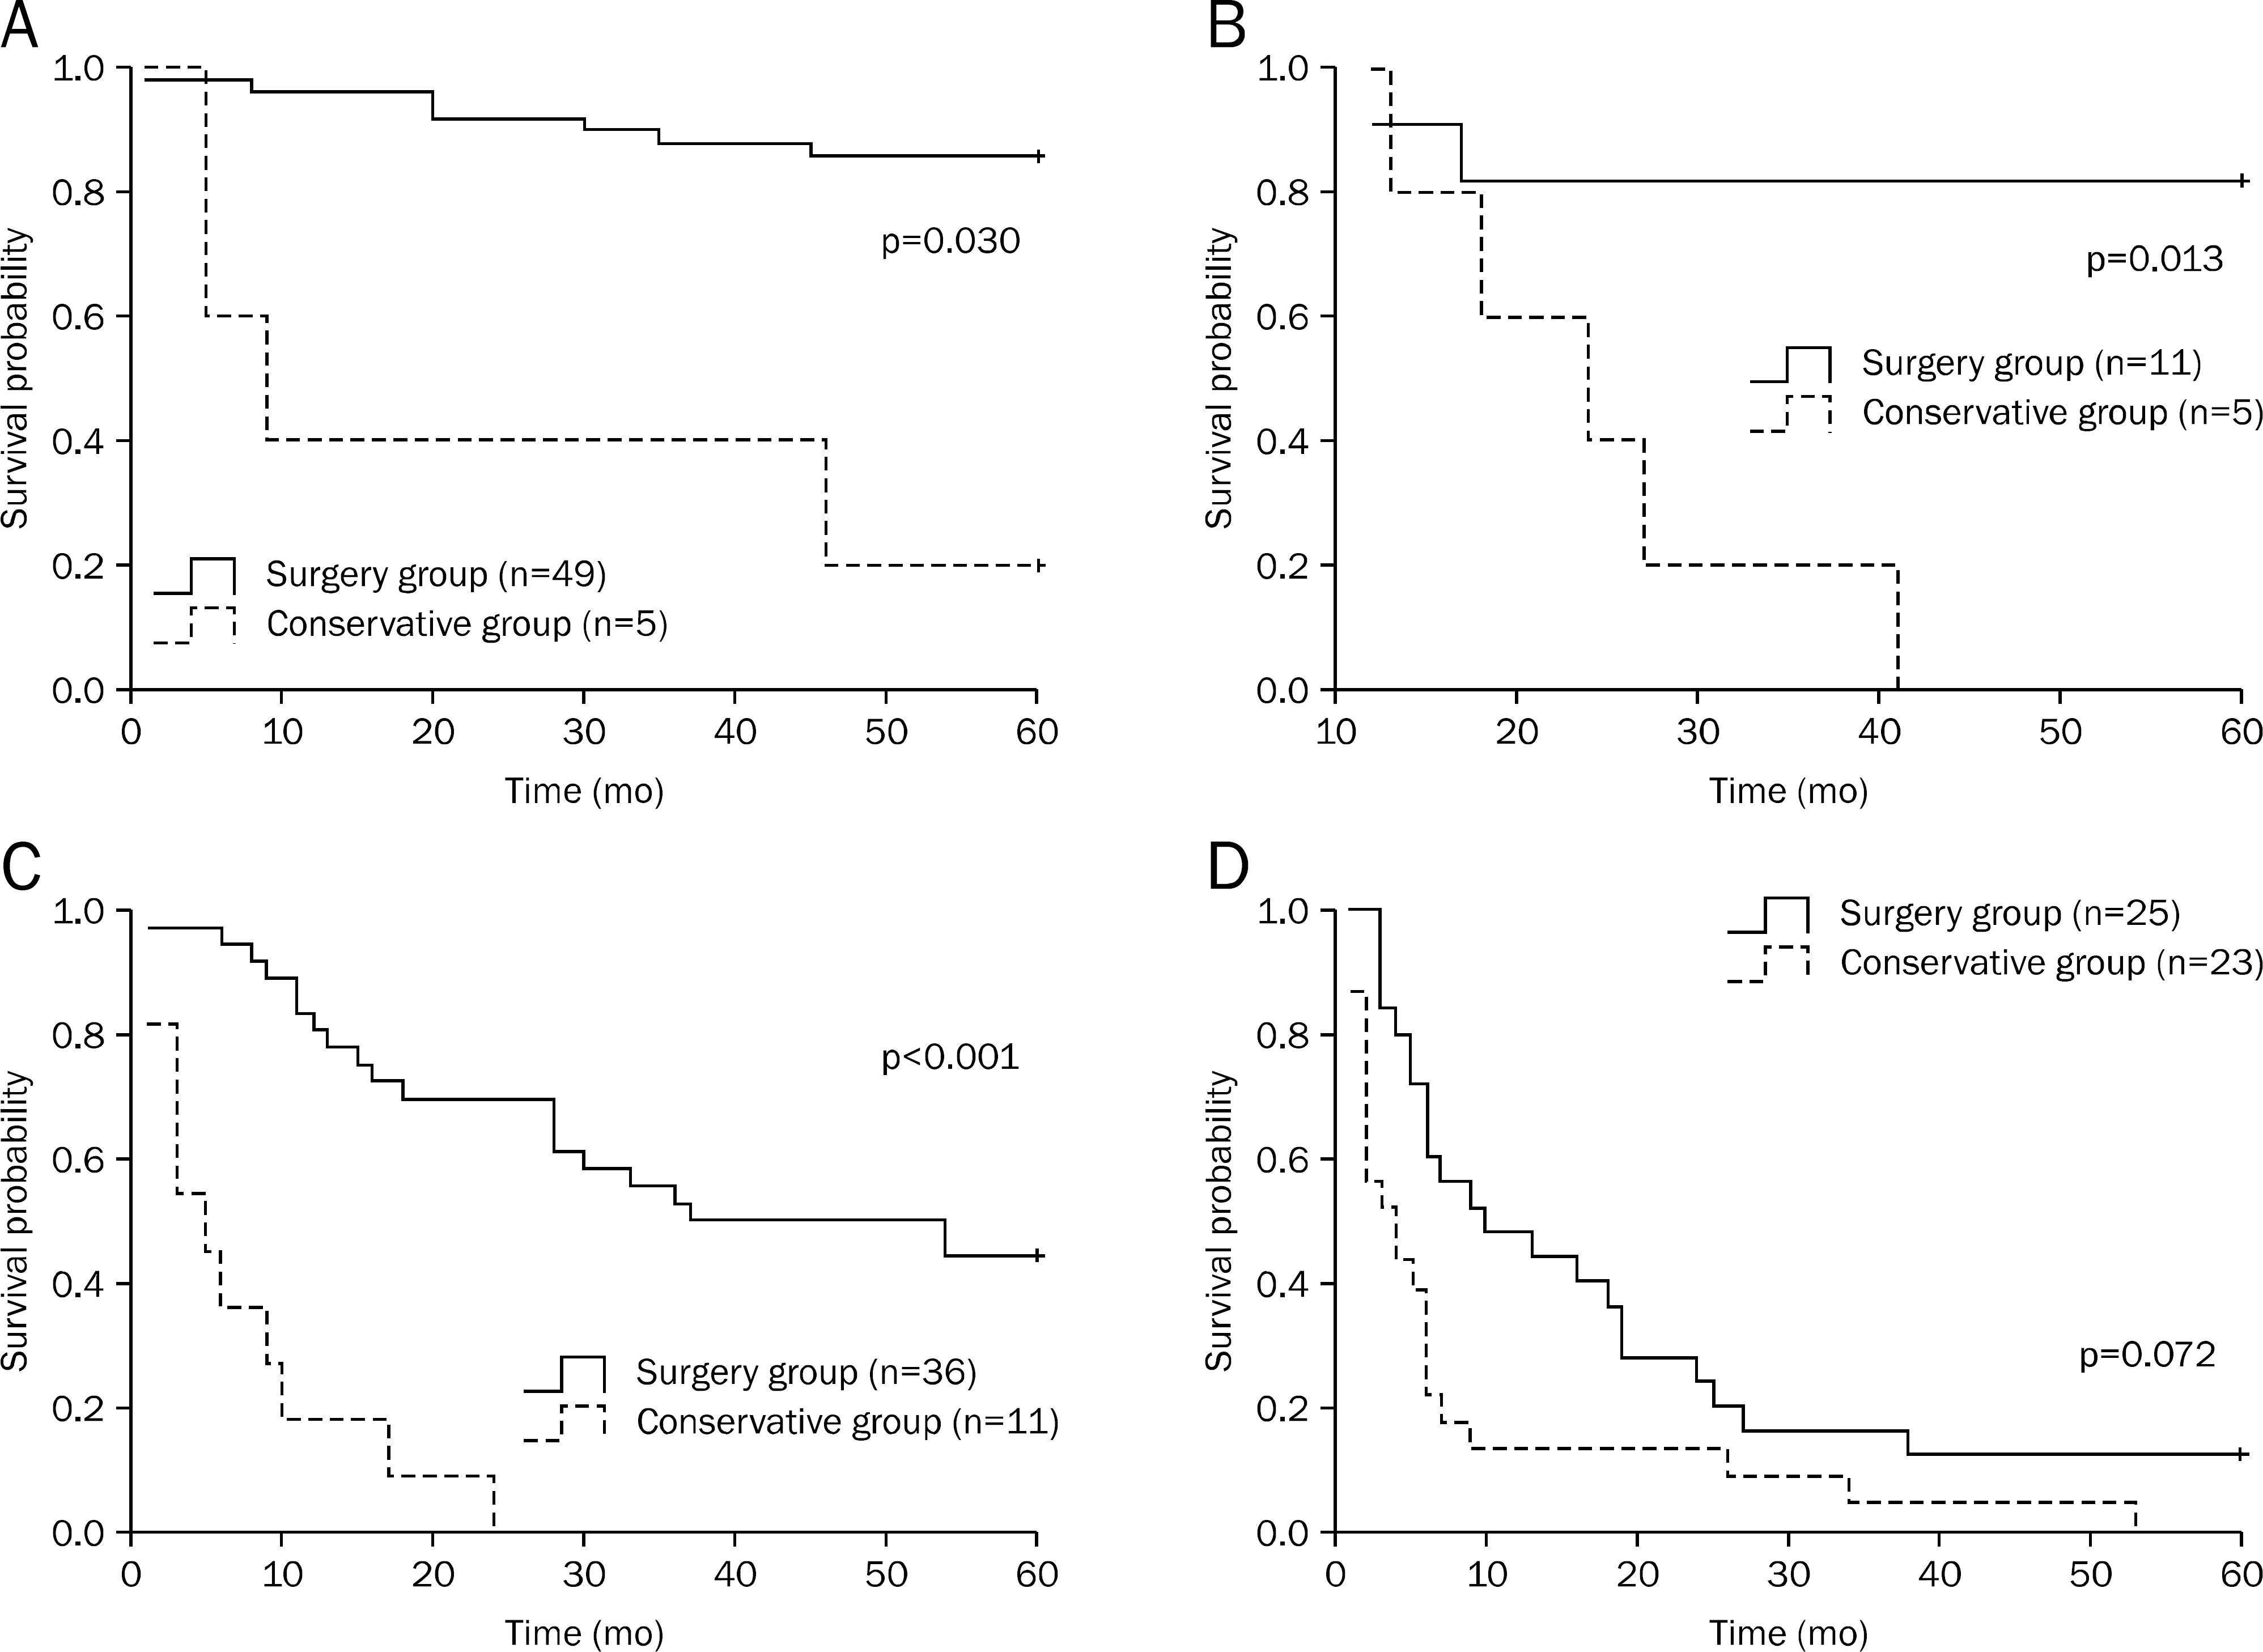
Table 1.
Baseline Characteristics of the Patients
| Characteristics Mean age (yr) | Age<65 (n=205) No. (%)51.8±9.2 | Age≥65 (n=165) No. (%) 72.9±5.7 | p-value | |
|---|---|---|---|---|
| Gender | Male | 135 (65.9) | 82 (49.7) | 0.002 |
| Female | 70 (34.1) | 83 (50.3) | ||
| Chief complaint | Screening | 32(15.6) | (9.1)15 | 0.062 |
| Advanced cancer | (34.4)11/32 | (53.3)8/15 | 0.217 | |
| III, IV | (21.9)7/32 | (26.7)4/15 | 0.718 | |
| Abdominal pain | 113 (55.1) | 84 (50.9) | 0.419 | |
| Dyspepsia | 31 (15.1) | 29 (17.6) | 0.524 | |
| Bleeding a | 17 (8.3) | 17 (10.3) | 0.506 | |
| Others b | 39 (19.0) | 53 (32.1) | 0.004 | |
| ASA | I | 109 (53.2) | 54 (32.7) | <0.001 |
| II | 89 (43.4) | 94 (57.0) | ||
| III | 7 (3.4) | 17 (10.3) | ||
| Associated disease | Hypertension | 31 (15.6) | 51 (30.9) | <0.001 |
| Diabetes mellitus | 25 (12.2) | 28 (17.0) | 0.193 | |
| Cardiac disease c | 8 (3.9) | 16 (9.7) | 0.024 | |
| Pulmonary disease d | 7 (3.4) | 10 (6.1) | 0.227 | |
| Liver disease e | 8 (3.9) | 6 (3.6) | 0.894 | |
| Neurologic disease f | 4 (2.0) | 6 (3.6) | 0.324 | |
| Chronic renal failure g | 2 (1.0) | 1 (0.6) | 0.808 | |
| Other diseases h | 2 (1.0) | 2 (1.2) | 0.827 | |
| Family history of gastric cancer | 10 (4.9) | 4 (2.4) | 0.230 | |
| Tumor marker | CEA ≤5 ng/mL | 162/192 (84.4) | 131/161 (81.4) | 0.455 |
| >5 ng/mL | 30/192 (15.6) | 30/161 (18.6) | ||
| CA 19-9 ≤27 U/mL | 160/188 (85.1) | 117/154 (76.0) | 0.032 | |
| >27 U/mL | 28/188 (14.9) | 37/154 (24.0) | ||
| Gross feature | Early cancer | 82 (40.0) | 47 (28.5) | 0.021 |
| Advanced cancer | 123 (60.0) | 118 (71.5) | ||
| Tumor location | Upper third | 19 (9.3) | 14 (8.5) | 0.094 |
| Middle third | 83 (40.5) | 48 (29.1) | ||
| Lower third | 97 (47.3) | 96 (58.2) | ||
| Whole | 6 (2.9) | 7 (4.2) | ||
| No. of tumor | 1 | 200(97.6) | (95.8)158 | 0.330 |
| ≥2 | 5(2.4) | (4.2)7 | ||
| WHO classification | Well-differentiated | 30 (14.6) | 31 (18.8) | 0.021 |
| Moderately-differentiated | 76 (37.1) | 67 (40.6) | 0.450 | |
| Poorly-differentiated | 65 (31.7) | 46 (27.9) | 0.478 | |
| Mucinous adenocarcinoma | 2 (1.0) | 1 (0.6) | 0.878 | |
| Signet ring cell | 32 (15.6) | 20 (12.1) | 0.486 | |
| TNM stage | I | 89 (43.4) | 53 (32.2) | 0.092 |
| II | 21 (10.2) | 16 (9.7) | ||
| III | 47 (23.0) | 41 (24.8) | ||
| IV | 48 (23.4) | 55 (33.3) | ||
| Treatment modality | Surgery group | 180 (87.8) | 121 (73.3) | 0.001 |
| Conservative group | 25 (12.2) | 44 (26.7) |
ASA, American Society of Anesthesiologists; WHO classification, World Health Organization classification; TNM stage, tumor-node-metastasis stage.
c Heart failure; arrhythmia; valvular disease; coronary heart disease; old myocardial infarction; pericardial effusion.
d Pneumonia; pulmonary tuberculosis; emphysema; asthma; chronic obstructive pulmonary disease; pleural effusion.
Table 2.
Baseline Characteristics in Surgery Group
| Age<65 (n=180) No. (%) | Age≥65 (n=121) No. (%) | p-value | ||
|---|---|---|---|---|
| Clinical characteristics | ||||
| Preoperative ASA | I | 89 (49.4) | 23 (19.0) | <0.001 |
| II | 84 (46.7) | 84 (69.4) | ||
| III | 7 (3.9) | 14 (11.6) | ||
| Associated disease | Hypertension | 28 (15.6) | 38 (31.4) | 0.001 |
| Diabetes mellitus | 21 (11.7) | 21 (17.4) | 0.164 | |
| Cardiac disease a | 8 (4.4) | 9 (7.4) | 0.271 | |
| Pulmonary disease b | 7 (3.9) | 5 (4.1) | 0.916 | |
| Liver disease c | 6 (3.3) | 4 (3.3) | 0.990 | |
| Neurologic disease d | 3 (1.7) | 2 (1.7) | 0.993 | |
| Chronic renal failure e | 2 (1.1) | 1 (0.8) | 0.808 | |
| Other diseases f | 2 (1.1) | 2 (1.7) | 0.689 | |
| No. of associated disease | 0 | 122 (67.8) | 63 (52.1) | 0.019 |
| 1 | 44 (24.4) | 37 (30.5) | ||
| 2 | 11 (6.1) | 18 (14.9) | ||
| ≥3 | 3 (1.7) | 3 (2.5) | ||
| Pathologic characteristics | ||||
| Tumor location | Upper third | 16 (8.9) | 6 (5.0) | 0.030 |
| Middle third | 74 (41.1) | 36 (29.7) | ||
| Lower third | 88 (48.9) | 74 (61.2) | ||
| Whole | 2 (1.1) | 5 (4.1) | ||
| Tumor size ≥5 cm | 43 (23.9) | 40 (33.1) | 0.081 | |
| No. of tumor | 1 | 177 (98.3) | 116 (95.9) | 0.193 |
| ≥2 | 3 (1.7) | 5 (4.1) | ||
| N staging | N0 | 96 (53.3) | 56 (46.3) | 0.232 |
| N1-N3 | 84 (46.7) | 65 (53.7) | ||
| TNM stage | I | 88 (48.9) | 49 (40.5) | 0.070 |
| II | 20 (11.1) | 11 (9.0) | ||
| III | 46 (25.6) | 36 (29.8) | ||
| IV | 26 (14.4) | 25 (20.7) | ||
| Mode of operation and postoperative complications | ||||
| Laparoscopic surgery | 43 (23.9) | 17 (14.0) | 0.036 | |
| Lymph node dissection | D1 | (5.0)9 | 6(5.0) | |
| D2 | (90.6)163 | 107(88.4) | 0.713 | |
| D3 | 8(4.4) | 8(6.6) | ||
| Associated resection | 14 (7.8) | 16 (13.2) | 0.123 | |
| Postoperative complications | 12(6.7) | 12(9.9) | 0.309 | |
| Surgically related | 10(5.6) | 10(8.2) | ||
| Leakage | 2(1.1) | (1.7)2 | 0.687 | |
| Abscess | 2(1.1) | (1.7)2 | 0.687 | |
| Bleeding | 3(1.7) | (2.5)3 | 0.621 | |
| Ileus | 1(1.0) | (0.0)0 | 0.411 | |
| Wound problem | 2(1.1) | (3.3)4 | 0.182 | |
| Nonsurgically related | 2(1.1) | (1.7)2 | ||
| Mortality | 1(1.0) | (1.7)2 | 0.852 | |
| Postoperative hospital stay (days) | 14.7±9.8 | 15.8±10.6 | 0.361 | |
| Operation time (min) | 257.3±83.8 | 242.6±70.7 | 0.115 | |
ASA, American Society of Anesthesiologists; D, Lymph node dissection; TNM stage, tumor-node-metastasis stage.
a Heart failure; arrhythmia; valvular disease; coronary heart disease; old myocardial infarction; pericardial effusion.
b Pneumonia; pulmonary tuberculosis; emphysema; asthma; chronic obstructive pulmonary disease; pleural effusion.
Table 3.
Univariate and Multivariate Analysis of Overall Cancer Survival in All Surgical Treatment Group
| No. of patients (total=301) |
Univariate analysis |
Multivariate analysis |
|||||
|---|---|---|---|---|---|---|---|
| OS (mo) Median | HR (95% CI) | p-value | HR a (95% CI) | p-value | |||
| Demographic featur | res | ||||||
| Age (yr) | <65 | 180 | 77 | 1.00 | 0.009 | - | NS |
| ≥65 | 121 | 62 | 1.60 (1.12-2.29) | - | |||
| Gender | Male | 181 | 72 | 1.00 | 0.367 | ||
| Female | 120 | 72 | 0.84 (0.58-1.22) | ||||
| ASA | I | 112 | 72 | 1.00 | 0.273 | ||
| II | 168 | 71 | 1.01 (0.76-1.53) | ||||
| III | 21 | 45 | 1.15 (0.85-1.56) | ||||
| CEA (ng/mL) | ≤5 | 251 | 74 | 1.00 | <0.001 | 1.00 | <0.001 |
| >5 | 34 | 19 | 2.64 (1.67-4.17) | 1.59 (1.00-2.53) | |||
| CA19-9 (U/mL) | ≤27 | 237 | 75 | 1.00 | 0.003 | - | NS |
| >27 | 42 | 22 | 1.33 (1.02-1.72) | - | |||
| Associated disease | Hypertension No | 235 | 75 | 1.00 | 0.075 | ||
| Yes | 66 | 51 | 1.43 (0.95-2.17) | ||||
| Diabetes mellitus No | 259 | 72 | 1.00 | 0.832 | |||
| Yes | 42 | 66 | 1.02 (0.60-1.76) | ||||
| Cardiac disease No | 284 | 72 | 1.00 | 0.251 | |||
| Yes | 17 | 71 | 1.36 (0.67-2.77) | ||||
| Pulmonary disease No | 289 | 72 | 1.00 | 0.406 | |||
| Yes | 12 | 39 | 1.36 (0.58-3.22) | ||||
| Liver disease No | 291 | 72 | 1.00 | 0.352 | |||
| Yes | 10 | 32 | 1.38 (0.54-3.53) | ||||
| Neurologic disease No | 296 | 72 | 1.00 | 0.413 | |||
| Yes | 5 | 31 | 1.37 (0.41-4.54) | ||||
| Characteristics of gastric cancer | |||||||
| Tumor location | Upper third | 22 | 55 | 1.00 | 0.001 | - | NS |
| Middle third | 110 | 75 | 1.29 (0.61-2.74) | - | |||
| Lower third | 162 | 67 | 1.30 (0.62-2.70) | - | |||
| Whole | 7 | 12 | 2.65 (0.91-7.72) | - | |||
| WHO classification | Well-differentiated | 44 | 84 | 1.00 | 0.106 | - | NS |
| Moderately-differentiated | 115 | 72 | 1.81 (0.91-3.59) | - | |||
| Poorly-differentiated | 84 | 40 | 2.75 (1.38-5.46) | - | |||
| Signet ring cell | 42 | 70 | 2.00 (0.92-4.34) | - | |||
| TNM stage | I | 137 | 85 | 1.00 | <0.001 | 1.00 | <0.001 |
| II | 31 | 84 | 0.77 (0.22-2.72) | 1.28 (0.38-3.45) | |||
| III | 82 | 38 | 3.77 (1.93-7.36) | 5.90 (3.37-10.35) | |||
| IV | 51 | 14 1 | 13.65 (6.96-26.74 | 4) | 21.77 (12.18-33.41) | ||
| Operation method | Laparoscopy | 60 | 88 | 1.00 | <0.001 | - | NS |
| Open surgery | 241 | 62 | 2.95 (1.85-10.25) | - | |||
Table 4.
Univariate and Multivariate Analysis of Overall Cancer Survival in All Older Patients
| No. of patients (total=165) |
Univariate analysis |
Multivariate analysis |
||||||
|---|---|---|---|---|---|---|---|---|
| OS (mo) Median | HR (95% CI) | p-value | HR a (95% CI) | p-value | ||||
| Demographic features | ||||||||
| Age (yr) | 65-69 | 56 | 41 | 1.00 | 0.044 | - | NS | |
| 70-74 | 50 | 33 | 1.63 (0.95-2.89) | - | ||||
| ≥75 | 59 | 29 | 1.91 (1.14-3.21) | - | ||||
| Gender | Male | 82 | 34 | 1.00 | 0.925 | |||
| Female | 83 | 30 | 0.99 (0.65-1.49) | |||||
| ASA | 1 | 75 | 60 | 1.00 | 0.118 | |||
| 2 | 73 | 20 | 1.33 (0.86-2.07) | |||||
| 3 | 17 | 36 | 1.17 (0.58-2.34) | |||||
| CEA (ng/mL) | ≤5 | 131 | 60 | 1.00 | <0.001 | 1.00 | <0.001 | |
| >5 | 30 | 7 | 2.62 (1.63-4.20) | 1.59 (1.00-2.53) | ||||
| CA19-9 (U/mL) | ≤27 | 117 | 54 | 1.00 | 0.001 | - | NS | |
| >27 | 37 | 9 | 2.05 (1.30-3.25) | - | ||||
| Associated diseas | Hypertension | No | 114 | 38 | 1.00 | 0.305 | ||
| Yes | 51 | 51 | 1.18 (0.78-1.80) | |||||
| Diabetes mellitus | No | 137 | 33 | 1.00 | 0.997 | |||
| Yes | 28 | 28 | 0.92 (0.53-1.62) | |||||
| Cardiac disease | No | 149 | 36 | 1.00 | 0.096 | |||
| Yes | 16 | 17 | 1.50 (0.81-2.77) | |||||
| Pulmonary disease | No | 155 | 35 | 1.00 | 0.010 | - | NS | |
| Yes | 10 | 5 | 2.14 (1.04-4.41) | - | ||||
| Liver disease | No | 159 | 33 | 1.00 | 0.816 | |||
| Yes | 6 | 30 | 0.73 (0.22-2.75) | |||||
| Neurologic disease | No | 159 | 34 | 1.00 | 0.562 | |||
| Yes | 6 | 10 | 1.55 (0.54-4.49) | |||||
| Characteristics of | gastric cancer | |||||||
| Tumor location | Upper third | 96 | 45 | 1.00 | 0.102 | - | NS | |
| Middle third | 48 | 30 | 1.28 (0.83-2.00) | - | ||||
| Lower third | 14 | 18 | 1.64 (0.83-3.23) | - | ||||
| Whole | 7 | 12 | 2.36 (1.01-5.52) | - | ||||
| WHO classification | Well-differentiated | 25 | 78 | 1.00 | 0.001 | - | NS | |
| Moderately-different | 71 | 24 | 3.32 (1.50-7.37) | - | ||||
| Poorly-differentiated | 45 | 26 | 4.11 (1.81-9.34) | - | ||||
| Signet ring cell | 19 | 19 | 4.12 (1.64-10.35) | ) | - | |||
| TNM stage | I | 54 | 72 | 1.00 | <0.001 | 1.00 | <0.001 | |
| II | 16 | 66 | 2.49 (1.06-5.83) | 1.28 (0.44-3.72) | ||||
| III | 47 | 28 | 4.32 (2.26-8.26) | 4.06 (2.08-7.92) | ||||
| IV | 48 | 6 | 13.48 (7.04-25.80) | 9.78 (4.97-19.26) | ||||
| Treatment modality | Surgery group | 121 | 94 | 1.00 | <0.001 | 1.00 | <0.001 | |
| Conservative group | 44 | 5 | 4.86 (3.15-7.47) | 3.90 (2.43-6.26) | ||||
 XML Download