Loading [MathJax]/jax/output/HTML-CSS/fonts/TeX/fontdata.js

Journal List > Korean J Gastroenterol > v.57(6) > 1006821

Song, Yoon, Kim, Park, Park, Cho, Sohn, Jeon, and Kim: Usefulness of Model for End-stage Liver Disease Score for Predicting Mortality after Intra-abdominal Surgery in Patients with Liver Cirrhosis in a Single Hospital

Abstract

Background/Aims

Recent studies have suggested that the model for end-stage liver disease (MELD) score is superior to the Child-Turcotte-Pugh (CTP) score as a predictor of postoperative mortality, especially up to 90 days. This study aimed to determine whether MELD score can predict the postoperative outcome of patients with liver cirrhosis in Korea.

Methods

We reviewed the medical records of 98 patients with liver cirrhosis who underwent intra-abdominal surgery under generalized anesthesia between March 2003 and December 2008 at Kangbuk Samsung Hospital. Univariate and multivariate cox proportional hazards analyses were performed to determine the correlation between risk factors and mortality.

Results

Eighty-two percent of patients (n=80) were male. Mean MELD score was 10.82±3.84. Common causes of liver cirrhosis were hepatitis B (57.2%) and alcohol (22.4%). Ninety-day mortality ranged from 2.1% (MELD score, ≤9) to 25% (MELD score, ≥17). By multivariate analysis, MELD score>9 (HR 2.490; [95% CI 1.116-5.554; p=.026]) and American Society of Anesthesiologists Class ≥ IV (HR 2.433; [95% CI 1.039-5.695; p=.041]) predicted mortality at 30 days after surgery. Only MELD score was a predictor of prognosis at 90 days (HR 2.446; [95% CI 1.118-5.352; p=.025]). Etiology of cirrhosis and CTP score were not predictors of mortality.

Conclusions

MELD score was a useful predictive parameter of postoperative mortality at 30 days and 90 days, independent of the etiology of cirrhosis.

Go to : Goto

References

1. Tanaka R, Itoshima T, Nagashima H. Follow-up study of 582 liver cirrhosis patients for 26 years in Japan. Liver. 1987; 7:316–324.
crossref
2. Cowan RE, Jackson BT, Grainger SL, Thompson RP. Effects of an-esthetic agents and abdominal surgery on liver blood flow. Hepatology. 1991; 14:1161–1166.
crossref
3. Amitrano L, Guardascione MA, Brancaccio V, Balzano A. Coagu-lation disorders in liver disease. Semin Liver Dis. 2002; 22:83–96.
crossref
4. Borzio M, Salerno F, Piantoni L, et al. Bacterial infection in patients with advanced cirrhosis: a multicentre prospective study. Dig Liver Dis. 2001; 33:41–48.
crossref
5. Thalheimer U, Triantos CK, Samonakis DN, Patch D, Burroughs AK. Infection, coagulation, and variceal bleeding in cirrhosis. Gut. 2005; 54:556–563.
crossref
6. Vilstrup H. Cirrhosis and bacterial infections. Rom J Gastroenterol. 2003; 12:297–302.
7. Child CG, Turcotte JG. Surgery and portal hypertension. Major Probl Clin Surg. 1964; 1:1–85.
8. Kamath PS, Wiesner RH, Malinchoc M, et al. A model to predict survival in patients with end-stage liver disease. Hepatology. 2001; 33:464–470.
crossref
9. Malinchoc M, Kamath PS, Gordon FD, Peine CJ, Rank J, ter Borg PC. A model to predict poor survival in patients undergoing trans-jugular intrahepatic portosystemic shunts. Hepatology. 2000; 31:864–871.
crossref
10. Teh SH, Nagorney DM, Stevens SR, et al. Risk factors for mortality after surgery in patients with cirrhosis. Gastroenterology. 2007; 132:1261–1269.
crossref
11. Wiesner R, Edwards E, Freeman R, et al. Model for end-stage liver disease (MELD) and allocation of donor livers. Gastroenterology. 2003; 124:91–96.
crossref
12. Keats AS. The ASA classification of physical status–a recapitu-lation. Anesthesiology. 1978; 49:233–236.
crossref
13. Garrison RN, Cryer HM, Howard DA, Polk HC Jr. Clarification of risk factors for abdominal operations in patients with hepatic cirrhosis. Ann Surg. 1984; 199:648–655.
crossref
14. Mansour A, Watson W, Shayani V, Pickleman J. Abdominal operations in patients with cirrhosis: still a major surgical challenge. Surgery. 1997; 122:730–735.
crossref
15. Befeler AS, Palmer DE, Hoffman M, Longo W, Solomon H, Di Bisceglie AM. The safety of intra-abdominal surgery in patients with cirrhosis: model for end-stage liver disease score is superior to Child-Turcotte-Pugh classification in predicting outcome. Arch Surg. 2005; 140:650–654.
16. Northup PG, Wanamaker RC, Lee VD, Adams RB, Berg CL. Model for End-Stage Liver Disease (MELD) predicts nontransplant surgical mortality in patients with cirrhosis. Ann Surg. 2005; 242:244–251.
crossref
17. Perkins L, Jeffries M, Patel T. Utility of preoperative scores for predicting morbidity after cholecystectomy in patients with cirrhosis. Clin Gastroenterol Hepatol. 2004; 2:1123–1128.
crossref
18. Suman A, Barnes DS, Zein NN, Levinthal GN, Connor JT, Carey WD. Predicting outcome after cardiac surgery in patients with cirrhosis: a comparison of Child-Pugh and MELD scores. Clin Gastroenterol Hepatol. 2004; 2:719–723.
crossref
Go to : Goto

kjg-57-340f1.tif
Fig. 1.
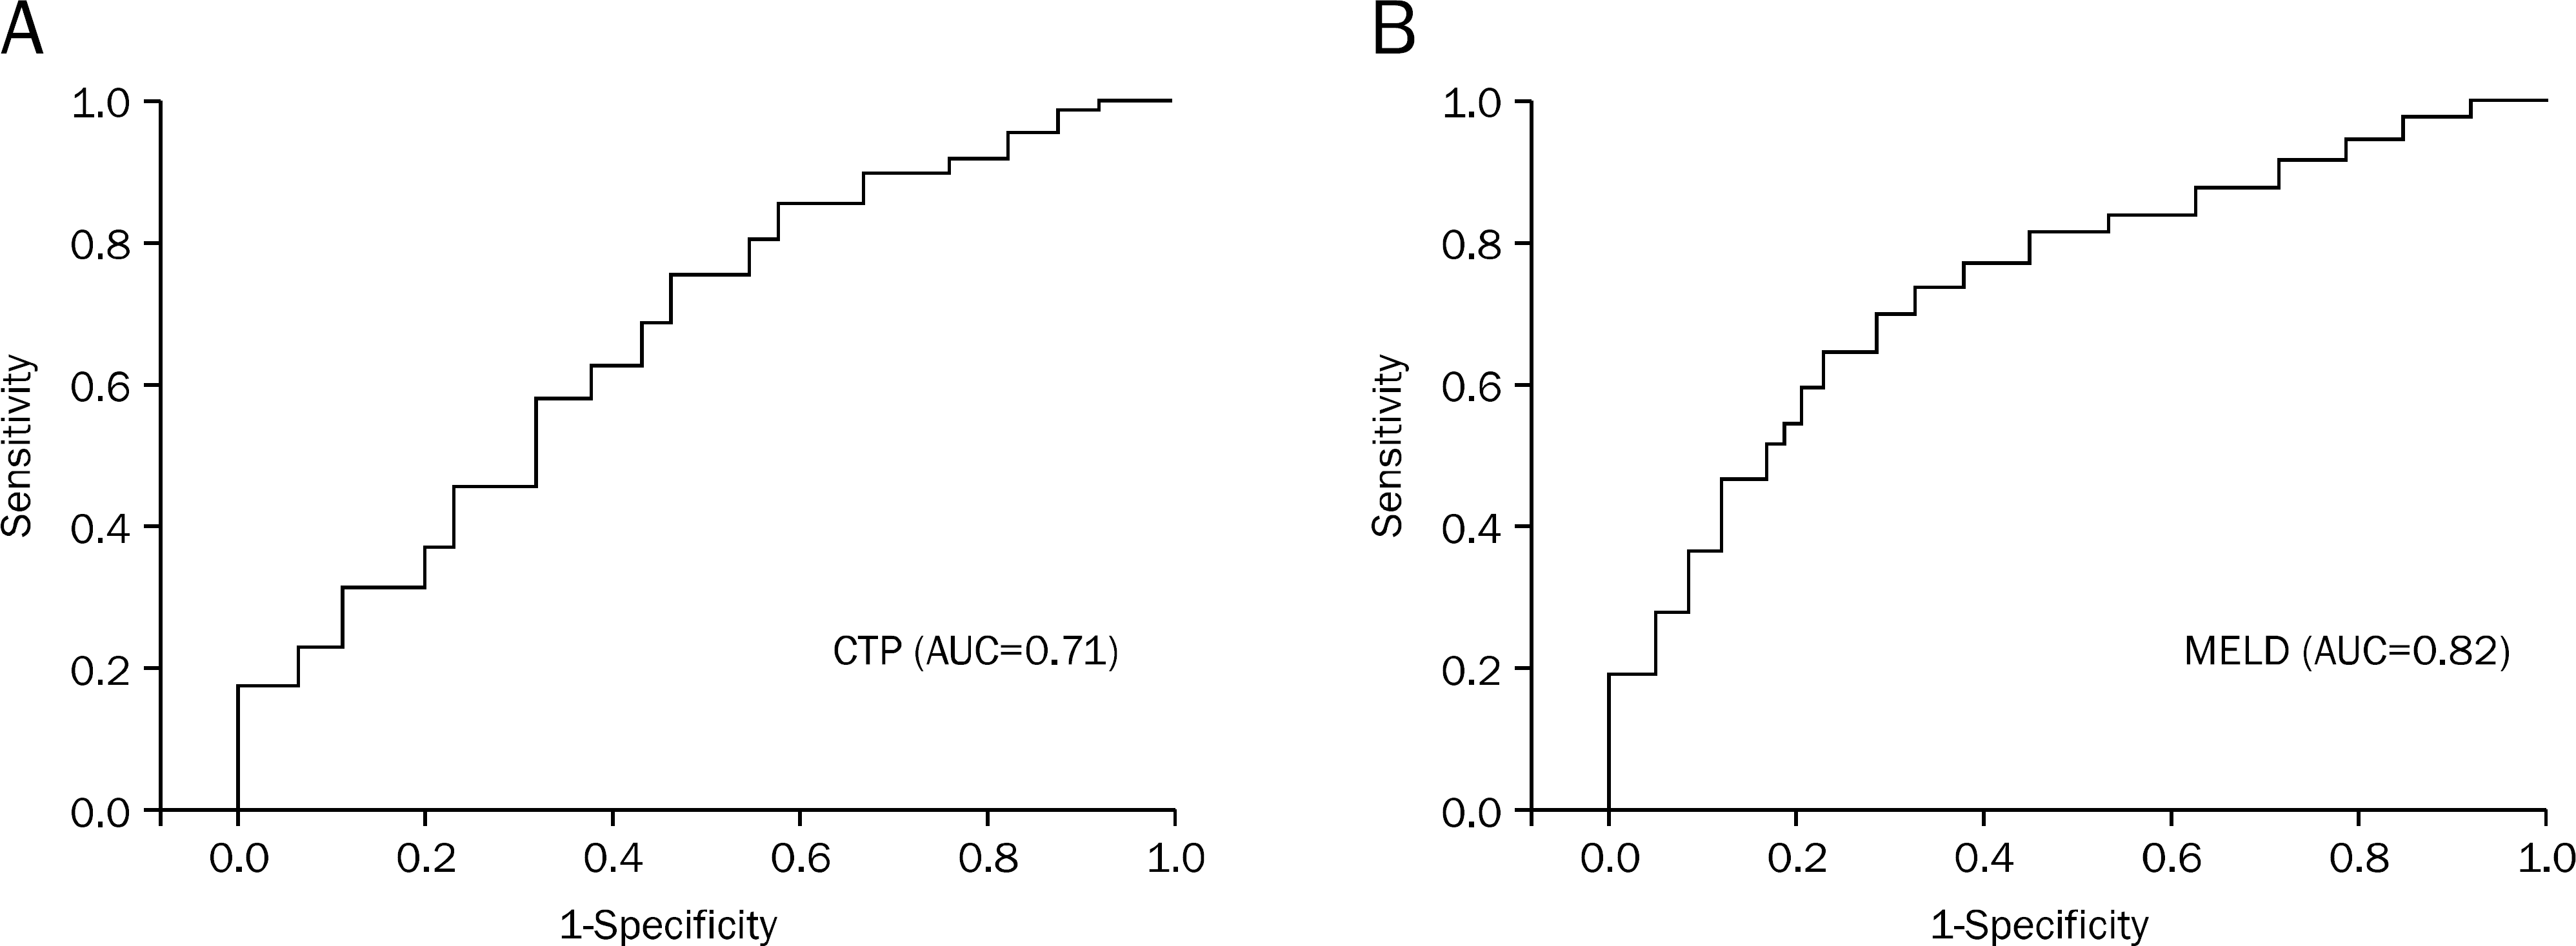
The ROC curves for MELD and CTP scores for predicting mortality after intra-abdominal surgery in patients with cirrhosis. (A) AUC for CTP score was 0.71 (95% CI, 0.62-0.83) and (B) AUC for MELD score was 0.82 (95% CI, 0.69-0.93), respectively. ROC, receiver operating characteristic; MELD, model for end stage liver disease; CTP, Child-Turcotte-Pugh; AUC, area under curve.
undefined
Table 1.
Basic Characteristics of the Cirrhotic Patients with Intra-abdominal Surgery
  Total surgical population (n=98)
Age, mean (SD) 57.8 (10.5)
Male gender (%) 80 (81.6%)
MELD score, mean (SD) 10.82 (3.84)
ASA class ≥ IV 19 (19.4%)
Etiology of cirrhosis, n  
 Alcohol (%) 22 (22.4%)
 Hepatitis B (%) 56 (57.2%)
 Hepatitis C (%) 10 (10.2%)
 Others 10 (10.2%)
Emergency, n (%) 8 (7.7%)

SD, standard deviation; MELD, model for end stage liver disease; ASA, American Society of Anesthesiologists.

Table 2.
Types of Intra-abdominal Surgery in 98 Patients with Liver Cirrhosis
Surgical procedure No. of patients (%)
Stomach  
 Resection with Billroth I or II 15 (15.3)
 Total gastrectomy 4 (4.2)
Small bowel  
 Resection and anastomosis 6 (6.1)
 Takedown ileojejunal bypass 2 (2.0)
 Appendectomy 6 (6.1)
Colon  
 Partial colectomy 11 (11.2)
 Subtotal colectomy 4 (4.2)
Pancreas  
 Roux-en-Y pancreatojejunostomy 8 (8.2)
 Pancreatoduodenectomy 7 (7.1)
Liver/Biliary/Spleen  
 Resectioin of lobe 17 (17.3)
 Open cholecystectomy 11 (11.2)
 Splenectomy 2 (2.0)
Exploratory laparotomy  
 Abscess 3 (3.2)
 Lysis of adhesions 2 (2.0)
Table 3.
Univariate Analysis of the Predictive Capability of Clinical Parameters for Postoperative Mortality
Factors 30 days
90 days
1 year
After 1 year
HR (95% CI) p-value HR (95% CI) p-value HR (95% CI) p-value HR (95% CI) p-value
MELD >9 2.599 (1.262-5.350) .010 2.774 (1.347-5.713) .006 2.672 (1.297-5.504) .008 2.559 (1.238-5.290) .011
CTP >7 1.947 (1.026-3.926) .046 2.089 (1.036-4.212) .039 2.342 (1.161-4.724) .017 2.347 (1.157-4.763) .018
ASA ≥ IV 2.691 (1.376-5.264) .004 2.761 (1.411-5.405) .003 2.469 (1.260-4.836) .008 2.438 (1.214-4.898) .012
Etiology                
 Alcohol 0.642 (0.172-2.390) .509 0.643 (0.173-2.395) .511 0.558 (0.150-2.080) .385 0.400 (0.096-1.678) .211
 HBV 0.730 (0.250-2.136) .566 0.788 (0.269-2.306) .664 0.736 (0.252-2.155) .577 0.771 (0.263-2.263) .636
 HCV 0.622 (0.232-1.666) .345 0.689 (0.257-1.845) .459 0.604 (0.225-1.617) .316 0.694 (0.258-1.866) .469
 Others 1   1   1   1  
Male 1.357 (0.530-3.476) .525 1.314 (0.513-3.366) .570 1.524 (0.595-3.904) .380 1.903 (0.672-5.393) .226
Age 1.021 (0.989-1.054) .201 1.022 (0.989-1.057) .194 1.023 (0.991-1.056) .164 1.015 (0.982-1.048) .382
Emergency 0.633 (0.224-1.783) .387 0.421 (0.148-1.195) .104 0.624 (0.221-1.763) .373 0.372 (0.13-1.066) .066

HR, hazard ratio; CI, confidence interval; MELD, model for end-stage liver disease; CTP, Child-Turcotte-Pugh; ASA, American Society of Anesthesiologists.

Table 4.
Multivariate Analysis of the Predictive Capability of Clinical Parameters for Postoperative Mortality
Factors 30 days
90 days
1 year
After 1 year
HR (95% CI) p-value HR (95% CI) p-value HR (95% CI) p-value HR (95% CI) p-value
MELD >9 2.490 (1.116-5.554) .026 2.446 (1.118-5.352) .025 2.276 (0.989-5.007) .057 2.145 (0.939-4.897) .070
CTP >7 1.154 (0.531-2.508) .718 1.231 (0.569-2.665) .598 1.445 (0.657-3.178) .360 1.570 (0.678-3.634) .292
ASA ≥ IV 2.433 (1.039-5.695) .041 2.242 (0.989-5.242) .058 1.954 (0.824-4.632) .128 1.796 (0.709-4.550) .217
Etiology                
 Alcohol 0.353 (0.081-1.540) .166 0.423 (0.097-1.835) .250 0.405 (0.094-1.738) .640 0.267 (0.051-1.390) .117
 HBV 0.643 (0.199-2.080) .461 0.852 (0.259-2.798) .792 0.712 (0.222-2.282) .224 0.550 (0.160-1.897) .344
 HCV 0.689 (0.225-2.111) .514 0.919 (0.296-2.854) .884 0.806 (0.259-2.505) .568 0.810 (0.253-2.53) .723
 Others 1   1   1   1  
Male 1.499 (0.586-3.834) .607 1.097 (0.396-3.038) .858 1.357 (0.490-3.758) .557 1.651 (0.538-5.066) .381
Age 1.307 (0.471-3.625) .372 1.022 (0.983-1.062) .278 1.022 (0.985-1.061) .242 1.020 (0.981-1.060) .320
Emergency 0.629 (0.181-2.182) .465 1.046 (0.296-3.693) .994 0.753 (0.219-2.583) .652 1.217 (0.319-4.634) .774

HR, hazard ratio; CI, confidence interval; MELD, model for end-stage liver disease; CTP, Child-Turcotte-Pugh; ASA, American Society of Anesthesiologists.

Table 5.
Correlation between MELD Score, CTP score and Post-operative Mortality
  Mortality (%)
  30 days 90 days 1 year
MELD score      
 ≤9 (n=47, 48.0%) 2.1 (n=1) 2.1 (n=1) 14.9 (n=7)
 10-12 (n=27, 27.6%) 7.4 (n=2) 11.1 (n=3) 40.7 (n=11)
 13-16 (n=12, 12.2%) 8.3 (n=1) 16.7 (n=2) 16.7 (n=2)
 ≥17 (n=12, 12.2%) 16.7 (n=2) 25 (n=3) 33.3 (n=4)
CTP class      
 A (n=48, 49.0%) 6.3 (n=3) 10.4 (n=5) 18.8 (n=9)
 B (n=46, 46.9%) 4.3 (n=2) 6.5 (n=3) 26.1 (n=12)
 C (n=4, 4.1%) 25 (n=1) 25 (n=1) 75 (n=3)

MELD, model for end stage liver disease; CTP, Child-Turcotte-Pugh.

TOOLS
ORCID iDs

Dong-Il Park
https://orcid.org/http://orcid.org/0000-0003-2307-8575

Similar articles