Abstract
Background/Aims
Clevudine is a potent antiviral agent that has demonstrated efficacy in patients with chronic hepatitis B. This study compared the efficacy of clevudine (C), entecavir (E) and lamivudine (L) in treatment-naive patient with HBeAg-positive chronic hepatitis B.
Methods
A total of 146 treatment-naive patients with HBeAg-positive chronic hepatitis B received clevudine, entecavir or lamivudine. C group (n=39) received 30 mg of clevudine, E group (n=39) received 0.5 mg of entecavir and L group (n=68) received 100 mg of lamivudine once a day for more than 48 weeks. The efficacy analysis estimated the mean changes of the HBV DNA levels as a virologic response, the normalization of the ALT levels (less than 35 IU/L) as a biochemical response and loss of HBeAg or seroconversion as a serologic response. The serum HBV DNA level was quanti-fied by hybrid capture and real-time PCR assay.
Results
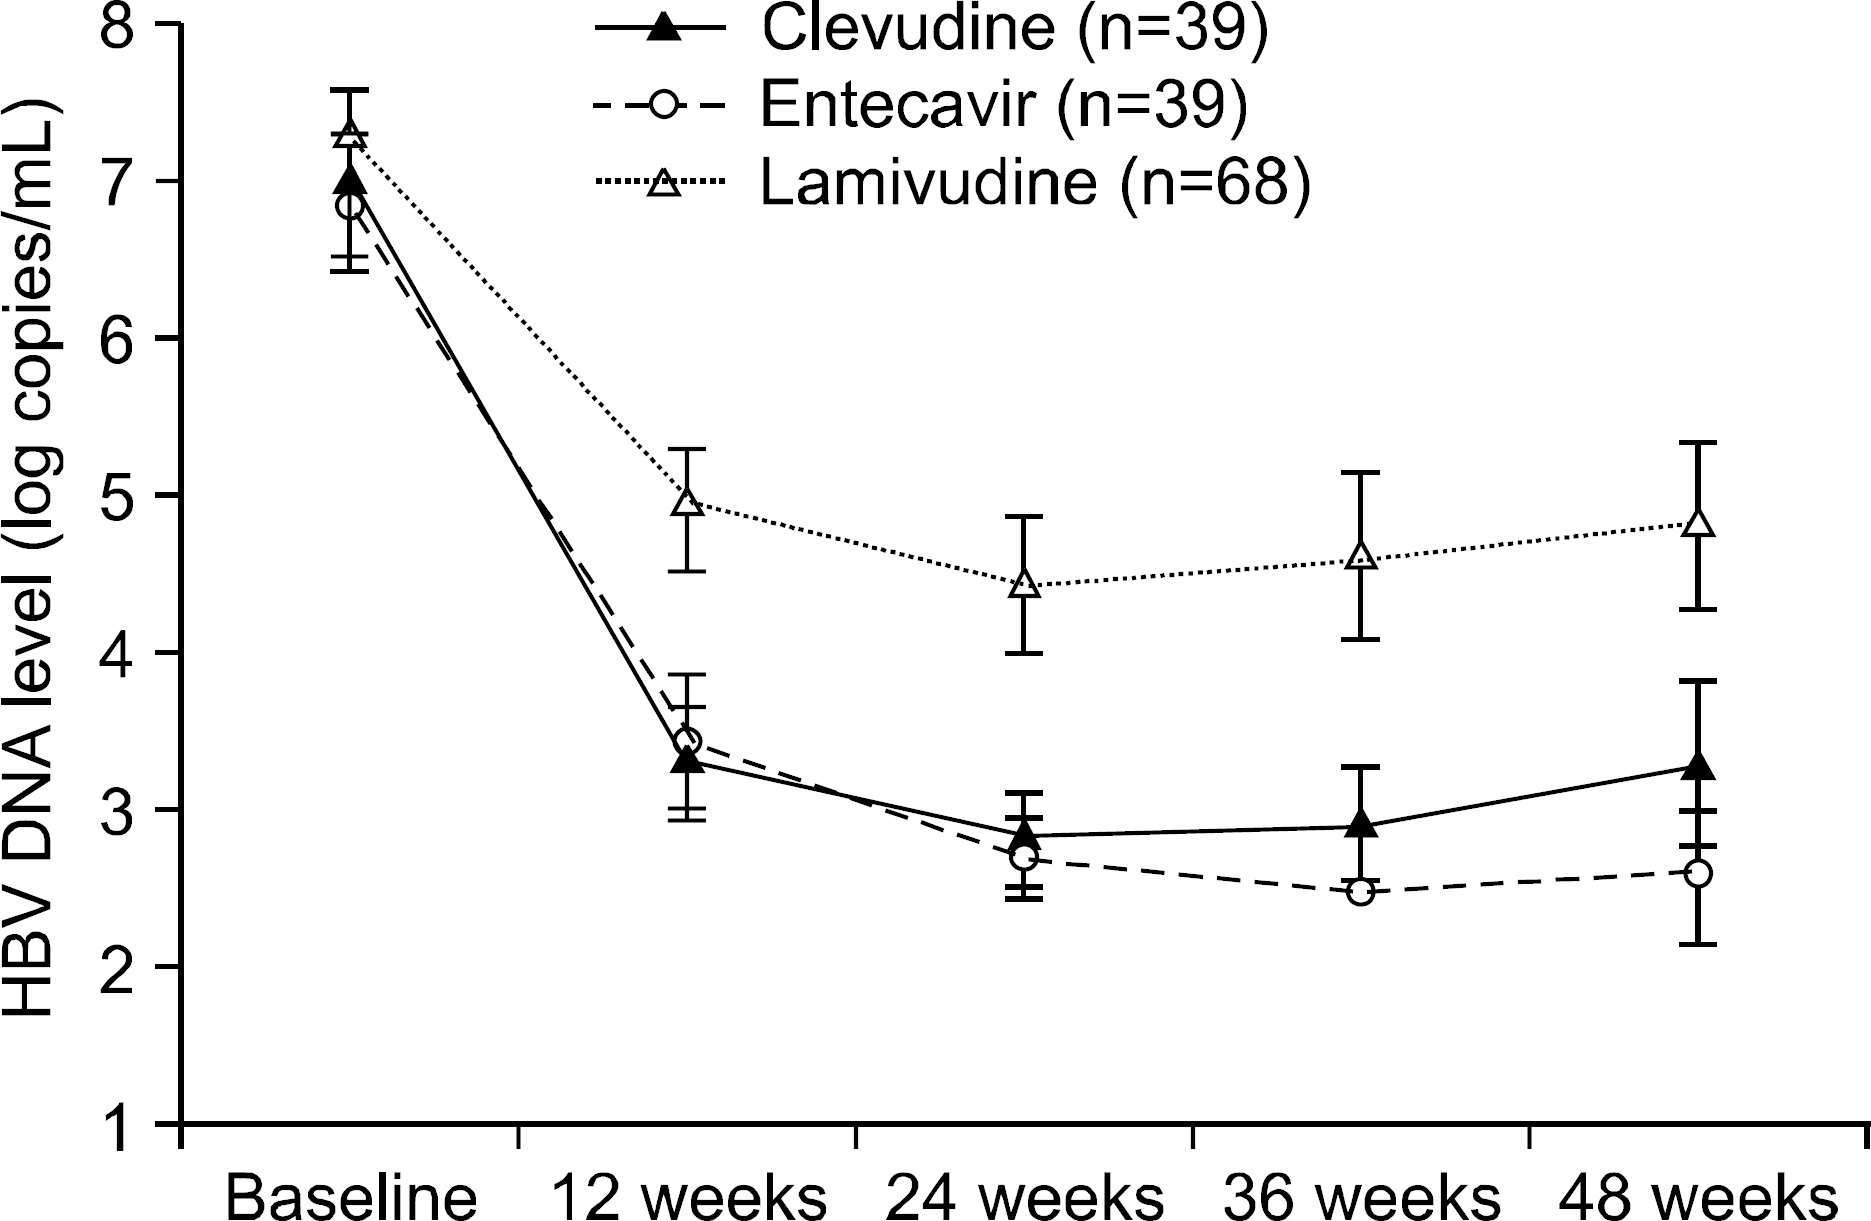
Before the administration of clevudine, entecavir and lamivudine, the mean HBV DNA and ALT levels and the gender and age were well balanced among the three groups (p>0.05). For the virologic response at 48 weeks, the mean changes of the HBV DNA levels from baseline of the C, E and L groups were −3.8±2.2, −4.5±1.9 and −2.5±2.1 log copies/mL. C and E group showed superior antiviral activity compared to that of L group (p<0.0001), but no significant differences in antiviral response were noted between C and E groups. For the biochemical response at 48 weeks, the normalization of the ALT levels (less than 35 IU/L) among the C, E and L groups was 82%, 74% and 71%, respectively (p=0.46). The rates of undetectable serum HBV DNA (less than 300 copies/mL) of the C, E and L groups were 39%, 69% and 27%, respectively (p<0.0001). For the serologic response at 48 weeks, the loss of HBeAg was 13%, 31% and 24% and the seroconversion was 10%, 23% and 17%, respectively. There was no difference of efficacy among the three groups regarding ALT normalization or serologic response (p>0.05). Viral breakthrough in C group was noted at 24 weeks (5%) and 48 weeks (21%), but no biochemical breakthrough was noted. The elevation of the serum CK level was noted in only 1 patient of group C at 48 weeks (2.56%) after therapy. For the patients without or with liver cirrhosis (LC), C and E group showed superior antiviral activity compared to that of the L group, but the antiviral activity was more effective in non- LC group than LC group (p<0.0001 vs p=0.036).
Conclusions
Clevudine therapy compared with lamivudine for 48 weeks showed significantly potent antiviral efficacy in treatment-naive patients with HBeAg-positive chronic hepatitis B, and especially in the non-LC patients. However, the antiviral efficacy of clevudine was similar to that of entecavir even though taking into account relatively short follow up period and retrospective study.
REFERENCES
1. Cheong JY. Management of chronic hepatitis B in treatment-naive patients. Korean J Gastroenterol. 2008; 51:338–345.
2. Iloeje UH, Yang HI, Su J, et al. Predicting cirrhosis risk based on the level of circulating hepatitis B viral load. Gastroenterology. 2006; 130:678–686.

3. Chen CJ, Yang HI, Su J, et al. Risk of hepatocellular carcinoma across a biological gradient of serum hepatitis B virus DNA level. JAMA. 2006; 295:65–73.

4. Chen G, Lin WY, Shen FM, Iloeje UH, London WT, Evans AA. Viral load as a predictor of mortality from hepatocellular carcinoma and chronic liver disease in chronic hepatitis B infection. Abstract 477. 40th EASL. April 13-17, 2005. Paris, France.
6. Mommeja-Marin H, Mondou E, Blum MR, Rousseau F. Serum HBV DNA as a marker of efficacy during therapy for chronic HBV infection: analysis and review of the literature. Hepatology. 2003; 37:1309–1319.

7. Di Marco V, Lo Iacono O, Cammà C, et al. The longterm course of chronic hepatitis B. Hepatology. 1999; 30:257–264.

8. Dienstag JL, Goldin RD, Heathcote EJ, et al. Histological outcome during longterm lamivudine therapy. Gastroenterology. 2003; 124:105–117.

9. Leung NW, Lai CL, Chang TT, et al. Extended lamivudine treatment in patients with chronic hepatitis B enhances hepatitis B e antigen seroconversion rates: results after 3 years of therapy. Hepatology. 2001; 33:1527–1532.

10. Dienstag JL, Schiff ER, Wright TL, et al. Lamivudine as initial treatment for chronic hepatitis B in the United States. N Engl J Med. 1999; 341:1256–1263.

11. Chang TT, Gish RG, de Man R, et al. A comparison of entecavir and lamivudine for HBeAg-positive chronic hepatitis B. N Engl J Med. 2006; 354:1001–1010.

12. Lai CL, Shouval D, Lok AS, et al. Entecavir versus lamivudine for patients with HBeAg-negative chronic hepatitis B. N Engl J Med. 2006; 354:1011–1020.

13. Sherman M, Yurdaydin C, Simek H, et al. Entecavir therapy for lamivudine-refractory chronic hepatitis B: improved virologic, biochemical, and serology outcomes through 96 weeks. Hepatology. 2008; 48:99–108.

14. Lim SG, Leung N, Hann HW, et al. Clinical trial: a phase II, randomized study evaluating the safety, pharmacokinetics and anti-viral activity of clevudine for 12 weeks in patients with chronic hepatitis B. Aliment Pharmacol Ther. 2008; 27:1282–1292.
15. Lee KS, Byun KS, Chung YH, et al. Clevudine therapy for 24 weeks further reduced serum hepatitis B virus DNA levels and increased ALT normalization rates without emergence of viral breakthrough than 12 weeks of clevudine therapy. Intervirology. 2007; 50:296–302.

16. Yoo BC, Kim JH, Chung YH, et al. Twenty-four-week clevudine therapy showed potent and sustained antiviral activity in HBeAg-positive chronic hepatitis B. Hepatology. 2007; 45:1172–1178.

17. Yoo BC, Kim JH, Kim TH, et al. Clevudine is highly effica-cious in hepatitis B e antigen-negative chronic hepatitis B with durable off-therapy viral suppression. Hepatology. 2007; 46:1041–1048.

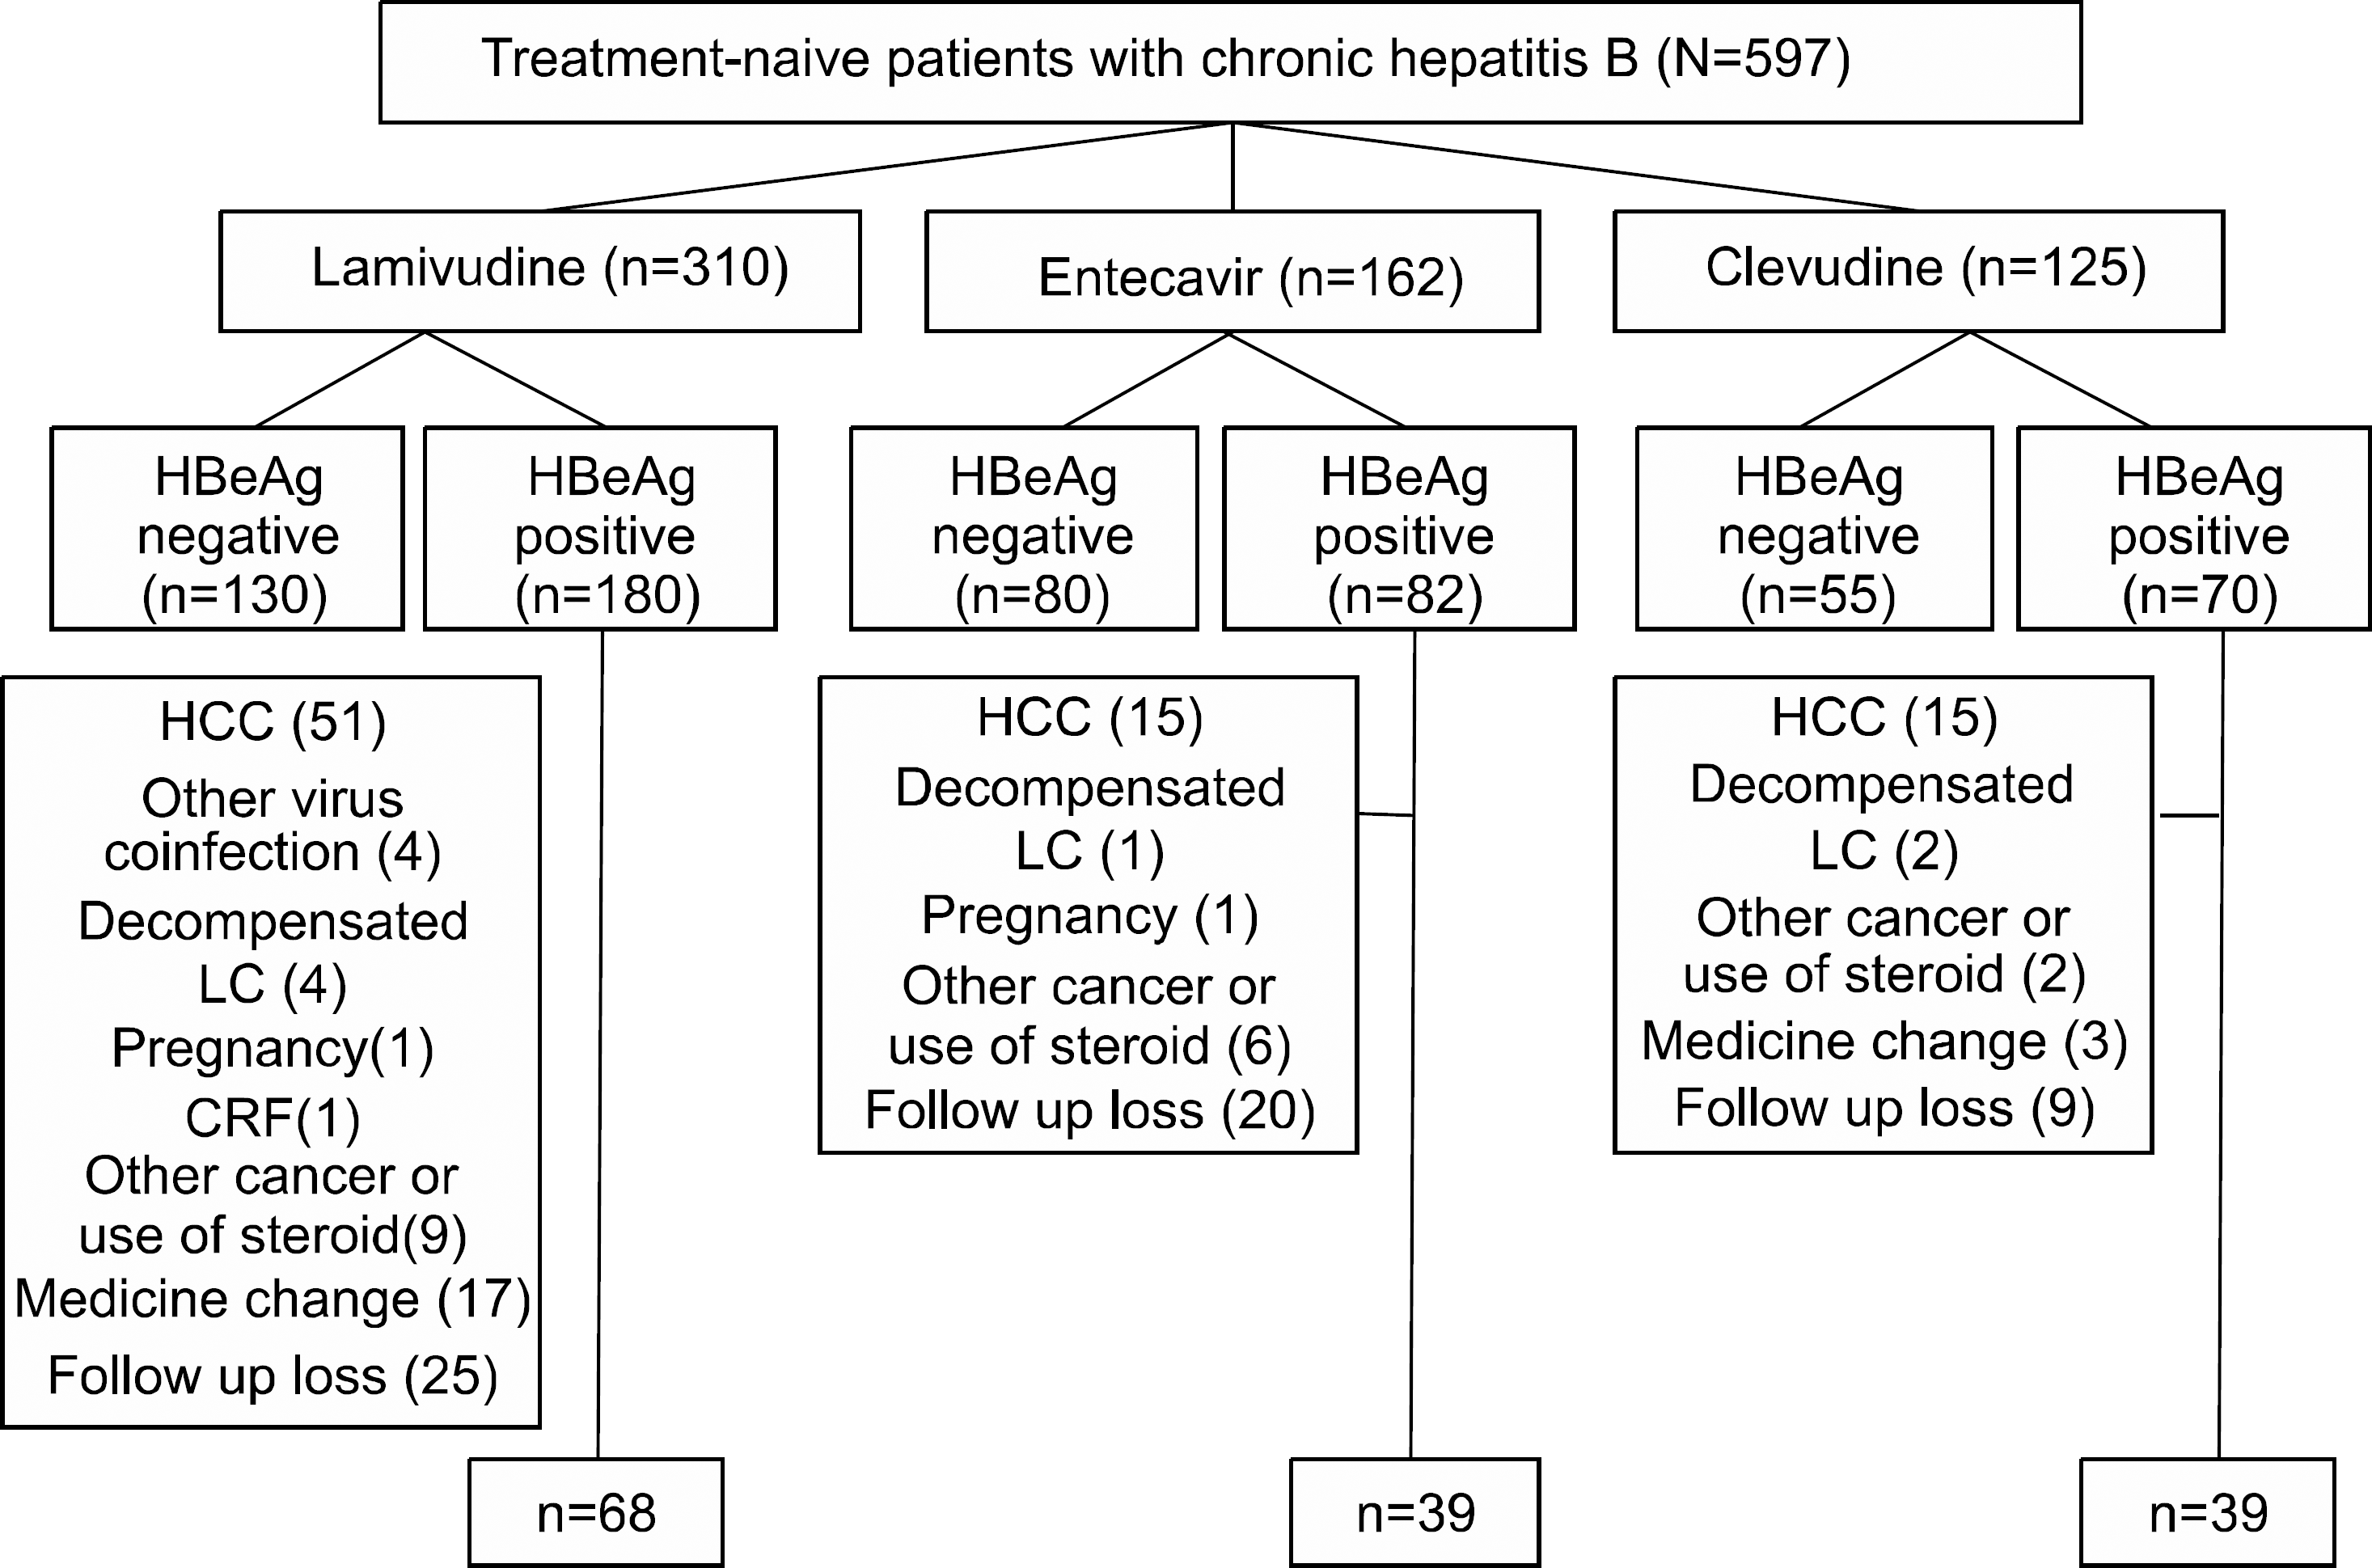
Fig. 1.
Schema of study population though 48 weeks. HCC, hepatocelluar carcinoma; LC, liver cirrhosis.

Fig. 2.
Changes of HBV DNA level (log copies/mL) from baseline through the 48 weeks. Mean±95% confidence interval plot of HBV DNA level (log copies/mL) according to PCR through 48 weeks by groups treated with clevudine, entecavir and lamivudine. p-values were derived from ANOVA for the comparison of change from baseline by groups.

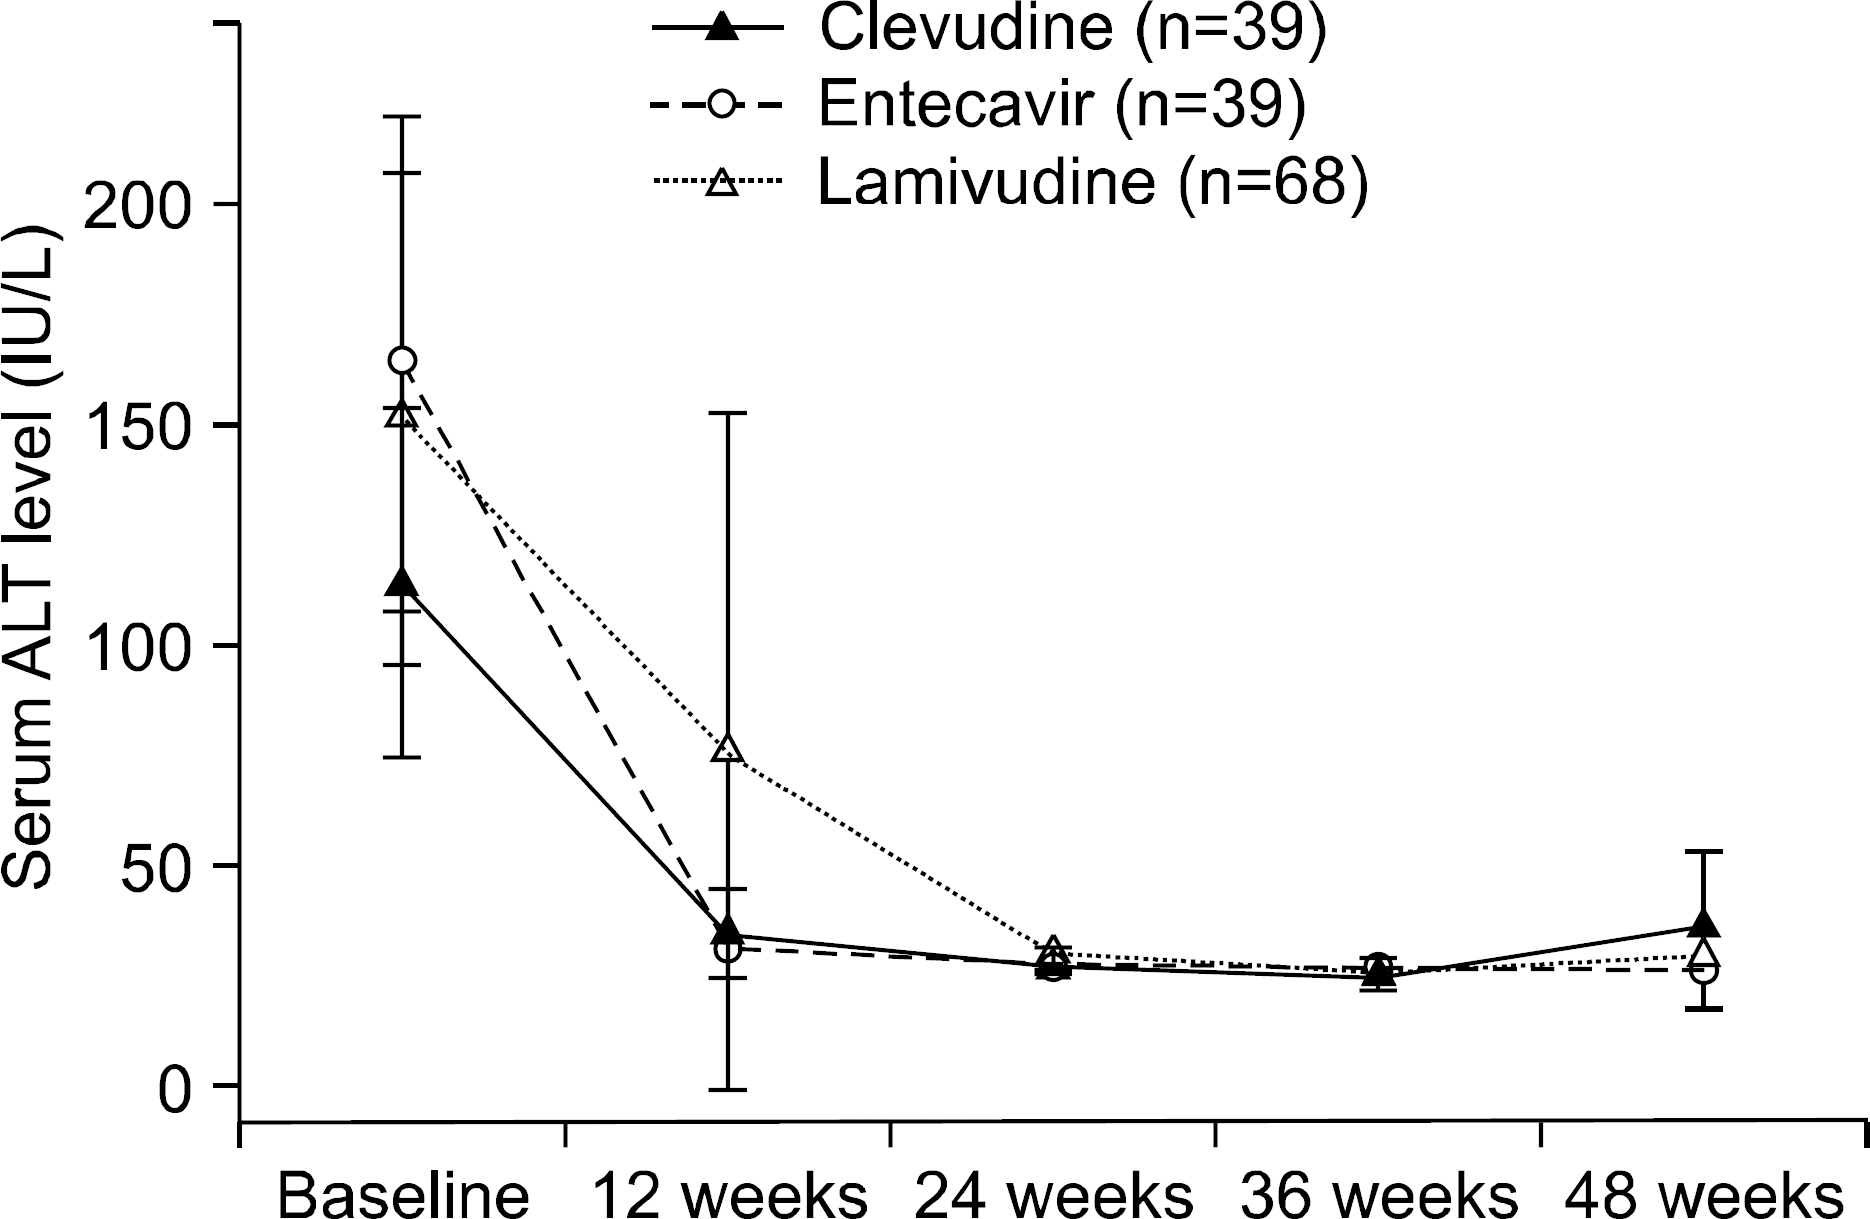
Fig. 3.
Changes of serum ALT level (IU/L) from baseline through the 48 weeks. Mean±95% confidence interval plot of serum ALT level (IU/L) through 48 weeks by groups treated with clevudine, entecavir and lamivudine. p-values were derived from ANOVA for the comparison of change from baseline by groups.

Table 1.
Baseline Characteristics of the Patients
Table 2.
Changes of HBV DNA Level (log copies/mL) from Baseline
| HBV DNA (log copies/mL) | Clevudine (n=39) | Entecavir (n=39) | Lamivudine (n=68) | p-value |
|---|---|---|---|---|
| At baseline | 7.0±1.5 | 6.9±1.4 | 7.3±1.3 | 0.34 |
| Change from baseline | ||||
| 12 weeks | −3.7±1.2∗ | −3.5±1.7∗ | −2.3±1.5† | <.0001 |
| 24 weeks | −4.3±1.5∗ | −4.3±1.5∗ | −2.7±1.6† | <.0001 |
| 36 weeks | −4.2±1.6∗ | −4.5±1.4∗ | −2.6±2.1† | <.0001 |
| 48 weeks | −3.8±2.2∗ | −4.5±1.9∗ | −2.5±2.1† | <.0001 |
Table 3.
Changes of Serum ALT Level (IU/L) from Baseline
Table 4.
Virologic, Biochemical, and Serologic Response at 48 Weeks
| Variable | Clevudine (n=39) | Entecavir (n=39) | Lamivudine (n=68) | p-value |
|---|---|---|---|---|
| HBV DNA <300 (copies/mL) (%) | 14 (39)∗ | 20 (69)† | 18 (27)∗ | <.0001‡ |
| ALT <35 (IU/L) | 32 (82) | 28 (74) | 48 (71) | 0.46 |
| Loss of HBeAg | 5 (13) | 12 (31) | 16 (24) | 0.15 |
| Seroconversion | 4 (10) | 9 (23) | 11 (17) | 0.32 |
Table 5.
Changes of HBV DNA (log copies/mL) from Baseline
| HBV DNA (log copies/mL) | Non-LC | LC | ||||||
|---|---|---|---|---|---|---|---|---|
| Clevudine (n=21) | Entecavir (n=22) | Lamivudine (n=35) | p-value | Clevudine (n=18) | Entecavir (n=17) | Lamivudine (n=33) | p-value | |
| At baseline | 8.0±1.2∗ | 7.0±1.6† | 7.8±1.1∗† | 0.042 | 5.9±1.2 | 6.7±1.1 | 6.8±1.3 | 0.058 |
| Change from baseline | ||||||||
| 12 weeks | −4.3±1.0∗ | −3.7±2.0∗ | −2.5±1.7† | 0.0010 | −3.1±1.0∗ | −3.3±1.1∗ | −2.0±1.3† | 0.0013 |
| 24 weeks | −5.0±1.1∗ | −4.5±1.5∗ | −2.9±1.6† | <0.0001 | −3.4±1.4∗ | −3.9±1.4∗ | −2.6±1.6† | 0.015 |
| 36 weeks | −5.0±1.1∗ | −4.8±1.4∗ | −2.7±2.3† | <0.0001 | −3.2±1.6 | −4.0±1.4 | −2.6±1.9 | 0.070 |
| 48 weeks | −4.±1.2∗ | −4.8±2.3∗ | −2.5±2.2† | <0.0001 | −2.5±2.6∗ | −4.2±1.2∗ | −2.5±2.0† | 0.036 |
Table 6.
Changes of Serum ALT (IU/L) from Baseline


 PDF
PDF ePub
ePub Citation
 Print
Print


 XML Download