

 PDF
PDF ePub
ePub Citation
 Print
Print


Abstract
Background/Aims
Colorectal adenoma and cancer are known to be associated with obesity. Leptin, an adipo-cyte-derived hormone that plays a crucial role in obesity has been suggested as a growth factor in colon cancer. However, the association between adenoma and leptin remains controversial. We evaluated the leptin expression in human colorectal adenoma and its correlation to clinicopathologic factors.
Methods
Leptin expression was assessed by immunohistochemistry in 91 samples of colorectal adenoma larger than 5 mm, which were removed by endoscopic polypectomy. All patients underwent colonoscopy for cancer screening at Seoul Paik Hospital from 2007 to 2008 and we only included the patients less than 50 years of age. Leptin expression and its relationship with clinicopathologic features were analyzed.
Results
Eighty samples were available for the interpretation of leptin expression and showed positive in 42 (52.5%) cases and negative in 38 (47.5%) cases. As body mass index (BMI) increased based on World Health Organization (WHO) classification the positivity of leptin expression also increased (p trend=0.02). In leptin positive group, the correlation of leptin expression with adenoma size and histological showed positive tendency without statistical significance.
Go to : 
REFERENCES
1. Thomas T, Burguera B, Melton LJ 3rd, et al. Relationship of serum leptin levels with body composition and sex steroid and insulin levels in men and women. Metabolism. 2000; 49:1278–1284.

2. Stattin P, Lukanova A, Biessy C, et al. Obesity and colon cancer: does leptin provide a link? Int J Cancer. 2004; 109:149–152.
3. Tamakoshi K, Toyoshima H, Wakai K, et al. Leptin is associated with an increased female colorectal cancer risk: a nest-ed case-control study in Japan. Oncology. 2005; 68:454–461.
4. Birmingham JM, Busik JV, Hansen-Smith FM, Fenton JI. Novel mechanism for obesity-induced colon cancer progression. Carcinogenesis. 2009; 30:690–697.
5. Slattery ML, Wolff RK, Herrick J, Caan BJ, Potter JD. Leptin and leptin receptor genotypes and colon cancer: gene- gene and gene-lifestyle interactions. Int J Cancer. 2008; 122:1611–1617.
6. Uddin S, Bavi PP, Hussain AR, et al. Leptin receptor expression in Middle Eastern colorectal cancer and its potential clinical implication. Carcinogenesis. 2009; 30:1832–1840.
7. Giovannucci E, Ascherio A, Rimm EB, Colditz GA, Stampfer MJ, Willett WC. Physical activity, obesity, and risk for colon cancer and adenoma in men. Ann Intern Med. 1995; 122:327–334.
8. Giovannucci E, Colditz GA, Stampfer MJ, Willett WC. Physical activity, obesity, and risk of colorectal adenoma in women (United States). Cancer Causes Control. 1996; 7:253–263.
9. Kim Y, Kim Y, Lee S. An association between colonic adenoma and abdominal obesity: a cross-sectional study. BMC Gastroenterol. 2009; 9:4.
10. Kim TO, Song GA. Obesity, insulin resistance, and the risk of colonic adenoma. Korean J Gastroenterol. 2007; 49:192–195.
11. Kim SE, Shim KN, Jung SA, Yoo K, Moon IH. An association between obesity and the prevalence of colonic adenoma according to age and gender. J Gastroenterol. 2007; 42:616–623.
12. Chia VM, Newcomb PA, Lampe JW, et al. Leptin concentrations, leptin receptor polymorphisms, and colorectal adenoma risk. Cancer Epidemiol Biomarkers Prev. 2007; 16:2697–2703.
13. Packeisen J, Buerger H, Krech R, Boecker W. Tissue micro-arrays: a new approach for quality control in immunohistochemistry. J Clin Pathol. 2002; 55:613–615.
14. Koda M, Sulkowska M, Kanczuga-Koda L, Surmacz E, Sulkowski S. Overexpression of the obesity hormone leptin in human colorectal cancer. J Clin Pathol. 2007; 60:902–906.
15. Ishikawa M, Kitayama J, Nagawa H. Enhanced expression of leptin and leptin receptor (OB-R) in human breast cancer. Clin Cancer Res. 2004; 10:4325–4331.
16. Hardwick JC, Van Den Brink GR, Offerhaus GJ, Van Deventer SJ, Peppelenbosch MP. Leptin is a growth factor for colonic epithelial cells. Gastroenterology. 2001; 121:79–90.
17. Ogunwobi OO, Beales IL. The anti-apoptotic and growth stimulatory actions of leptin in human colon cancer cells in-volves activation of JNK mitogen activated protein kinase, JAK2 and PI3 kinase/Akt. Int J Colorectal Dis. 2007; 22:401–409.
18. Tessitore L, Vizio B, Jenkins O, et al. Leptin expression in colorectal and breast cancer patients. Int J Mol Med. 2000; 5:421–426.
19. Aparicio T, Guilmeau S, Goiot H, et al. Leptin reduces the development of the initial precancerous lesions induced by azoxymethane in the rat colonic mucosa. Gastroenterology. 2004; 126:499–510.
20. Kumor A, Daniel P, Pietruczuk M, Malecka-Panas E. Serum leptin, adiponectin, and resistin concentration in colorectal adenoma and carcinoma (CC) patients. Int J Colorectal Dis. 2009; 24:275–281.
21. Brinton LA, Lacey JV Jr. Hormones and breast cancer: what's the story? Cancer Epidemiol Biomarkers Prev. 2007; 16:1697–1699.
22. Paik SS, Jang SM, Jang KS, Lee KH, Choi D, Jang SJ. Leptin expression correlates with favorable clinicopathologic phenotype and better prognosis in colorectal adenocarcinoma. Ann Surg Oncol. 2009; 16:297–303.
23. Ishikawa M, Kitayama J, Nagawa H. Expression pattern of leptin and leptin receptor (OB-R) in human gastric cancer. World J Gastroenterol. 2006; 12:5517–5522.
24. Lee JH, Reed DR, Price RA. Leptin resistance is associated with extreme obesity and aggregates in families. Int J Obes Relat Metab Disord. 2001; 25:1471–1473.
Go to :
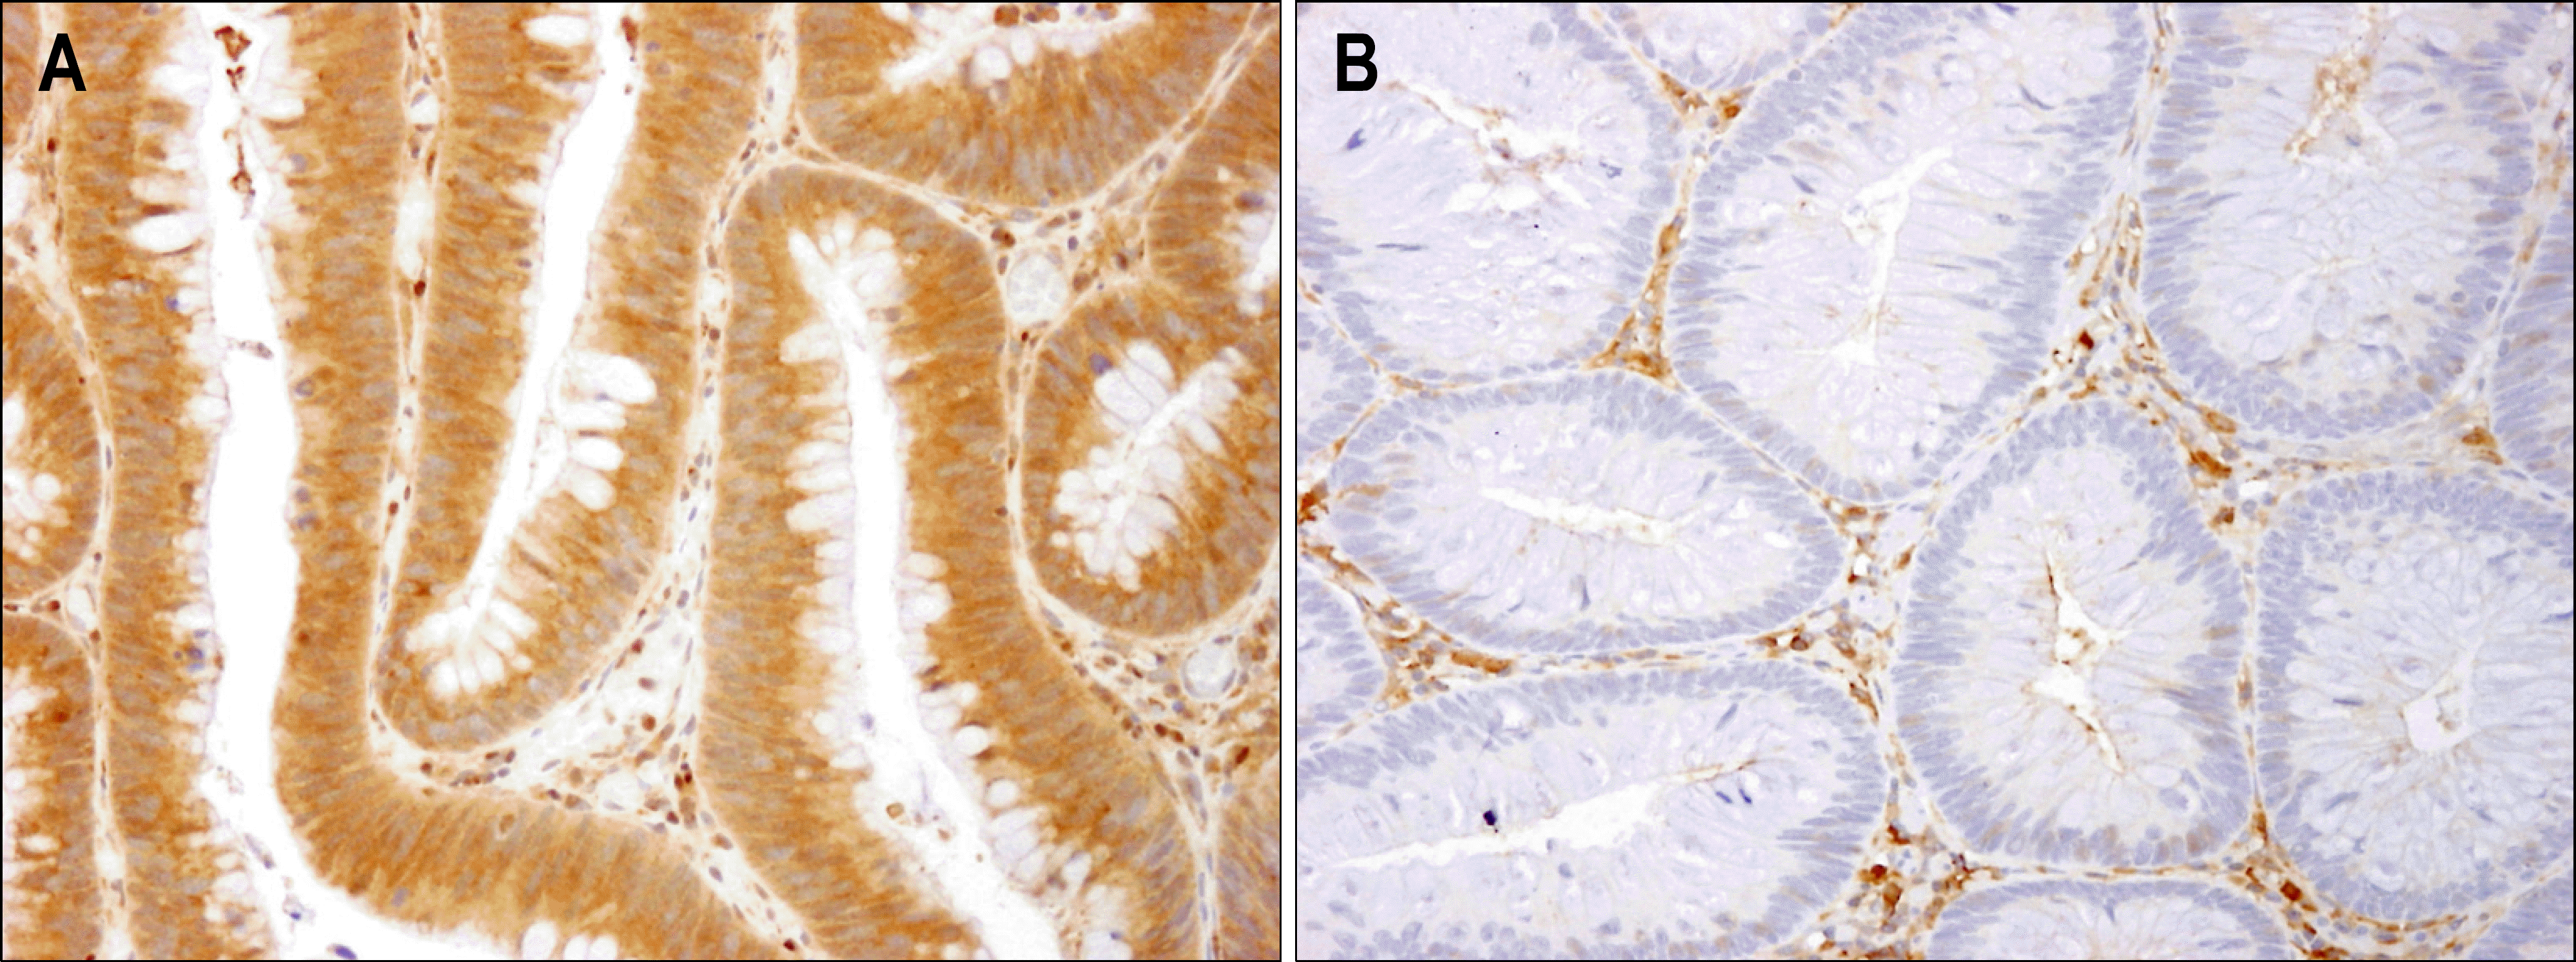 | Fig. 1.Immunohistochemical staining of leptin in colon adenomatous tissue. Leptin immunoreactivity was strongly identified in the cytoplasm of the colonic epithelial cells. (A) Positive leptin expression, (B) negative leptin expression (×200). |
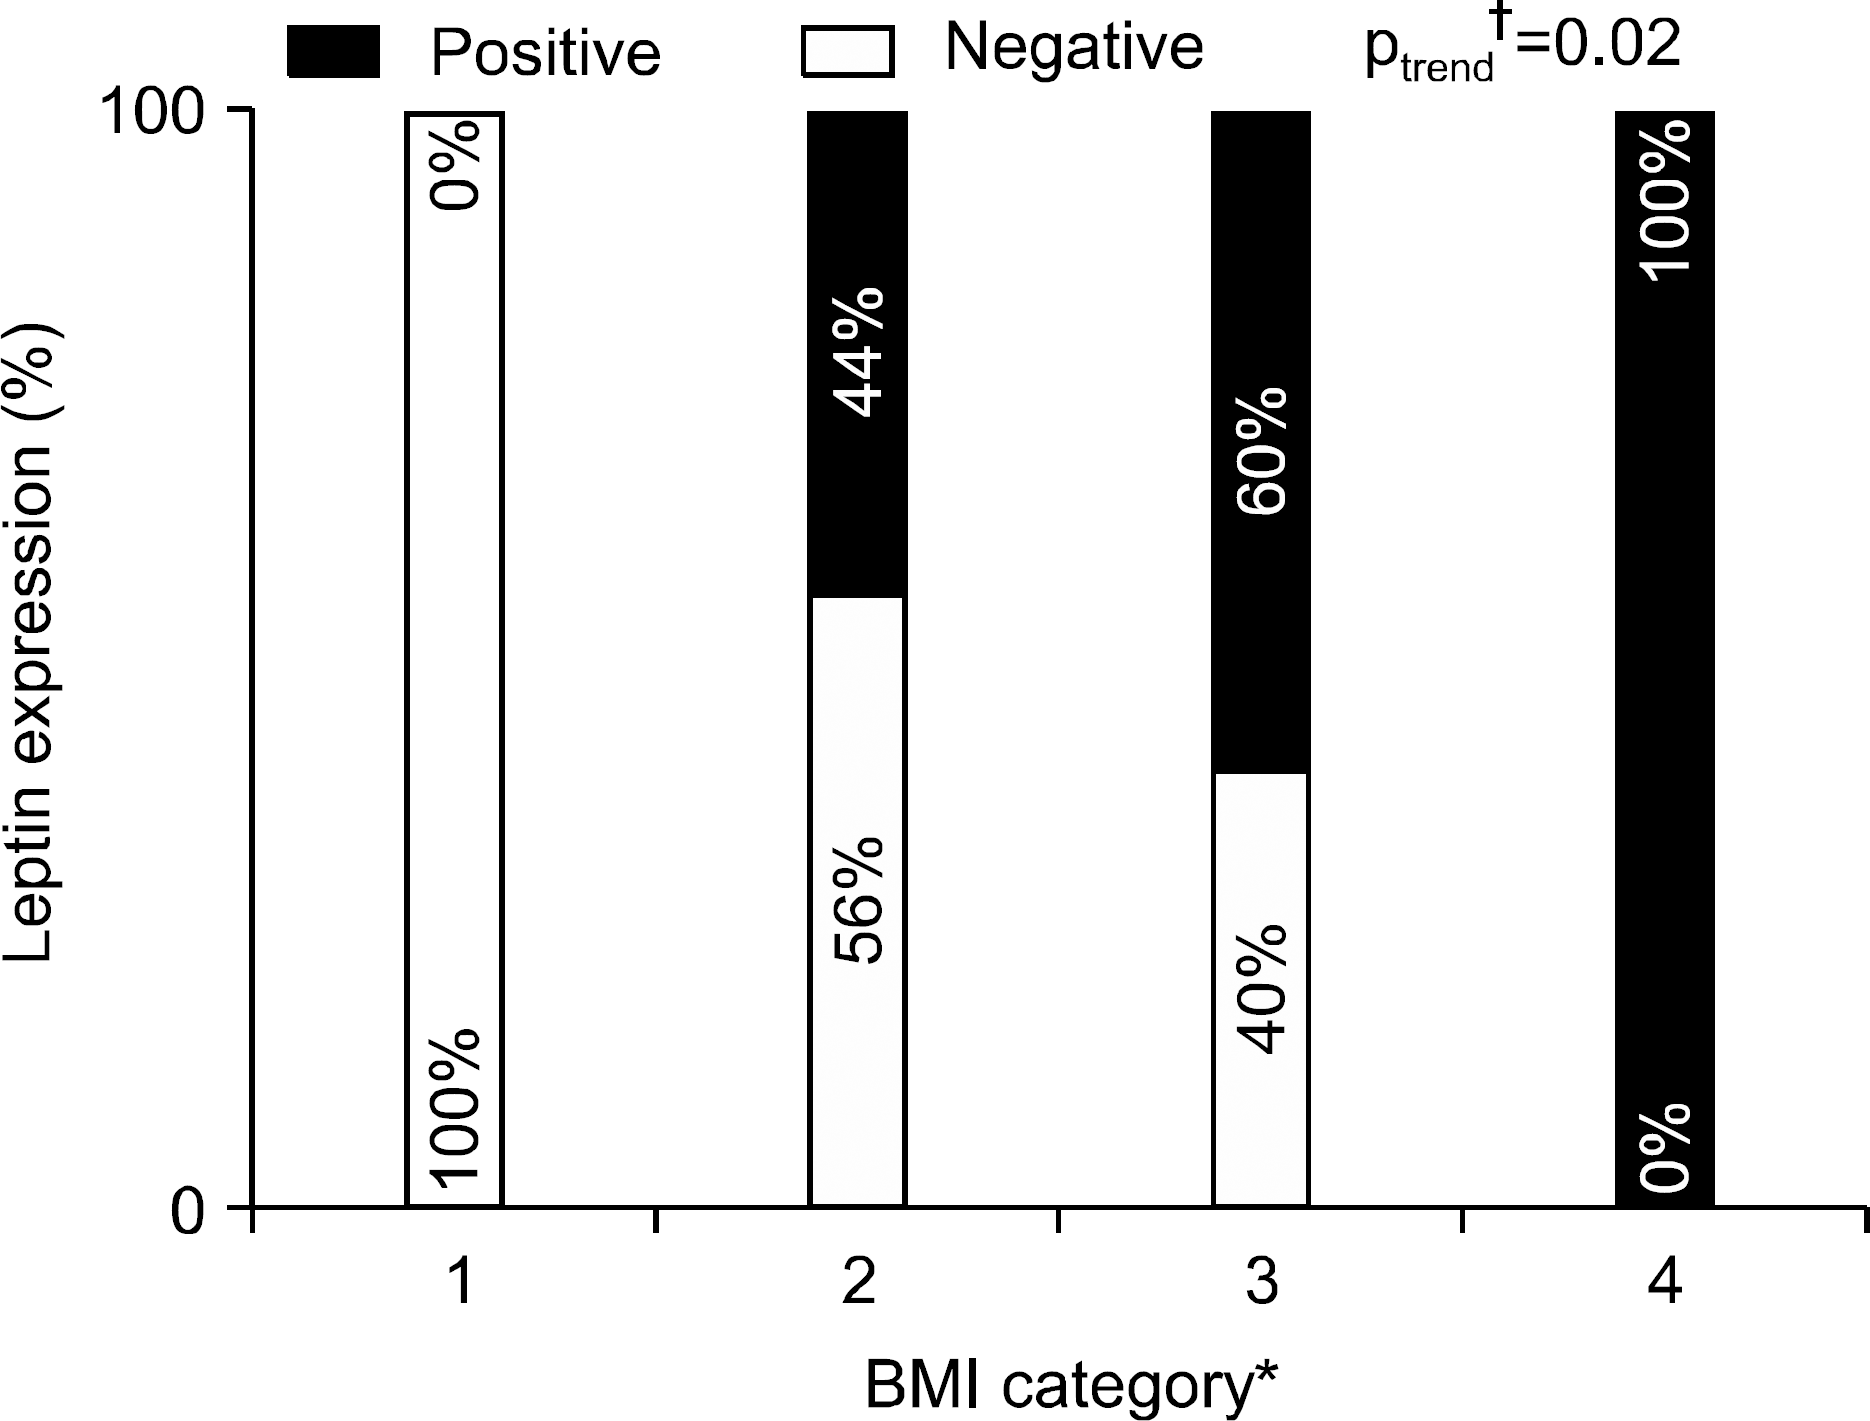 | Fig. 2.Correlation between leptin expression and BMI. As BMI increased, the positivity of leptin expression increased (p trend=0.02). 1, BMI<18.5; 2, 18.5≤ BMI<25; 3, 25≤ BMI<30; 4, BMI≥30. BMI, body mass index; WHO, World Health Organization.∗ BMI category was divided by WHO classification of obesity. † Chi-square test for linear trend. |
Table 1.
Clinicopathologic Variables of 80 Patients with Colorectal Adenoma
| Variables | N (%) | |
|---|---|---|
| Sex | Male | 68 (85.0) |
| Female | 12 (15.0) | |
| Age (years) | 42.4±5.3∗ | |
| BMI (kg/m2) | 24.4±3.2∗ | |
| Leptin | Positive | 42 (52.5) |
| Negative | 38 (47.5) | |
| Polyp size (cm) | 0.9±0.9∗ | |
| Polyp number | 1.8±1.1∗ | |
| Location | Left colon | 47 (58.7) |
| Rectum | 18 (22.5) | |
| Sigmoid colon | 21 (26.3) | |
| Descending colon | 8 (10.0) | |
| Right colon | 33 (41.2) | |
| Transverse colon | 3 (3.8) | |
| Ascending colon | 24 (30.0) | |
| Cecum | 6 (7.5) | |
| Pathology | Tubular | 68 (85.0) |
| Villotubular | 11 (13.8) | |
| Villous | 1 (1.3) | |
| Dysplasia | Low | 43 (53.8) |
| Low to high | 22 (27.5) | |
| High | 15 (18.8) | |
| BMI, body mass index. | ||
Table 2.
Correlation between Leptin Expression and Clinicopathologic Variables
| Variables | Leptin expression, n (%) | OR (95% CI) | p-value | ||
|---|---|---|---|---|---|
| Negative | Positive | ||||
| BMI (kg/m2) | <25 (n=42) | 24 (57.1) | 18 (42.9) | 2.29 (0.93-5.61) | 0.07 |
| ≥25 (n=38) | 14 (36.8) | 24 (63.1) | |||
| 23.6±3.0∗ | 25.0±3.3∗ | 0.05 | |||
| Gender | Male (n=68) | 31 (45.6) | 37 (54.4) | 0.60 (0.17-2.07) | 0.61 |
| Female (n=13) | 7 (58.4) | 5 (41.6) | |||
| Age | ≤40 (n=26) | 16 (61.6) | 10 (38.4) | 2.33 (0.89-6.07) | 0.08 |
| >40 (n=54) | 22 (40.5) | 32 (59.5) | |||
| 41.7±5.2∗ | 43.1±5.38∗ | 0.24 | |||
| Size | <1 cm (n=47) | 24 (51.1) | 23 (48.9) | 1.42 (0.58-3.47) | 0.44 |
| ≥1 cm (n=33) | 14 (42.4) | 19 (57.6) | |||
| 0.8±0.3∗ | 1.1±1.2∗ | 0.21 | |||
| Number | <3 (n=67) | 30 (44.8) | 37 (55.2) | 0.50 (0.15-1.71) | 0.27 |
| ≥3 (n=13) | 8 (61.5) | 5 (38.5) | |||
| Location | Left (n=47) | 24 (51.1) | 23 (48.9) | 1.42 (0.58-3.47) | 0.44 |
| Right (n=33) | 14 (42.4) | 19 (57.6) | |||
| Pathology | Tubular (n=68) | 32 (47.1) | 36 (52.9) | 0.53 (0.14-2.03) | 0.35 |
| Villotubular (n=11) | 5 (45.5) | 6 (54.5) | |||
| Villous (n=1) | 1 (100) | 0 (0) | |||
| Dysplasia | Low (n=43) | 22 (51.2) | 21 (48.8) | 1.46 (0.73-2.91) | 0.28 |
| Low to high (n=22) | 11 (50) | 11 (50) | |||
| High (n=15) | 5 (33.3) | 10 (66.7) | |||
Table 3.
Multivariate Analysis of Leptin Expression for Clinicopathologic Variables of Patients with Colorectal Adenoma
| Variables | Coefficient | OR | 95% CI | p-value |
|---|---|---|---|---|
| BMI∗ | 0.85 | 2.34 | 0.98 to 5.58 | 0.05 |
| Age | 0.73 | 2.08 | 0.78 to 5.57 | 0.15 |
| Size† | 0.30 | 1.35 | 0.50 to 3.68 | 0.56 |
| Pathology | 0.79 | 0.45 | 0.13 to 1.63 | 0.22 |
| Dysplasia grade | 0.42 | 1.52 | 0.77 to 2.98 | 0.23 |
| Polyp number | 0.35 | 0.71 | 0.43 to 1.16 | 0.17 |
| Location‡ | 0.13 | 1.14 | 0.41 to 3.20 | 0.80 |
 XML Download