

 PDF
PDF ePub
ePub Citation
 Print
Print


Abstract
Objective
Methods
Results
Figures and Tables
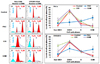 | Fig. 1DNA histograms (left) and linear diagrams (right) showing the changes of cell cycle phases and apoptotic populations (sub-G1 peaks) stained with propodium iodide (P1) and measured by FACScan flow cytometer in HeLa and OVCAR-3 cells. The blue peaks represent apoptotic populations (sub-G0G1 peaks). The first red peaks). The first red peaks represent the G0G1 phases of the cell cycles. The second red peaks represent G2M phases of cell cycles. The mid portions between two red peaks with diagonal lines represents S phases of cell cycles. (A) Untreated control cells, (B) cells treated with 1,000 nM of paclitaxel, (C) cells treated with 250 ng/mL of cisplatin, and (D) cells treated with 30 nM camptothecin. (E) and (F) The linear diagrams showing distributions of cell cycle phases and apoptotic sub-G0G1 peaks in HeLa and OVCAR-3 cells teated with 1,000 nM of paclitaxel, 250 ng/mL of cisplatin, and 30 nM of camptothecin.
|
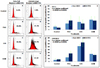 | Fig. 2The histograms are showing the levels of M30-FITC immunofluorescences (Number vs M30-FITC immunofluorescence) detected by flow cytometer in HeLa and OVCAR-3 cells treated with anti-cancer agents and the comparisons between sub-G0G1 phase fractions and positive M30-FITC immunofluorescences. The popilations in gate R2 indicate negative M30-FITC immunofluorescences and those in gate R3 indicate the apoptotic populations with positive M30-FITC immunofluorescences. (A) Untreated control cells, (B) cells treated with 1,000 nM of paclitaxel, (C) cells treated with 250 ng/mL of cisplatin, and (D) cells treated with 30 nM of camptothecin. (E) and (F) The correlation between the detected levels of sub-G0G1 fractions and M30-FITC immunofluorescences were evaluated by Spearman's Methods (correlation coefficient=0.59848, P=0.0003). There were no significant differences between them when compared by Wilcoxon Rank Sum Test.
|
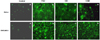 | Fig. 3The M30-FITC immunofluorescences observed under the immunofluorescence microscopy. (A) Untreated control HeLa and OVCAR-3 cells. There can be seen some positive cells with scanty intracytoplasmic M30-FITC immunofluorescences compared to the treated cells. (B~D) Cells treated with 1,000 nM of paclitaxel, 250 ug/mL of cisplatin, and 30 uM of camptothecin in order. There can be seen many cells with strong intracytoplasmic immunofluorescences in all of the treated cells, PAC: paclitaxel, CIS: cisplatin, CAM: camptothecin.
|
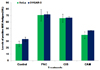 | Fig. 4The levels of M30 antigen in each cell line groups.
This figure showing the comparison between the levels of CK18-Asp396 (M30) antigen detected by ELISA in the culture media of untreated controls and HeLa and OVCAR-3 cell lines treated with 1,000 nM of paclitaxel, 250 ng/mL of cisplatin, and 30 uM of camptothecin. PAC: paclitaxel, CIS: cisplatin, CAM: camptothecin.
|
Table 1
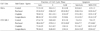
The HeLa and OVCAR-3 cells were treated with 1,000 nM of paclitaxel, 250 ug/mL of cisplatin, and 30 uM of camptothecin, respectively. The decreases or increases of fractions of G0G1, S and G2M phases of cell cycles from control were compared by the Wilcoxon Rank Sum Test (*P<0.05). The decreases or increases of fractions of sub-G0G1 and M30-FITC reflecting apoptosis were also compared from control by the Wilcoxon Rank Sum Test (*P<0.05). There were positive correlations between the values of sub-G0G1 fractions of cell cycles and M30-FITC immunofluorescences when they were analyzed by the Spearman's Correlation (correlation coefficient=0.59848, P=0.0003). There were no significant differences between the levels of sub-G0G1 fractions of cell cycles and M30-FITC immunofluorescences representing apoptosis observed after treatments, when they were compared by Wilcoxon Rank Sum Test.
![]()
Table 2

The differences among anti-cancer agents including controls were significant statistically when were evaluated by 2-Way ANOVA Test (*P<0.0001). The detected levels of M30-antigens were not different significantly between HeLa and OVCAR-3 two cell lines. The levels of M30-antigens detected after treatments with three agents were different from those of controls when were evaluated by unpaired T-Test (†P<0.05). The detected levels of M30-antigens were much higher in both of cell lines treated with paclitaxel and cisplatin than in those treated with camptothecin when compared to controls, when were evaluated by Schffe's Test. But there were no significant differences between paclitaxel and cisplatin.
![]()
 XML Download