

 PDF
PDF ePub
ePub Citation
 Print
Print


INTRODUCTION
Prostate cancer (PCa) is one of the most common cancers and the second most common cause of cancer-related death in men in the United States [1]. The incidence of PCa is relatively lower in Korea than in Western countries. However, the age-adjusted incidence rate of PCa in Korea increased from 10.1 per 100,000 people in 2002 to 27.0 per 100,000 people in 2012 [23]. According to the annual report of the National Cancer Center in 2012, PCa was the fifth most common cancer and the seventh most common cause of cancer-related death in Korean men [45].
To detect PCa, transrectal ultrasound (TRUS)-guided prostate biopsy is typically performed. The results of prostate biopsy may include PCa, benign diagnosis (e.g., benign prostate hyperplasia [BPH], inflammation, and prostatitis), high-grade prostatic intraepithelial neoplasia (HGPIN), and atypical small acinar proliferation (ASAP). In patients with a benign diagnosis, the cancer detection rate on repeat biopsy varies between 10% and 20% [67]. HGPIN is defined as proliferation of the acini and ducts in epithelial cells similar to that of PCa [68]. It has been reported that the cancer detection rate on second biopsy in patients with HGPIN ranges from 25% to 79% [69]. In addition, atypical glands may also be identified on prostate biopsy. ASAP is a term used by pathologists when the obtained tissue is not sufficient to be diagnosed with PCa but exhibits abnormal morphology [6]. It has been reported that the cancer detection rate on second biopsy in patients with ASAP ranges from 21% to 60% [69101112].
HGPIN and ASAP have been recognized as premalignant lesions and are potential risk factors for PCa [131415]. However, there is no consensus regarding the management of patients with HGPIN and ASAP. Therefore, we compared the cancer detection rate, Gleason scores on second biopsy, and unfavorable disease rate after radical prostatectomy (RP) in order to investigate the differences in patients with benign diagnosis, HGPIN, and ASAP on first biopsy. These results will provide important information for establishing the appropriate clinical management of Korean patients with HGPIN and ASAP.
MATERIALS AND METHODS
1. Patients
This study was approved by the Institutional Review Board of Samsung Medical Center in Seoul, Korea (IRB No.: 2015-06-129). We retrospectively reviewed data from 7,477 patients who underwent prostate biopsy between March 1995 and November 2012. Initial prostate biopsy was performed when the serum prostate-specific antigen (PSA) level was more than 2.5 ng/mL and/or there were abnormal findings on the digital rectal examination. Patients who were diagnosed with PCa on a first biopsy and those who did not undergo a second biopsy were excluded. The second biopsy was done when the result of the first biopsy included HGPIN and ASAP, and the PSA level was continuously elevated. Finally, a total of 1,323 patients who underwent a second biopsy were enrolled in this study.
The patients were divided into three groups according to the results of the first biopsy: benign diagnosis, HGPIN, and ASAP. Additionally, patients with HGPIN or ASAP were subdivided into two groups according to the number of positive cores: single core of HGPIN (HGPIN1), multiple cores of HGPIN (HGPIN≥2), single core of ASAP (ASAP1), and multiple cores of ASAP (ASAP≥2).
2. Comparisons
Clinicopathologic parameters such as age, prostate volume, PSA level on first and second biopsy, and the time between the first and second biopsy were compared among the three groups. PSA density (PSAD) was calculated by using the formula of the PSA level divided by the prostate volume on first biopsy [16]. PSA velocity was also calculated by dividing the time between the first and second biopsy into the change in the PSA level [17].
The cancer detection rate was compared and univariate and multivariate analyses were performed among the three groups to predict the diagnostic factors of PCa on a second biopsy, including clinical factors, HGPIN, and ASAP. Gleason scores and the rate of unfavorable disease were compared in patients who underwent RP. Unfavorable disease was defined as a Gleason score≥8, pathologic stage≥T3b (involving the seminal vesicle), and/or spread to the regional lymph nodes after RP.
3. Procedures
All patients underwent TRUS-guided prostate biopsy. We used an automatic biopsy gun with an 18-gauge needle to harvest the prostate tissue. To minimize hemorrhagic complications, patients were advised not to take any oral anticoagulants including aspirin for 7 days before the procedure. Laboratory studies including prothrombin time and activated partial thromboplastin time were checked routinely to confirm normal coagulation profile. Prophylactic antibiotics were prescribed to reduce infectious complications. All patients received an intramuscular dose of aminoglycoside just before the procedure, and oral ciprofloxacin and/or cephalosporin for 7 days after the procedure. Sextant biopsy was the standard method before 2009, which was later replaced by 12-core biopsies. All procedures were performed on a hospital-affiliated outpatient clinic basis, and all patients provided informed consent prior to the procedure.
4. Statistical analysis
Continuous and categorical variables were described as mean±standard deviation and absolute values (percentage), respectively. The distributions of clinicopathologic variables among the BPH, HGPIN, and ASAP groups were compared by using analysis of variance. Comparisons of Gleason scores and subgroups of HGPIN (HGPIN1 vs. HGPIN≥2) or ASAP (ASAP1 vs. ASAP≥2) were performed by using Pearson chi-square test. Comparisons of the cancer detection rate, unfavorable disease rate, and predictors for PCa were performed by using logistic regression. All statistical analyses were performed by using IBM SPSS Statistics ver. 20.0 (IBM Co., Armonk, NY, USA), and a two-tailed p-value <0.05 was considered to be statistically significant.
RESULTS
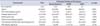
The baseline characteristics of the patients according to the results of the first biopsy are summarized in Table 1. A total of 1,323 patients were enrolled, and the patients' mean age was 62.9±8.8 years. The mean serum PSA level was 7.3±15.7 ng/mL and the mean prostate volume was 41.3±19.8 mm3 on the first biopsy. The mean PSAD was 0.2±0.3 ng/mL/mL and the mean PSA velocity was 0.9±9.9 ng/mL/y. Patients with HGPIN or ASAP were older than those with a benign diagnosis (p<0.001). The mean time between the first and the second biopsy was shorter in patients with HGPIN (7.5 months) than in those with a benign diagnosis or ASAP (32.9 and 30.1 months, respectively, p<0.001). However, prostate volume, PSA level on first and second biopsy, PSAD, and PSA velocity did not differ significantly among the three groups (each p>0.05).
Overall, 214 patients (16.2%) were diagnosed with PCa on the second biopsy (Table 2). PCa was detected in 164 patients (14.6%) with a benign diagnosis, in 33 patients (22.1%) with HGPIN, and in 17 patients (32.1%) with ASAP. The cancer detection rate was significantly higher in patients with HGPIN and ASAP than those with a benign diagnosis (HGPIN vs. benign diagnosis, p=0.027, and ASAP vs. benign diagnosis, p=0.004, respectively). However, there was no significant difference between the ASAP and HGPIN groups (p=0.150). When patients were divided into subgroups according to the number of positive cores, PCa was detected in 15 patients (16.7%) with HGPIN1 and in 18 patients (30.5%) with HGPIN≥2 (Table 3). The cancer detection rate was significantly different between the two subgroups (p=0.047). Patients with HGPIN1 and those with a benign diagnosis had similar cancer detection rate (16.7% and 14.6%, p=0.567, respectively). On the other hand, PCa was detected in 13 patients (31.0%) with ASAP1 and in 4 patients (36.4%) with ASAP≥2. The cancer detection rate was not significantly different between patients with ASAP1 and ASAP≥2 (p=0.732). However, patients with ASAP1 showed a much higher rate of cancer detection than in patients with a benign diagnosis (31.0% and 14.4%, respectively, p=0.003). The cancer detection rate was significantly higher in patients with HGPIN≥2 and ASAP on first biopsy.
In patients who were diagnosed with PCa on second biopsy, Gleason scores are summarized in Table 4. The HGPIN and ASAP groups had greater proportions of patients with a Gleason score≤6 than did the benign diagnosis group (57.6%, 70.6%, and 51.8%, respectively) and lower proportions of patients with a Gleason score≥8 than did the benign diagnosis group (6.1%, 5.9%, and 16.5%, respectively). However, there were no statistically significant differences in Gleason scores among the three groups (p=0.324). In patients diagnosed with PCa, additional analysis was performed in 131 patients who underwent RP (61.2%). Unfavorable disease was detected in 8 patients (8.3%) with benign diagnosis, 2 patients (8.0%) with HGPIN, and 1 patient (10.0%) with ASAP. However, there were no meaningful differences in the unfavorable disease rate (benign diagnosis vs HGPIN, p=0.857, and benign diagnosis vs ASAP, p=0.957 respectively) (Table 5).
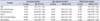
Table 6 shows the logistic regression analysis of predictors for PCa detection among the three groups. In the univariate analysis, age (p=0.003), PSA on first (p=0.001) and second biopsy (p<0.001), and PSAD (p=0.001) were significantly different in patients who were diagnosed with PCa. In the age-adjusted analysis, of these factors, PSA on first (p=0.005) and second biopsy (p<0.001) and PSAD (p=0.001) were significantly different. In the multivariate analysis, age (p=0.038), PSA on second biopsy (p<0.001), and PSAD (p<0.001) were significantly associated with an increased risk of PCa detection.
DISCUSSION
In the present study, we investigated the differences in the cancer detection rate, Gleason scores on second biopsy, and unfavorable disease rate after RP among patients with benign diagnosis, HGPIN, and ASAP on first prostate biopsy. A total of 214 patients (16.2%) were diagnosed with PCa on a second biopsy. Patients with older age, a higher serum PSA level on second biopsy, and a high PSAD had an increased risk of PCa detection in age-adjusted and multivariate analysis. The cancer detection rate was significantly higher in patients with HGPIN≥2 and ASAP on first biopsy. Therefore, when we interpret the results of the first biopsy, we should consider the potential risk of PCa according to the number of positive cores in patients with HGPIN and ASAP. To the best of our knowledge, this is one of the largest studies in Korea that has examined the significance of HGPIN and ASAP cores on first biopsy.
Several studies have reported that the cancer detection rate on second biopsy ranges from 25% to 79% and from 21% to 60% in patients with HGPIN and ASAP, respectively [691011121418]. In this study, 33 patients (22.1%) and 17 patients (32.1%) were diagnosed with PCa in the HGPIN and ASAP groups, respectively. The cancer detection rate in each group agrees with previously published data. Bishara et al. [19] reported that the cancer detection rate was higher in patients with multiple cores of HGPIN (35.9%) than in those with single-core HGPIN (22.0%). In our study, the cancer detection rate was significantly higher in patients with HGPIN≥2 than in those with HGPIN1 (30.5% vs. 16.7%, p=0.047). Iczkowski et al. [20] analyzed a total of 295 patients with ASAP and reported that PCa was detected in 125 patients (42.4%) on second biopsy. In our study, patients with ASAP also had a significantly higher cancer detection rate than did those with a benign diagnosis (32.1% vs. 14.6%, p<0.001).
Dorin et al. [21] reported that, when patients were diagnosed with PCa on second biopsy, the proportion of Gleason scores were as follows: Gleason≤6 was 83%, Gleason 7 was 15%, and Gleason≥8 was 4%. In our study, Gleason≤6 was 53.8%, Gleason 7 was 25.0%, and Gleason≥8 was 7.1%. There was a relatively higher proportion of patients with a Gleason score≥8 and a lower proportion of patients with a Gleason score≤6 in our study. Some studies have reported that patients diagnosed with PCa in Korea have higher Gleason scores than do Western patients, and that tendency may be reflected in our study. Byun et al. [2] reported that the percentages of patients with Gleason≤6 and Gleason≤8 were 48.1% and 13.6%, respectively [2]. However, there were no statistically significant differences in Gleason scores among three groups (p=0.324) in this study. Of the 214 patients diagnosed with PCa on a second biopsy, 131 patients (61.2%) patients overall underwent RP. Unfavorable disease after RP was detected in 8 patients (8.3%) with benign diagnosis, 2 patients (8.0%) with HGPIN, and 1 patient (10.0%) with ASAP. There were no meaningful differences in the rate of unfavorable disease among the three groups (benign diagnosis vs. HGPIN, p=0.857, and benign diagnosis vs. ASAP, p=0.957, respectively). Taken together, the results of HGPIN and ASAP on first biopsy were not correlated with Gleason scores on second biopsy or the unfavorable disease rate after RP in this study.
The mean time between the first and second biopsy was 32.8 months in the benign diagnosis group, 30.1 months in the ASAP group, and 7.5 months in the HGPIN group. If the result of the first biopsy was a benign diagnosis, regular follow-up was performed in 6 months, and each time the patients came to our hospital, their serum PSA levels were checked. A second biopsy was done if the PSA level was continuously elevated. If the result of the first biopsy is HGPIN or ASAP, the follow-up interval should be shorter than that for BPH. Usually, follow-up was performed in 3 months, and at that time we considered whether a repeat biopsy should be performed. If the PSA level was high, we recommended a repeat biopsy more strongly. In this study, there was a significant difference in the intervals between biopsies among the three groups (p<0.001). Short-term repeat biopsy was done in the HGPIN group, whereas the benign diagnosis and ASAP groups did not differ significantly (p=0.605). Although the higher rate of cancer detection in patients with ASAP on repeat biopsy has been reported previously [13], the timing of the repeat biopsy was delayed more than in those with HGPIN. One possible explanation of this finding is that we may underestimate the risk of ASAP and perform a delayed biopsy in some of these patients. Recently, on the basis of the results of this study, we have changed the institutional policy for performing a repeat biopsy. Short-term repeat biopsy in 6 months is recommended more strictly in patients with ASAP.
There were several limitations to this study. First, there was no centralized pathologic review related to the quality of diagnosis. Second, the number of biopsy cores changed over time. The differences in the number of biopsy cores could result in an underestimation of positive cores in the HGPIN and ASAP groups. We cannot exclude the possibility of actual HGPIN2 patients being misclassified as HGPIN1 in the sextant biopsy group. Third, we did not analyze the number of the cohort receiving a 5-α reductase inhibitor between the first and second biopsy, which could affect the serum PSA level. Also, the time between the first and second biopsy differed among the three groups, which also affected the bias with 5-α reductase inhibitor. The effect of a 5-α reductase inhibitor may be more significant in some groups and not significant in other groups. Thus, we cannot rule out that the use of 5-α reductase inhibitors may have influenced the results of the present analysis.
CONCLUSIONS
In summary, we compared the cancer detection rate, Gleason scores, and the rate of unfavorable disease to investigate differences in patients with benign diagnosis, HGPIN, and ASAP on first biopsy. The cancer detection rate was much higher in patients with multiple cores of HGPIN and at least one core of ASAP. Old age, a high PSA level on second biopsy, and high PSAD were associated with an increased risk of PCa detection. Therefore, repeat biopsy should be considered and not be delayed in those patients.


 XML Download