

 PDF
PDF ePub
ePub Citation
 Print
Print


INTRODUCTION
Renal cell carcinoma (RCC) is a well-known malignant disease of the urinary tract. Among various pathological types, chromophobe renal cell carcinoma (chRCC) is the third most frequent subtype and accounts for 4%-6% of RCC cases [1]. Prognosis in chRCC is better than in other types of RCC, and chRCC is known to have originated from intercalated cells of the collecting duct system [2]. Renal oncocytoma, a type of benign tumor that accounts for 3%-7% of all renal tumors [3], also originates from the collecting duct; therefore, chRCC and renal oncocytoma have overlapping morphologic, histochemical, immunohistochemical, and ultrastructural features [4]. As a result, it is sometimes difficult to distinguish the two tumor types in preoperative imaging studies. However, these tumors should be discriminated in order to make the decision to excise or observe because, unlike oncocytoma, chRCC can result in distant metastasis and even death due to disease progression [5].
A central stellate scar on enhanced computed tomography (CT) and spoke-wheel-like appearance on angiography have been conventionally recognized as the features that distinguish oncocytoma from other renal tumors [67]. However, these features are observed in only one-third of oncocytomas, and RCC can often show these characteristics. Therefore, differentiating an oncocytoma from a chRCC preoperatively has been an issue. In this regard, several studies recently demonstrated that segmental enhancement inversion could be a distinct feature of oncocytoma [89].
The most widely used method to evaluate a renal mass before deciding whether to excise or not is the interpretation of CT characteristics. Numerous studies have investigated the discrimination and description of renal tumors. In a review article, Dyer et al. [10] categorized renal masses into the ball and bean types, and concluded that their ball-versus-bean strategy is a practical framework for identifying the imaging characteristics of renal tumors. Other investigations have demonstrated that the complexity of the renal mass predicts its malignancy [1112]. Even the multiphasic enhancement patterns of the renal mass and the presence of an angular interface with the renal parenchyma could be used as prognosticators [1314]. We therefore conducted the current study to determine whether these various methods are helpful in distinguishing chRCC from renal oncocytoma in preoperative CT, and to integrate them in order to establish a simple diagnostic approach.
MATERIALS AND METHODS
The protocol for this retrospective study was approved by Institutional Review Board of Severance Hospital. This study was performed in accordance with tenets of the Declaration of Helsinki. We retrospectively reviewed all pathological reports that had been submitted with sufficient amounts of tumor tissue after partial nephrectomy or radical nephrectomy in Severance Hospital between November 2005 and June 2015. Operations had been performed by open, laparoscopic, video-assisted mini-incision, and robotic methods. Pathological reports originating from fine needle biopsies were excluded in this study. Two hundred forty nine patients who had been diagnosed with chRCC or renal oncocytoma were identified. Among them, 39 subjects without preoperative CT images, who had undergone only single or two-phase contrast-enhanced study, or with insufficient image quality performed in another hospital, were excluded. Finally, 210 patients who had undergone preoperative 3-phase (noncontrast, corticomedullary, and nephrogenic) or 4-phase (noncontrast, corticomedullary, nephrogenic, and excretory) CT, performed at least 3 months before surgery, were included in this analysis.
Two observers, who were urologists and blinded to the pathological results, reviewed the preoperative CT images. The laterality (left or right), size, and heterogeneity of the renal masses were observed. Size was determined as the maximal diameter in the axial plane. Each renal mass was categorized into either the ball pattern or bean pattern [10]. Briefly, a ball-type mass was defined as an exophytic mass that created a contour deformity in the renal margin with a pseudo-capsule. Bean-type mass was defined as a mass that retained the renal shape and infiltrated into the renal parenchyma as scaffolding. In addition, the existence of a central stellate scar and segmental inversion enhancement were examined. Segmental inversion enhancement was determined as previously described [8]; the tumor shows components of relatively greater enhancement in the corticomedullary phase and lesser enhancement in the nephrogenic phase. Furthermore, we categorized renal masses into three groups according to their interface with the renal parenchyma: round (absence of an angular interface), equivocal (intermediate interface type), and angular (definite angular interface) [14]. Furthermore mass-enhancing patterns were described as early washout, gradual enhancement, and prolonged. Furthermore, tumor complexity was scored using the RENAL nephrometry score in accordance with the standard for each item [15]: radius (R), exophytic/endophytic (E), nearness to the collecting system (N), anterior/posterior (A), and location relative to the polar lines (L). To calculate the probability of malignancy using the RENAL nephrometry score, we figured out the probability using the RENAL nephrometry nomogram [11].
In this study, a total of 4 phases were used in the analysis. The corticomedullary, nephrogenic and excretory phases were acquired at 25-30 seconds, 100-120 seconds, and 5 minutes, respectively, after the start of contrast injection. To analyze the mass-enhancing pattern of renal mass more accurately, we measured the Hounsfield units (HUs) in each phase. We measured the mean, maximum, and minimum HUs in the axial image, which showed the maximal diameter of the mass. We excluded the calcification of the mass in measuring HU. To evaluate intratumoral heterogeneity, we also measured the standard deviation of HU. We used the GE Centricity picture archiving and communication system (Centricity, GE Healthcare, Milwaukee, WI, USA) during the measurement procedure.
Data are presented as the median and interquartile range, unless otherwise indicated. For continuous variables, Mann-Whitney U test was used. For categorical variables, the chi-square test was used. The area under the curve (AUC) was used to determine the discrimination abilities of the RENAL nephrometry score nomogram. All statistical analyses were performed using IBM SPSS Statistics ver. 20.0 (IBM Co., Armonk, NY, USA). Differences were considered statistically significant at p<0.05.
RESULTS
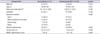
Table 1 lists pertinent study cohort data. There were 51 renal oncocytomas and 120 chRCCs in the study cohort. There were no differences in gender, patient age, and operation methods between the two groups (p=0.575, p=0.321, and p=0.890, respectively). Radical nephrectomy was performed in 43.1% and 45% of the patients in each group, respectively (p=0.823). The median tumor size of chRCC was a little bit larger than that of renal oncocytoma (4 cm vs. 3.3 cm), but the difference was not statistically significant (p=0.490). Renal nephrometry score was also higher in the chRCC group (8 vs. 7) without statistical significance (p=0.095).
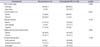
Table 2 shows the association of CT findings with histological diagnoses of renal masses. There were no differences in ball-/bean-type categorization and the shape of interface between groups (p=0.084 and p=0.193, respectively). Masses with a central stellate scar were more likely to be diagnosed as oncocytomas (p<0.001), as were renal tumors with segmental inversion enhancement (p=0.002). However, central stellate scar and segmental inversion enhancement were observed in only 39.2% and 45.1% of renal oncocytomas, respectively. There was no difference in the enhancement pattern of the masses between the two groups. The RENAL nephrometry score nomogram for discriminating malignancy between oncocytoma and chRCC revealed an AUC value of 0.53 (95% confidence interval [CI], 0.43-0.62).
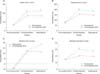
There was no difference in the mean HU value between oncocytoma and chRCC before enhancement; however, corticomedullary and nephrogenic phase attenuations were higher in oncocytoma than in chRCC (Fig. 1A). A similar relationship was seen with respect to maximal HU value in the tumor; however, there was no difference between the two groups with respect to the minimal HU value in tumor (Fig. 1B, C). The standard deviation of HU values in the tumor was higher in the corticomedullary phase in oncocytoma, whereas that of chRCC showed little change through the three phases.
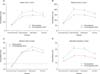
To observe changes in the excretory phase, we additionally analyzed 84 renal masses (28 oncocytomas and 56 chRCCs) that had all four phase images. The differences between the two groups were less than in the corticomedullary or nephrogenic phases; however, the overall pattern was similar in the excretory phase (Fig. 2). In the excretory phase, the mean HU value was higher in oncocytoma than in chRCC (Fig. 2A). In addition, there were no differences in minimal HU values throughout the phases (Fig. 2C).
Multivariate logistic regression analysis revealed an association between the presence of central stellate scar (odds ratio [OR], 5.164; 95% CI, 2.051-13.004; p<0.001) and higher mean HU in nephrogenic phase (OR, 1.043 for each 1 HU increase; 95% CI, 1.026-1.06; p<0.001) and oncocytoma. Receiver-operating characteristic curve analysis showed that the presence of a central stellate scar and a higher mean HU value in the nephrogenic phase were highly predictive of renal oncocytoma (AUC=0.817, p<0.001), which was more predictive than the prediction model made with the presence of a central stellate scar and segmental inversion enhancement (AUC=0.723).
DISCUSSION
There are many ways to describe and evaluate renal mass, and efforts are constantly being undertaken to distinguish whether a tumor is benign or malignant. Dyer et al. [10] classified renal masses into the bean- and ball-types according to radiological findings and compared this classification with the pathological results. The authors then attempted to classify each renal mass as either benign or malignant. Verma et al. [14] focused on the angular interface as a standard of judgment for determining benign and malignant. They used magnetic resonance images in their study instead of CT, and verified that the existence of angular interface reveals the benignity of the mass in >2-cm exophytic renal tumors. Multiphasic enhancement patterns of CT images have also been evaluated. Pierorazio et al. [13] interpreted multiphasic enhancement patterns of renal masses less than 4 cm in diameter using four-phase CT, and compared them with pathological results. Mullins et al. [12] insisted that tumor complexity was related to the malignancy of the renal mass, and demonstrated that a high RENAL nephrometry score and male gender are associated with increased risk of malignancy and high-grade malignancy.
Regarding the distinction between benign and malignant renal masses, distinguishing oncocytoma and chRCC is the one of the most challenging issues [4]. These two renal tumors are both known to originate from the intercalated cells of the collecting duct [16]. Therefore, these tumors have common characteristics in morphologic, histochemical, immunohistochemical, and ultrastructural aspects [4]. In pathology, these two tumor types are usually distinguished based on the presence of eosinophilic variants; however, research into this aspect is ongoing in the field of radiology [16]. In recent studies, the presence of a central stellate scar and segmental enhancement inversion have attracted attention as radiological features of renal oncocytoma [817]. The central stellate scar is a radiological as well as pathological finding, and 25%-33% of large renal oncocytomas show a central stellate scar in CT [17]. In the present study, 39.2% (20 of 51) of oncocytoma and 10% (12 of 120) of chRCC patients showed a central stellate scar. The difference was statistically significant (p<0.001), but this finding is not sufficient to distinguish oncocytoma from chRCC because only one-third of renal oncocytomas presented this feature.
Segmental enhancement inversion is another discriminative finding of renal oncocytoma. In a meta-analysis to evaluate the diagnostic accuracy of segmental enhancement inversion from 4 studies of 307 patients, Schieda et al. [18] concluded that segmental enhancement inversion in contrast-enhanced biphasic multidetector CT is a specific feature of renal oncocytoma. However, the sensitivity of the studies varied (0%-6% to 59%-80%); this was considered a limitation. The sensitivity of segmental enhancement inversion based on our results was 45%, which is not high enough. Nonetheless, only 22% of chRCC showed segmental inversion, and it was significantly lower than oncocytoma (p=0.002). These results indicate that segmental enhancement inversion might help distinguish these tumors to some degree.
Pierorazio et al. [13] tried to analyze multiphasic enhancement patterns of renal masses according to the final pathological results. In this report, the authors verified that significant differences were observed in peak enhancement and phase-specific enhancement by histology. They also demonstrated that oncocytoma showed patterns of peak enhancement in the nephrogenic phase and washout in delayed phase, while chRCC showed an intermediate enhancement pattern. However, these results are not powerful because of the insufficient number of subjects in this study (13 oncocytomas and 10 chRCCs). In their comparative study of CT appearance in renal oncocytoma and chRCC, Wu et al. [17] demonstrated that oncocytoma presents as a heterogeneous and hyperdense solid tumor, whereas chRCC presents as an isodense or mild hyperdense mass. In the present study, we measured the maximal, minimal, and mean HU values of the preenhancement, corticomedullary, and nephrogenic phases in order to evaluate the enhancement pattern on each phase, and furthermore measured the standard deviation of HU to estimate intratumoral heterogeneity. The mean and maximal HU values of oncocytoma were greater than chRCC in the corticomedullary and nephrogenic phases, which reveals that oncocytoma is more enhanced after dye injection than chRCC. The standard deviation of HU values was greater in oncocytoma than in chRCC, indicating that oncocytoma has more intratumoral heterogeneity than does chRCC. These features would be clinically useful to distinguish oncocytoma from chRCC.
Beyond a qualitative description of the renal mass as heterogeneous or homogeneous, no quantitative method has yet been developed to measure the heterogeneity. Taura et al. [19] attempted a quantitative analysis of the heterogeneity of hepatic parenchymal enhancement using CT during arterial portography, and demonstrated that the higher fibrosis group exhibited significantly greater standard deviation values than did the lower fibrosis group. In addition, Kojima et al. [20] measured standard deviation as an index of the heterogeneity of renal cortical circulation, and verified that heterogeneity of renal cortical circulation is increased in hypertension and is associated with aging. To our knowledge, no study has estimated intratumoral heterogeneity by measuring the standard deviation of HU values.
Limitations of the present study include its retrospective nature and relatively small subject number. Because we included only pathologically confirmed patients, radiologically confirmed oncocytomas that were not surgically excised and renal tumors treated by nonsurgical methods such as cryotherapy were excluded, which could be a selection bias. In addition, we compared only oncocytoma and chRCC; evaluations of other renal masses were not conducted. However, chRCC is the renal mass type that is most commonly misdiagnosed as renal oncocytoma is chRCC, and we therefore tried to identify a method to distinguish the two tumors preoperatively. Furthermore we could not measure HU values and standard deviations in the whole renal tumor, because of the marginal irregularity of the masses.
CONCLUSIONS
Oncocytoma is more likely to show segmental enhancement inversion and a central stellate scar. However, these features were not common even in oncocytomas and are insufficient for preoperative clinical distinction of these two types of renal masses. Oncocytoma presented higher HU values in the corticomedullary and nephrogenic. In addition, oncocytoma showed greater standard deviation of HU values than did chRCC. Collectively, these results indicate that the central stellate scar and higher mean HU values in the nephrogenic phase are highly predictive of renal oncocytoma. These results could be clinically useful in differentiating renal oncocytoma from chRCC before surgical treatment.
 XML Download