

 PDF
PDF ePub
ePub Citation
 Print
Print


INTRODUCTION
Urinary calculi are commonly encountered in clinical practice and their composition or mineralogy has a crucial role in determining patient management [1]. For example, uric acid (UA) calculi can be treated by oral chemolysis, thus avoiding more invasive therapies, whereas certain calculi like calcium oxalate monohydrate (COM) calculi, which are denser in nature, are less amenable to extracorporeal shock wave lithotripsy [1].
Various methods have been used to predict stone mineralogy in vivo. Urine biochemical parameters such as urinary sodium, calcium, oxalate, and UA may provide clues to stone composition [2]. The Hounsfield unit (HU) value of urinary calculi obtained from noncontrast computed tomography (NCCT) has been shown to affect treatment decisions in a few studies [34]. However, the exact chemical composition of calculi cannot be diagnosed by use of these methods. Thus, in present clinical practice, stone composition is evaluated only after stone extraction.
With the recent commercial availability of dual-energy computed tomography (DECT), many investigators have evaluated the ability of this scanning method to identify calculus composition before extraction, i.e., in vivo. DECT consists of scanning the same anatomic region at two different energy levels. Because of inherent differences in atomic number, calculi of differing compositions exhibit disparate attenuation properties at different energy or kilovoltage levels. This property is exploited to predict the composition of the calculi. Moreover, DECT also provides all anatomic information provided by conventional NCCT. Among the different types of dual-energy scanners, dual-source DECT (DS-DECT) scanners have been the most popular. The initial studies [567] were conducted with dual-source scanners without added filtration on the x-ray tube (known as first-generation dual-source scanners) and were able to differentiate only UA-containing and calcium-containing calculi. With the addition of a tin filter in the second-generation dual-source scanner, a few phantom and in vivo studies [891011] have shown that differentiation even among the various non-UA-containing calculi is possible.
At the same time, it is also important not to ignore the issue of the radiation dose delivered to the patient. Traditionally, low-dose conventional CT for urolithiasis detection has been defined as CT imparting an effective dose less than 3 mSv [12]. In our study, we attempted to combine these two aspects of urolithiasis imaging, namely, accurately predicting the composition of urinary calculi and reducing the radiation dose imparted to the patient, by use of a second-generation DS-DECT scanner.
MATERIALS AND METHODS
This was a single-institution prospective study conducted over a period of 2 years from January 2013 to December 2014. It was approved by the Ethics Committee of Post Graduate Institute of Medical Education and Research (PGIMER), Chandigarh, India. A total of 132 patients suspected of having a calculus in the kidney or ureter were included in the study. Informed consent was obtained from all participants included in the study. We excluded pregnant patients and children aged less than 15 years. Confirmatory stone analysis was not available in 80 of these 132 patients, because they did not undergo stone extraction. Hence, a total of 52 patients were included in the final analysis.
1. Image acquisition
Patients included in the study were scanned by use of a second-generation 128-slice DS-DECT scanner (Somatom Definition Flash, Siemens Healthcare, Forchheim, Germany). The two x-ray tubes in the scanner were set to operate at 80 and 140 kV (with added tin filtration) with corresponding reference tube current-time products (mAs) of 105 and 41 mAs. These reference mAs levels represent approximately one-fourth of the manufacturer-prescribed reference mAs used for routine DS-DECT. This was done to reduce the radiation dose. The CareDose4D (Siemens Healthcare) was used to further adapt tube current to individual body habitus. Collimation was 64 mm×0.6 mm with z-flying focal spot and the pitch was 0.7.
2. Image interpretation and rating of study quality
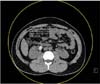
Weighted average 1-mm thick images (weighting factor, 0.3) were reconstructed by using a standard soft-tissue kernel (Q30f). The dual-energy (DE) ratio and weighted average HU value of each calculus were recorded by manually placing circular regions of interest (ROIs) on the calculi (Fig. 1). The DE ratio was obtained by dividing the attenuation value of the calculus at 80 kV by its attenuation value at 140 kV. Circular ROIs were placed in the aortic lumen at the level of the renal pelvis and in the urinary bladder lumen at the level of the femoral head. The standard deviation (SD) was recorded in these ROIs as a quantitative measure of image noise. In addition, waist circumference was measured on axial sections at the level of the midpoint between the lower margin of the last rib and the top of the iliac crest. Radiation dose information for each study was recorded.
Two radiologists blinded to the patient's details were provided the images to assess the quality of the weighted average images subjectively. The subjective rating of study quality was based on the radiologists' confidence in detecting the calculi, related soft tissue attenuation changes such as perinephric stranding and soft tissue ureteric rim, subjective assessment of the amount of image noise, and image sharpness. By use of these criteria, the two observers rated the studies as being good, average, or poor in quality.
3. Confirmatory analysis of stone composition
Stones extracted during percutaneous nephrolithotomy or ureteroscopy were subjected to Fourier transform infrared spectroscopy (FTIRS). All stone fragments extracted during the procedure were submitted for analysis. The spectrum was recorded in the SpectrumTwo FTIRS device (Perkin Elmer, Buckinghamshire, UK). According to the FTIRS results, the calculi were classed into five groups: mixed calcium oxalate monohydrate and dihydrate (COM+COD), COM, carbonate apatite (CA), struvite, and UA. The calculi were then retrospectively compared with their HU values and DE ratios.
4. Statistical analysis
Analysis of variance (ANOVA) was used to determine if significant differences existed between the DE ratio values of each calculus group. The HU values of each calculus group were subjected to similar analysis. Receiver operating characteristic (ROC) curve analysis was used to identify optimal cutoff DE ratio values to differentiate the various groups of calculi. Image noise and patient radiation dose were compared with patient waist circumference by use of correlation analysis.
RESULTS
The study population consisted of 37 males (71.2%) and 15 females (28.8%) with a mean age of 39 years (SD, 12.17; range, 20-63 years). A total of 137 calculi were detected in these patients. FTIRS analysis showed that 29% of the calculi (n=40) were pure stones, whereas the remaining stones were mixed stones. All of the calculi of mixed composition had a principal constituent stone type contributing to at least two-thirds (>66%) of the stone on the basis of the FTIRS analysis. The number of calculi in each group was as follows: UA (n=17), struvite (n=3), COM+COD (n=84), COM (n=28), and CA (n=5).
1. Size and location of calculi
The mean calculus size was 15.2 mm (range, 4-31 mm; SD, 5.9 mm). There were 29 calculi measuring <10 mm in diameter, of which 28 were calcium oxalate calculi and one was a CA calculus. All of these calculi were correctly classified as calcium-containing calculi by using DE ratio values. The majority of the stones (~97%) were located in the kidneys; five stones were located in the ureters. All stones in the ureteric location were calcium oxalate stones and were classified correctly by using the DE ratio.
2. HU value and DE ratio
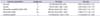
The distribution of the HU values and DE ratios of the calculi is depicted in Table 1. ANOVA analysis showed that HU values could differentiate only UA calculi and calcium-containing calculi confidently (p<0.001). ROC analysis also showed a significant difference between UA calculi and other calculi (area under curve=0.952) with a cutoff of <615 HU having 94.1% sensitivity and 94.2% specificity for identifying UA calculi.
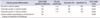
ANOVA analysis showed that there was a significant difference in the DE ratio between the groups (p<0.001). Uric acid calculi had the lowest DE ratio value, followed by progressively higher values in struvite, calcium oxalate, and CA calculi. There was no overlap in the DE ratio of UA and other calculi, with a DE ratio of <1.22 having 100% sensitivity and specificity for identifying UA calculi. The results of the ROC curve analysis of the DE ratios used to differentiate between struvite, calcium oxalate, and calcium carbonate and the further attempted subclassification of calcium oxalate calculi are depicted in Table 2.
3. Waist circumference, image quality, and radiation dose
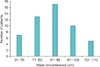
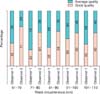
The mean waist circumference of the study population was 85.25 cm (SD, 11.2; range, 66-110 cm). The distribution of waist circumference is depicted in Fig. 2. The image quality was assessed by two observers independently and was scored as good, average, or poor. Observer 1 rated 38% of studies as good quality and 62% as average quality. Observer 2 rated 63% of studies as good quality and 37% as average quality. None of the studies were rated as being poor or uninterpretable in quality by either observer. Interobserver agreement was fair (kappa=0.339). The distribution of study quality rating according to waist circumference is depicted in Fig. 3. From this graph we note that high waist circumference did not have a detrimental effect on study quality.
The noise measured in the aortic lumen showed only a weak positive correlation with the waist circumference (Pearson correlation coefficient=0.283, p<0.05). Noise measured in the urinary bladder did not show a significant correlation with waist circumference.
Radiation dose parameters were recorded in 45 patients. There was a significant correlation between the waist circumference and the volumetric computed tomography dose index (CTDIvol) with a Pearson correlation coefficient of 0.917 (p<0.01). The mean CTDIvol was 2.4 mGy (SD, 0.7). The mean dose length product (DLP) was 103.13 mGy·cm (SD, 27.9). The mean effective dose was obtained by multiplying the DLP by a weighting factor of 0.018 mSv/mGy·cm [13], which yielded a mean effective dose of 1.85 mSv (SD, 0.5).
DISCUSSION
1. Calculus composition
In this study, DECT was accurate in differentiating UA, struvite, and CA calculi from calcium oxalate calculi. Noninvasive therapies like urine alkalinization can be offered to patients with UA calculi [1]. Both struvite and CA stones are associated with urinary tract infections [1415]. For stones associated with infection, the risk of posttreatment sepsis and recurrence of calculi is higher [15]. Hence, identification of these calculi in vivo may help in directing appropriate therapy even before stone extraction.
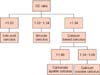
The discriminant DE ratio values obtained in our study for identifying calculus composition are depicted in Fig. 4. These values are similar to those reported by a phantom study performed by Qu et al. [8] (<1.19 for UA, 1.19-1.46 for cystine, 1.46-1.60 for struvite, 1.60-1.71 calcium oxalate and struvite, and >1.71 for CA and hydroxyapatite) except for struvite stones. This may have been due to the small sample size of struvite calculi (n=3 in our study and n=4 in the phantom study). The study by Acharya et al. [10] is the only previous in vivo study (to the best of our knowledge) performed in the second-generation DS-DECT scanner that has shown the possibility of subdifferentiating non-UA calculi. However, the tube voltage setting used in their study was 100/140 Sn (tin filter) compared with 80/140 Sn used in our study. Whereas Acharya et al. [10] showed that the cutoff DE ratio value of <1.335 had 100% specificity for detection of COM calculi resistant to extracorporeal shock wave lithotripsy, we could not differentiate pure COM from mixed COM+COD calculi in our study.
In our study, we included calculi of mixed composition, with the caveat that the major constituent should contribute to at least two-thirds of the total mass of the calculus. Most studies done earlier included only pure stones or mixed stones in which the major constituent contributed to at least 90% of the total, which does not reflect clinical reality. Thus, our study sample is likely to be more representative of the patient population with urolithiasis.
2. Radiation dose, patient size, and image quality
Radiation exposure in routine CT studies of the abdomen varies between 3 and 25 mSv [16]. Carcinogenesis induced by radiation in the diagnostic energy range is a highly controversial issue. It has been shown that radiation exposure in range of 10 to 100 mSv in atomic bomb survivors is associated with increased risk of carcinogenesis [17]. With epidemiological data lacking for the effects of radiation doses below 10 mSv, the linear no threshold model, which states that there is no safe threshold radiation dose below which radiation-induced carcinogenesis does not occur, has been followed. Relatively few studies have assessed the role of low-dose DECT for predicting urinary calculus composition [1819], and non-UA calculi could not be confidently differentiated in those studies. Ascenti et al. [20] acquired a routine single-energy low-dose CT followed by a targeted DE acquisition of the region containing the calculus. This protocol is difficult to implement in patients with multiple calculi and moreover requires the presence of a radiologist to review the images while the patient is in the scanner. To the best of our knowledge, our study is the first to assess a low-dose DECT protocol in the second-generation DS-DECT scanner.
The radiation doses obtained in our study represent a 3-fold reduction in radiation dose compared to standard-dose DECT (4.5-7 mSv) and a 2- to 3-fold reduction compared to standard-dose single-energy NCCT (4-5 mSv) [21]. Compared to low-dose single-energy NCCT (0.9-1.9 mSv) [21]-the recommended mode for urinary calculus evaluation-there is only a marginal increase in dose.
Patient size did not have any appreciable effect on subjective image quality (Fig. 3) or on the measured image noise. Thus, this low-dose protocol can be relied upon to produce images of at least reasonable quality even in obese patients
3. Study limitations
The limitations of our study were as follows. The number of struvite and CA calculi encountered in our study was low and hence the DE ratio values of these calculi need further validation by studies with larger sample size. We did not encounter any cysteine, brushite, or hydroxyapatite calculi. Moreover, we could not assess firsthand the impact of calculus composition detection using DECT on patient management. This would require further studies in which the management decisions in patients with urolithiasis are made on the basis of the composition obtained by DECT analysis.
CONCLUSIONS
Low-dose DECT can identify calcium oxalate, UA, struvite, and CA urinary calculi in vivo with a high degree of accuracy while reducing patient radiation exposure significantly and without compromising study quality. Low-dose DECT could possibly replace conventional NCCT as the diagnostic test of choice for urolithiasis.
 XML Download