

 PDF
PDF ePub
ePub Citation
 Print
Print


INTRODUCTION
Robotics may be one of the most rapidly propagating technologies in urologic surgery, with robot-assisted radical prostatectomy (RARP) comprising 67% of all radical prostatectomies performed in the United States in 2010 [1]. Recent studies have demonstrated favorable functional outcomes including urinary continence and erectile function in patients undergoing RARP compared to retropubic radical prostatectomy (RRP) [234]. Furthermore, RARP offers advantages, including reduced blood loss, lower transfusion rates, and faster convalescence [34]. However, debate still exists with respect to the oncologic outcome of RARP. Because only a limited number of institutes have performed RARP for more than 10 years, long-term data regarding oncologic outcome are still lacking. A few centers have reported biochemical recurrence-free survival (BCRFS) rates after RARP, which were comparable to an open series [5678]. A few studies have also reported comparable oncologic outcomes of RARP to those of RRP in high-risk prostate cancer (PCa). However, these results appear to require further validation due to the limitations of earlier studies such as selection bias or very short-term follow-up periods [91011].
In our current study, we compared oncologic outcomes with respect to positive surgical margin (PSM) and 5-year BCRFS rates before and after propensity score matching in high-risk PCa patients who underwent RRP or RARP to demonstrate the efficacy of RARP in high-risk PCa.
MATERIALS AND METHODS
1. Study population
From our Institutional Review Board-approved database, patients with high-risk PCa, who were treated from 2007 to 2013 at Asan Medical Center with radical prostatectomy by either RRP or RARP, were selected for our current analyses. All procedures were performed by a single experienced surgeon (H.A.). Men with metastatic disease at presentation or who received adjuvant or neoadjuvant therapy of any kind were excluded. High-risk PCa was defined as clinical stage≥T3a, biopsy Gleason score (GS) 8-10, or prostate-specific antigen (PSA)>20 ng/mL based on the National Comprehensive Cancer Network (NCCN) risk classification [12].
The choice of surgical method was determined jointly between the patient and the surgeon. Key RP procedures have been described in our previous report [4]. Neurovascular bundle preservation was determined according to the extent of disease, GS, and preoperative erectile function. Principally, RP was attempted in all patients who had organ-confined disease on preoperative magnetic resonance imaging (MRI). Standard pelvic lymph node dissections (external iliac and obturator lymph nodes) were performed on all patients. Supersensitive PSA levels were measured at 3, 6, and 12 months after surgery, then every 6 months up to 3 years, and then annually thereafter. The median overall follow-up interval was 47.9 months (mean, 51.0 months; interquartile range, 33.6-68.6 months). Biochemical recurrence (BCR) was defined as two consecutive postoperative PSA values ≥0.2 ng/mL.
2. Pathological analysis
All pathology slides were reviewed by a single uropathologist. The entire prostatectomy specimen was fixed and cut into 3-mm slices on the axis perpendicular to the major axis for examination. Pathological stage was evaluated according to the 2002 TNM classification [13]. Percent tumor volume was determined by the sum of all visually estimated tumor foci in relation to the prostate on each section, as described in our previous report [14]. PSM was defined as the tumor extending to the inked surface of the specimen, and in areas without a definite identifiable capsule, followed by the definition previously described by Rosen et al. [15].
3. Statistical analyses
Given that RARP began in 2007 at Asan Medical Center and surgical experience of RARP could affect the oncological outcomes, consecutive RARP series were divided into four subgroups (1st, 1-250 cases; 2nd, 251-500 cases; 3rd, 501-750 cases; 4th, 751-1,000 cases). Categorical and continuous variables were compared using the chi-square and Student t-tests, respectively. Kaplan-Meier analyses were used to determine the 5-year BCRFS rates and compared with log-rank tests. Multivariate Cox proportional hazard models were used to determine the predictive factors for BCRFS.
To avoid potential confounding by discrepancies in various parameters between the two surgical modalities, we performed propensity score matching analysis after estimating propensity scores with multiple logistic-regression analysis and adjusting all possible preoperative confounders between the two treatments [16]. Thus, PSM and BCRFS rates were adjusted for preoperative variables including age, prostate size on preoperative MRI, preoperative PSA, clinical stage, biopsy GS, percentage of cores positive on biopsy, and the surgeon's experience. All analyses were performed using PASW Statistics ver. 18.0 (SPSS Inc., Chicago, IL, USA) with p-values <0.05 defined as statistically significant.
RESULTS
1. Baseline characteristics
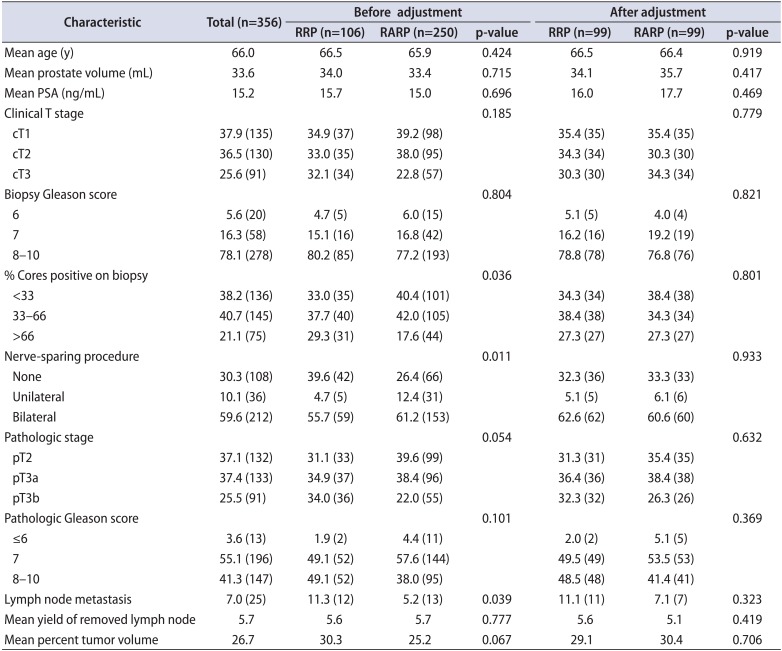
During the study period, 1,388 radical prostatectomies were performed by a single surgeon at Asan Medical Center. Of these cases, 443 patients were classified as high-risk PCa. After the exclusion of patients with metastatic disease at presentation or who received neoadjuvant or adjuvant therapy, 356 patients comprised the final study cohort. Among the cases in this cohort, 106 patients (29.8%) were treated with RRP, whilst the remaining 250 patients (70.2%) were treated with RARP. After propensity score 1:1 matching, 99 patients remained for each surgical modality.
The clinical and pathologic characteristics of the patients are summarized in Table 1. Before adjustment, variables including age, prostate volume, PSA, clinical stage, biopsy GS, pathologic GS, and tumor volume were found to be similar between RRP and RARP. The mean percentage of positive or GS 8-10 cores on biopsy and the number of high-risk factors were greater in the RRP cohort than the RARP cohort. Nerve-sparing procedures were less frequently performed in the RRP cohort. Pathologic stage was more aggressive in the RRP cohort compared to the RARP cohort. However, no differences between the RRP and RARP cohorts were observed in any of the variables after propensity score matching for these variables (Table 1).
2. Unadjusted oncologic outcomes
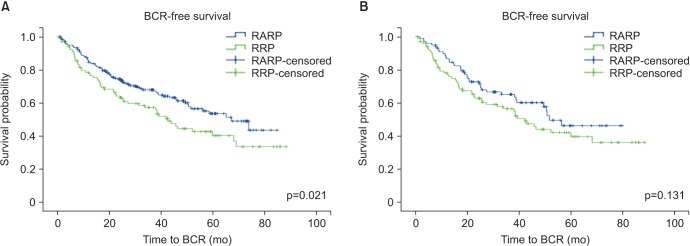
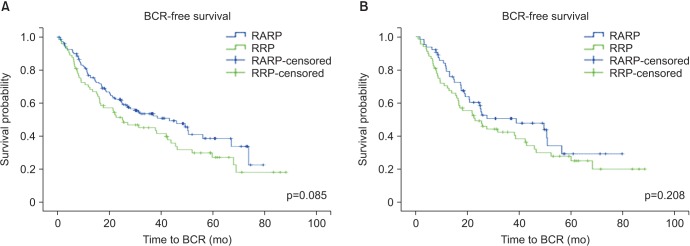
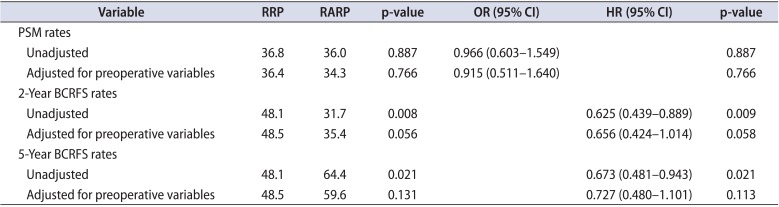
The overall PSM rates were similar between the RRP and RARP cohorts (36.8% vs. 36.0%, p=0.887) (Table 2). The median time to BCR was 16.3 months (interquartile range, 6.9-33.8 months) for RRP and 16.2 months (interquartile range, 8.7-27.9 months) for RARP. Overall 5-year BCRFS rates in the RRP cohort were poorer compared to the RARP cohort (48.1% vs. 64.4%, p=0.021) (Fig. 1, Table 2). Five-year BCRFS rates in RRP and RARP patients with pT2 diseases were similar (84.8% vs. 84.7%, p=0.978). However, those of pT3 patients were better in the RARP cases (31.5% vs. 51.0%, p=0.085) (Fig. 2), especially for pT3a patients (pT3a: 37.8% vs. 61.5%, p=0.015; pT3b: 25.0% vs. 32.7%, p=0.279). Cancer-specific (95.3% vs. 98.0%, p=0.340) and overall survival rates (91.5% vs. 96.8%, p=0.122) at 5 years after surgery were similar between the RRP and RARP groups.
3. Adjusted oncologic outcomes
After adjustment, the overall PSM rates were 36.4% after RRP and 34.3% after RARP (p=0.766) (Table 2). The overall 5-year BCRFS rates were not different between our two study groups (48.5% vs. 59.6%, p=0.131) (Fig. 1, Table 2). Five-year BCRFS rates of pT3 patients were similar between two adjusted cohorts (30.9% vs. 46.9%, p=0.208) (Fig. 2), indicating that the difference in the 5-year BCRFS rates between the two surgical modalities in unadjusted pT3 patients was no longer present after adjustment (pT3a: 36.1% vs. 50.0%, p=0.159; pT3b: 25.0% vs. 42.3%, p=0.987). Cancer-specific (96.0% vs. 96.0%, p=0.852) and overall survival rates (91.9% vs. 92.9%, p=0.954) at 5 years after surgery were also similar between the adjusted RRP and RARP cohorts.
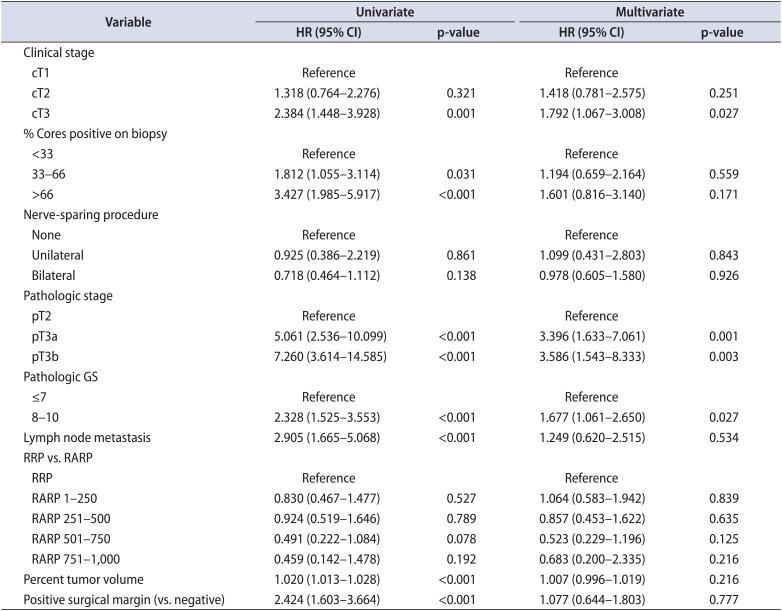
4. Predictive analyses
The surgical modality was not found to be associated with PSM or BCR after adjustment (PSM: odds ratio [OR], 0.966; 95% confidence interval [CI], 0.603-1.549; p=0.887; BCR: hazard ratio [HR], 0.915; 95% CI, 0.511-1.640; p=0.766) (Table 2). The Cox proportional hazards regression model's results indicated that cT, pT stage, and pathologic GS were independent predictive factors for BCR (Table 3).
DISCUSSION
Although several previous studies have reported favorable oncologic outcomes for RRP in the treatment of high-risk PCa, the role of RARP in this setting has not yet been clearly elucidated. Comparative studies with respect to long-term survival rates associated with RRP and RARP in the treatment of high-risk PCa are still lacking. In our present study, we therefore compared 5-year survival outcomes of RARP with those of RRP.
The recently reported PSM rates after RARP in high-risk PCa showed no differences compared to RRP [91117]. One of these earlier studies assessing oncologic outcomes in high-risk PCa, reported nonsignificant differences between the PSM rates after RRP (29.4%) versus after RARP (34.3%) [17]. This finding is consistent with our current results showing that the overall PSM rates did not differ between the RRP and RARP cohorts before or after adjustment. Hu et al. [18] recently reported PSM rates for RRP and RARP for assessing comparative effectiveness of surgical modalities. In that study, the PSM rate for high-risk disease following RARP was lower than that for RRP (RRP vs. RARP: 20.6% vs. 15.1%, p<0.001). However, a large portion of these previous data was excluded, including pT3b, which is an important unfavorable pathologic variable. The PSM rates reported previously are also questionable because the same rates were found for both intermediate and high-risk PCa [19]. We previously reported the oncologic outcomes of RRP vs. RARP stratified by surgical experience [20]. We demonstrated in these analyses that the pT2 PSM rates were not significantly different between the RRP and RARP series throughout the study period, whereas the pT3 PSM rates significantly decreased after 500 RARP cases, showing little impact of the surgical modalities on the pT3 PSM rates with the accumulation of experience with RARP cases [20]. The study of Punnen et al. [11] also supports the effect of surgical experience on improved outcomes in high-risk PCa. The learning curve for RARP in high-risk PCa seems to be more important, because of its impact on oncologic outcomes, and is not brief, even for a surgeon with considerable experience with RRP.
Menon et al. [8] reported the BCRFS of 1,384 patients following RARP with a median 5-year follow-up. In that study, BCRFS rates following RARP, stratified by D'Amico risk group, were 78.2%, 72.0%, and 67.5% in high-risk patients at 3, 5, and 7 years, respectively. These results were in concordance with an open series. One previous comparative study assessing BCRFS in high-risk PCa has demonstrated BCRFS rates for RARP compared with RRP of 84% vs. 79% at 2 years and 68% vs. 66% at 4 years (p=0.52) [11]. Another comparative study reported difference in BCRFS rates for RRP and RARP of 56.3% versus 67.8% at 3 years, although this was not found to be significant [17]. In our current study, unadjusted 5-year BCRFS rates for RARP were significantly better than for RRP, mainly because of the differences in pT3 patients. However, after propensity score matching, our calculated adjusted 5-year BCRFS rates for overall and pT3 following RARP were found to be similar with those of the RRP cohort. These different results indicate an effect of selection bias due to the nonrandomized controlled single institutional comparative design of our present analyses. Using propensity score matching, we controlled the variables that affected the outcomes and minimized their effects. Our adjusted BCRFS rates, along with those reported by other studies, suggest that the BCRFS rates for RARP in high-risk PCa are comparable to those for RRP.
The adjusted BCRFS rates in our study were lower than those of other reports [111718]. A possible explanation for this discrepancy is that we defined high-risk PCa according to the NCCN risk classification, which does not include clinical stage T2c as high-risk PCa. Most other studies have defined high-risk PCa according to the D'Amico criteria. We thus had a relatively higher proportion of pT3 patients than those of other studies. Indeed, one previous comparative study assessing oncologic outcomes in high-risk PCa evaluated a large number of patients with clinical stage T2c PCa [17]. Other possible reasons for the differences between report findings include a potential selection bias and the shorter follow-up periods of other comparative studies. Most of the earlier studies showed differences in demographic or tumor characteristics between the RRP and RARP cohorts. Moreover, prior studies that performed propensity score matching in high-risk PCa were designed with very short follow-up periods (4-10 months) [921]. According to published contemporary comparative studies on high-risk PCa, mean or median follow-up periods of RARP cohorts are typically less than 2 years. In our present study, we demonstrated 5-year BCRFS rates with midterm mean follow-up periods of 45.3 months for RARP and 50.5 months for RRP in high-risk PCa patients.
There is some controversy regarding the appropriate strategy for treatment of low-risk PCa, and questioning of the benefit of RP for these patients [2223]. Although active surveillance leads to good long-term survival outcomes in low-risk PCa patients, avoiding the harms of radical prostatectomy, high-risk PCa patients appear to have an increased risk of disease-specific mortality [2324]. Therefore, these patients could gain a survival benefit from a definite treatment. In recent studies that have assessed the role for RP as a treatment option for high-risk PCa, the importance of RP in these patients has reportedly increased [232526]. Regarding RARP in high-risk PCa, our present results show that this procedure has a comparable 5-year BCRFS to RRP in high-risk PCa patients.
A notable strength of our current study is that we excluded patients who received neoadjuvant and adjuvant therapy because of the possible effect of these treatments on the PSM and BCRFS rates. In addition, all of our subject patients were treated by the same experienced surgeon, and their pathologic results were reviewed under the same protocol by a single uropathologist at the same institution. Third, because clinical stage T3 is a more important variable for representing high-risk disease, we defined high-risk PCa as clinical stage T3 or higher, and we performed propensity score matching to minimize selection bias with midterm follow-up periods in high-risk Pca cases.
Some limitations of our present study should also be noted. Although the follow-up in our series was relatively longer than in other high-risk PCa comparative studies, this interval was still inadequate for the proper evaluation of cancer-specific and overall survival. NCCN guideline provides more detailed risk group classification that divided into high risk and very high risk group since 2014. However, more detailed classification requires larger sample size for adequate statistical analysis. Furthermore, in most guidelines, extended lymphadenectomy is recommended in high risk PCa. However, all patients in the cohort received standard lymphadenectomy. Further studies in the setting of current treatment option should be performed. We previously reported the comparable oncological outcomes of RARP after >500 cases of surgical experience. To avoid the discrepancy in surgical experience, patients of RARP subgroups divided according to the surgical experience were evenly included in adjusted cohort. Although we minimized the selection bias in our current analyses using propensity score matching, not all of our data were fully corrected because of nonrandomization. There was a trend towards better BCRFS rate with RARP compared with RRP after propensity score matching, despite of statistical insignificance. Further larger, long-term follow-up, randomized, prospective studies will be needed.
CONCLUSIONS
Our current matched comparison of the oncologic outcomes of RARP, in terms of PSM and 5-year BCRFS rates in high-risk PCa patients treated by the same surgeon, with those of RRP demonstrate that the two procedures are comparable. Although surgical experience affects the PSM rates, especially in pT3 disease, our current findings indicate that RARP is a feasible treatment option for high-risk PCa.
 XML Download