

 PDF
PDF ePub
ePub Citation
 Print
Print


INTRODUCTION
When extracorporeal shock wave lithotripsy (SWL) was introduced in early 1980, it rapidly became one of the first treatment options in the management of urinary calculi owing to its noninvasive nature and satisfactory treatment outcomes. As our understanding of SWL has increased, many factors have been identified that can predict treatment outcomes and lead to better treatment planning for patients. The increased use of computed tomography (CT) to assess urinary calculi has provided information on some stone parameters, such as mean stone density (MSD) and stone volume (SV), that could be used to predict treatment outcomes after SWL [1,2]. Among the various stone parameters, skin-to-stone distance (SSD) is another factor that might be able to predict the results of treatment, although its role in the prediction of treatment outcomes is still controversial [3,4,5,6,7,8,9,10,11]. Because the shock wave (SW) path passes through various tissues with different compositions and densities, transmission of the SW along these different tissue planes may lead to energy loss and hence affect treatment outcome [12,13].
We postulated that the different tissue compositions along the SW path might affect treatment outcome. That is, variation in tissue composition along the SW path in different patients may result in varying effects of SSD on SWL outcome. Therefore, we investigated the effect of different tissue components along the SW path on the outcome of SWL treatment of renal calculi.
MATERIALS AND METHODS
This was a single-center prospective study that was approved by the Institutional Ethics Review Board and was conducted in accordance with good clinical practice guidelines and the Declaration of Helsinki. The patients involved in this study were from a cohort recruited for a prospective randomized study with the primary aim of assessing different SW delivery rates on the success of treatment during October 2008 to August 2010 [14] (trial registration: ChiCTR-TRC-09000627). The other planned objective of the study was to assess the effect of various pretreatment parameters on treatment, including measurements made in pretreatment CT scans. The key inclusion criteria for the study were consecutive adult patients with solitary radioopaque renal stones of 5 to 20 mm planned for primary SWL managed by a single team of urologists. The patients were required to have no other anatomical abnormalities that could affect stone clearance and to have no indwelling ureteral stent or nephrostomy tubes. A total of 206 patients completed the study. All patients underwent noncontrast CT (NCCT) as part of the baseline assessment of stone characteristics by use of the same multidetector helical CT scanner at 0.5 second per rotation, 5-mm collimation width, 120 kV, and 100 mA. All patients were then treated with an electroconductive lithotripter (Sonolith Vision, EDAP TMS, Vaulx-en-Velin, France). During the original study, patients were randomized to receive treatment at 1 Hz or 2 Hz at a ratio of 1:1. All treatments aimed at delivering 1000 J of energy (manufacturer's recommended maximum energy per treatment session), unless localization of the stone failed or the patient could not tolerate the procedure. Patient-controlled analgesia was used for all patients during treatment. No additional adjuvant medication was given to facilitate stone passage. In the original study, treatment success was defined as either stone-free status or the presence of stone fragments less than 4 mm after one session of SWL as assessed by NCCT at 12 weeks after treatment. Outcome assessment was carried out on an intent-to-treat basis, with information and outcomes on all 206 patients analyzed at the end of study [14].
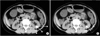
In this part of the study, a single research staff member, under the supervision of a single radiologist and blinded to the clinical information, reviewed all pre-SWL NCCT films at a computer workstation. The following parameters were then measured: maximal stone diameter, defined as the longest length of the stone in a reconstructed view; SV, defined as the sum of the volume of the area of interest measured for each slide image of the stone; and MSD (in Hounsfield units), calculated as the mean of three nonoverlapping regions of interest (area of 0.026 cm2 or 25 pixels) chosen for each stone in the image representing the largest diameter of the stone. The SSD was calculated as the mean distances of three differently angled paths (0°, 45°, and 90°) from the center of the stone to the skin by use of radiographic calipers at an NCCT workstation (Fig. 1A). This measurement is designed to assess the distance that the SW needs to travel to reach the stone. Along the SW path, we divided the tissues into three components: kidney (renal cortex), muscle, and other soft tissues. The measurement of the mean thickness of each component followed the same approach as that for the measurement of SSD. Renal cortical thickness (KT) and muscle thickness (MT) were first measured in the same three differently angled paths, and soft-tissue thickness (ST) was measured by the subtraction of KT and MT from SSD (Fig. 1B). The means of each measurement from the three paths were used as the average KT, MT, and ST for subsequent statistical analyses.
The primary outcome measure was successful treatment, defined as either the absence of stones or the presence of residual fragments <4 mm at 12 weeks after SWL as determined by another set of NCCT images.
The differences between patients with successful and those with failed treatment were analyzed statistically. Demographic data with continuous variables were analyzed by using the Student t-test or analysis of variance for normally distributed data or the Mann-Whitney U test or Kruskal-Wallis test for data that were not normally distributed. Categorical variables were analyzed by chi-square test or Fisher exact test. Pearson coefficient and Spearman rho coefficient analysis was used to examine the correlation between continuous and ordinal variables. Logistic regression was used to calculate the crude odds ratio of all potential independent factors on the outcome. Multivariate logistic regression, with backward stepwise procedures, was used to control for confounders and also to calculate the adjusted odds ratio. Data analysis was performed by using IBM SPSS Statistics ver. 21.0 (IBM Co., Armonk, NY, USA). A two-tailed p-value of <0.05 was considered to be statistically significant.
RESULTS
From October 2008 to August 2010, a total of 206 patients with kidney stones sized 5 to 20 mm and complete data for analysis were involved in this study [14]. The patients' mean age was 53.8 years (range, 25-82 years). The overall treatment success rate after one session of SWL was 43.2% (Table 1). The overall mean body mass index and MSD were 24.8 kg/m2 and 572.8, respectively. The overall mean KT, MT, and ST were 26.9, 16.6, and 40.8 mm, respectively. Except for a weakly negative correlation (r=-0.229, p=0.023) between patient age and KT, age had no other correlations with other CT measurements. There was no significant difference in mean KT, MT, and ST for stones located in the upper, mid, and lower calices (Table 2). Patients in whom treatment was successful had significantly smaller stones, in terms of both diameter and volume, and also a lower MSD. In addition, patients treated with a slower SW delivery rate had a greater likelihood of successful treatment (Table 1).
A list of potential predictors of treatment outcome was selected. These included the age of the patients, the site and side of the stone, SW delivery rate, stone size (SV), MSD, SSD, KT, MT, and ST. Correlations and multicollinearity were assessed, with particular attention to the CT parameters. No significant multicollinearity was observed. Correlations were observed between KT and MSD, as well as between SV and MSD (Spearman rho=0.157, p=0.024; and r=0.471, p<0.001, respectively). Logistic regression was then performed to determine which potential predictors could predict successful treatment. For SSD, KT, MT, and ST, each of the measurements was categorized into three groups according to the 33rd percentile and the 67th percentile for easier clinical interpretation. The 33rd percentiles for SSD, KT, MT, and ST were 77.8, 24.5, 35.2, and 35.2 mm, respectively. The 67th percentile for SSD, KT, MT, and ST were 89.3, 29.3, 18.4, and 45.2 mm, respectively. Because SSD was the sum of KT, MT, and ST, these variables were analyzed separately. Backward stepwise logistic regression was first performed with age, site, and side of the stone; SW delivery rate; SV; MSD; and SSD. The results showed that a slower SW delivery rate (1 Hz), smaller SV, and lower MSD were significant predictors of successful SWL. In the analysis with SSD alone, SSD was not a predictive factor for the success of treatment (Table 3).
However, when we repeated the logistic regression analysis using KT, MT, and ST to replace SSD, a thicker KT was found to be an additional predictive factor for successful SWL (Table 3). These results suggested that patients who had a smaller SV, a lower MSD, and a thicker KT and were treated at a slower SW delivery rate (1 Hz) had a significantly greater likelihood of a successful outcome (Table 3).
DISCUSSION
Our results showed that the CT parameters of SV and MSD can help to predict successful SWL treatment. Furthermore, KT was an additional factor that could predict success. Patients with a thicker KT had better treatment results. In contrast, SSD was not a predictor of successful treatment in a multivariate analysis.
Despite a report from Pareek et al. [3] that SSD is related to successful SWL, its role has remained controversial. While some studies have confirmed that SSD is an important factor in predicting treatment outcomes [2,5,8,10,11], others have not [4,6,7,9]. An in vivo study by Cleveland et al. [12] demonstrated that peak pressure decreases by about 30% when measured inside the body of a pig. Therefore, the efficacy of the SW is related not only to the effect of the distance (SSD) traveled along the SW path, but also to the effect of the composition of different tissues on SW transmission. Several laboratory and clinical studies have been conducted to assess the effect of different tissue components on SW transmission. Hammad and Al Najjar [15] performed a series of in vitro studies to assess the effect of different tissues on the efficacy of SWs. Whereas a greater number of shocks were needed to fragment stones surrounded by various media (fat, muscle, and kidney tissue), no significant difference was found between the number of SWs needed among the different media. Hammad and Al Najjar [15] therefore concluded that there was no significant difference in SW transmission across fat and nonfat components. This finding was further verified in a clinical study that assessed the effect of the thickness of different tissue components along the SW path on treatment outcome [16]. In that study, the thickness of fat components was compared with the thickness of the nonfat components (including KT and MT) to determine their role in predicting the success of SWL. The results suggested that the efficacy of treatment was not affected by fat or nonfat components along the SW path.
However, our study differed from Hammad's clinical study [16] because we divided the tissues along the SW path into three components rather than combining KT and MT. Our results also had two major differences in relation to the other studies. First, KT was shown to affect the treatment outcome, whereas the other tissue components (fat and muscle) did not. Second, a thinner KT resulted in a poorer treatment outcome. This observation differed particularly from those of other studies, most of which showed that a greater tissue thickness/SSD resulted in a poorer treatment result [12,13]. We postulated that these two findings were due to an effect of renal cortical scarring on SW transmission. Aging and other medical conditions could result in renal scarring and hence a decrease in renal cortical volume (i.e., KT) [17,18,19]. Sclerotic kidneys could lead to an increase in acoustic impedance of the kidney tissue, which would affect wave transmissions in that organ. The increase in echogenicity and the decrease in size, and hence in KT, of aging kidneys in an ultrasound study is an example of these changes. Therefore, a thinner renal cortex, which implies a greater likelihood of renal scarring, would attenuate SW intensity and lead to a poorer outcome. In the clinical study by Hammad and Balakrishnan [16], KT and MT were combined for the analysis, and the effect of KT on the efficacy of SWL might therefore not be demonstrated. For the other in vivo and in vitro studies, the degree of renal cortical scarring in relatively young pigs compared with that in our study patients, who had a mean age of 50 years, might have hampered the demonstration of an effect of the renal cortex on SW transmission [12,13,15]. This difference in the composition of tissues may explain the inconsistent effects of SSD reported in different studies.
In our results, we also observed a negative correlation between patient age and KT. This observation echoed our previous discussion that aging would lead to cortical thinning, i.e., an increase in renal scarring. This might also help to explain the observations from previous studies in which older patients had a poorer SWL outcome, because older people are more liable to have a thinner cortex and greater renal scarring [20,21]. Because KT is relatively easy to measure by use of several imaging techniques, including ultrasound, NCCT, and even magnetic resonance imaging, it could be a simple tool with which to assess the suitability of patients for SWL. However, further studies to verify our findings may be beneficial.
The overall treatment success rate in this study was 43.2%, which might appear to be low compared with other reports [4,22]. However, we would like to clarify that we assessed our treatment outcome after one treatment session, which differed from other reports that included more than one treatment session [4,22]. If we focused on reports assessing the stone-free rate after one treatment session, the current result are comparable to those in the literature [2,23].
In our results, we observed that a thicker renal cortex was associated with better treatment outcome. While we postulated that this might be related to renal scarring, this hypothesis could not be proven in the current study because we did not have pretreatment measurements of renal scarring in our subjects. Other reports have suggested that ultrasound elastography and magnetic resonance imaging might help in the quantitative measurement of renal fibrosis [24,25]. Further studies of the effect of renal fibrosis on SWL outcome with the use of these newer imaging modalities would be helpful to confirm our initial findings.
There were some limitations to this study. First, it may have been better for the imaging measurements to have been performed by more than one blinded staff member, and this might have helped to minimize error in the measurement. However, owing to limitations in manpower, we only had one staff member available to perform all the measurements. Because the staff member was blinded from the clinical information, we hoped that this would help to minimize potential bias in measurement. Moreover, because many medical conditions can affect both KT and treatment outcome, it would be ideal if we could include an analysis of the effect of these parameters on KT and treatment outcome. Unfortunately, we did not prospectively collect information on all background medical conditions, and their severity, in each patient. Therefore, we could not assess the effects of preexisting medical conditions on KT or on treatment outcome. Future studies to assess the effect of medical conditions on KT and treatment outcome might be helpful to better understand the interrelationship of these parameters.
CONCLUSIONS
Among the main tissue components along the SW path, a thicker KT was shown to be a favorable factor for successful SWL. Further studies might be needed to verify the role of this new NCCT parameter in predicting the success of SWL, which would be helpful for making clinical decisions and counseling patients.


 XML Download