

 PDF
PDF ePub
ePub Citation
 Print
Print


INTRODUCTION
Prostate cancer (PCa) is the most frequently diagnosed malignancy and the second leading cause of cancer-specific deaths in men in most industrialized Western countries. Recently, the incidence of this disease has significantly increased in Asian countries, including Korea, owing to the reported widespread use of prostate-specific antigen (PSA) testing and downward stage migration [1,2]. Nevertheless, recent reports have shown that up to 15% of contemporary patients still harbor lymph node invasion (LNI) at extended pelvic lymph node dissection (PLND) in PCa [3,4]. Many studies have reported preoperative nomograms for predicting LNI after radical prostatectomy (RP) and PLND, and these predictive models were reconstructed by using an extended PLND procedure [5,6,7,8,9]. Although recent studies have demonstrated a significantly higher rate of LNI in patients undergoing extended PLND relative to patients undergoing only limited PLND, it is a common policy to spare PLND or to perform limited PLND in patients with a low risk of LNI because of the widely applied early detection of PCa and screening programs and the resulting stage migration [9,10,11,12]. Therefore, it became necessary to find a preoperative tool for predicting LNI before surgery. There are currently some nomograms for predicting LNI with higher accuracy [11,13].
Recently, genome-wide association studies have identified several genetic variants that are associated with risks for PCa and have provided additional predictive gain to prostate-related prognosis [14,15]. These genetic data have been applied to actual clinical situations and have been validated as genetic biomarkers in PCa. Thus, in the present study, by using 242,186 single-nucleotide polymorphisms (SNPs) in an exome array from 341 Korean patients with PCa who underwent RP and PLND, we investigated significant genetic variants for LNI and showed how additional predictive gain was achieved by reconstructing a clinicogenetic model.
MATERIALS AND METHODS
1. Study population
After we obtained Institutional Review Board approval (IRB number, B-1312/232-302), we enrolled 1,002 patients with PCa from November 2003 to July 2013. Blood specimens were prospectively collected from all of the patients, and genomic DNA was extracted by use of PureLink Genomic DNA maxi kits (Invitrogen, Carlsbad, CA, USA). Genomic DNA was diluted to 1 µg/mL and stored at -20℃. We included patients who underwent RP and PLND, and most of the patients had undergone a limited extent of PLND. We excluded patients who had undergone neoadjuvant hormone or radiation therapy, prostate biopsies at another institution, or prostate biopsies with <12 cores taken. We also excluded patients who had a postoperative follow-up of less than 1 year. Accordingly, 341 patients were enrolled with complete records of clinical data including data on LNI and biochemical recurrence (BCR). All 341 patients were stratified into two groups on the basis of LNI. Transrectal ultrasound-guided multicore (≥12) biopsies were obtained from all male patients by use of a biopsy gun with an automatic firing mechanism. All RP specimens were processed according to the Stanford protocol [16]. All biopsy and RP specimens were analyzed by a single genitourinary pathologist. BCR was defined as two consecutive PSA increases of 0.2 ng/mL or higher within at least 2 months after RP [17].
2. Genotyping and quality control
Study samples were processed on the HumanExome BeadChip 12v1-1 system (Illumina Inc., San Diego, CA, USA), which included 242,901 markers focused on protein-altering variants. Details concerning SNP content and selection strategies can be found at the exome array design webpage (http://genome.sph.umich.edu/wiki/Exome_ Chip_Design). Genotype calling was performed by using Illumina's GenTrain ver. 2.0 clustering algorithm with the GenomeStudio software (V2011.1). Cluster boundaries were determined by using Illumina's standard cluster file. After additional visual inspection of SNPs with call rates of <0.99 and SNPs with minor allele frequencies of <0.002, 242,186 of 242,901 attempted markers (99.71%) were successfully genotyped with call rates >95% (average call rate, 99.98%). In total, 1,001 of 1,002 individuals (99.9%) were successfully genotyped (call rate >98%). For the 242,186 SNPs that passed quality control, genotype concordance among the 104 blind duplicate sample pairs was 99.998%. One individual per pair of six known twin pairs and six unknown duplicates were excluded. We performed principal components analysis twice, once excluding HapMap samples to identify population outliers and a second time including HapMap samples to interpret outliers. To avoid artifacts due to family relatedness, we computed the principal components by using SNP loadings estimated from a subset of 7,304 notclose relatives. We defined close relatives as an estimated genome-wide identical-by-descent proportion of alleles shared of >0.10. We estimated identical-by-descent sharing by using PLINK's "-genome" option38 and performed principal components analysis by using SMARTPCA37 on a linkage-disequilibrium-pruned set of 22,464 autosomal SNPs. These were obtained by removing large-scale, high-linkage disequilibrium (LD) regions, SNPs with a minimum allele frequency <0.01, or SNPs with a Hardy-Weinberg equilibrium p-value<10-6 and by performing LD pruning by using the PLINK option "--indep-pairwise 50 5 0.2." After inspecting the first 10 principal components, we identified 12 population outliers, 9 of which had self-reported non-Finnish ancestry. Thus, we excluded these 12 individuals from subsequent analyses.
3. SNP analysis of the exome array
SNP genotype frequencies were examined for Hardy-Weinberg equilibrium by using the chi-square statistic and all were found to be consistent (p>0.05). The data were analyzed by using an unconditional logistic regression to calculate an odds ratio (OR) as an estimate of the relative risk of LNI associated with SNP genotypes. To determine the association between the genotype and haplotype distributions, a logistic analysis was performed with control for age (continuous value) as a covariate to eliminate or reduce any confounding factors that could influence the findings. Lewontin's D' (|D'|) and the LD coefficient r2 were examined to measure LD between all pairs of biallelic loci [18]. The haplotypes were inferred from the successfully genotyped SNPs by using the PHASE algorithm ver. 2.0 [19], and SAS 9.1 (SAS Institute Inc., Cary, NC, USA). The effective number of independent marker loci was calculated by using SNPSpD software (http://www.genepi.qimr.edu.au/general/daleN/SNPSpD/) [20].
4. Statistical analyses
A total of 341 patients were stratified into two groups on the basis of LNI. Comparing patients with and without LNI, we assessed the differences among the clinicopathological profiles of patients by using the chi-square test, Fisher exact test, and the Mann-Whitney test. The multivariate analyses on models adjusted for age, initial PSA, biopsy Gleason scores, clinical stage, percentage of positive core, and maximal tumor length in a core were performed to identify an independent predictor of LNI. The predictive accuracy for this multivariate model was assessed by the receiver operating characteristics-derived area under the curve (AUC) analysis. Another multivariate model was created by using the additional genetic information derived from the exome array, and predictive accuracy was assessed by using the same method. The two AUCs were subsequently compared by using the Mantel-Haenszel test. The Cox proportional hazard model for predicting BCR analyses was conducted by adjusting the clinicopathologic parameters, such as pathologic Gleason scores, extracapsular extension, seminal vesicle invasion, positive surgical margin, and LNI, with or without genetic factors from the exome array. BCR-free survival was measured from the day of surgery to the date of the last follow-up period or until the date of BCR. The predictive accuracy for predicting BCR from each model was compared by use of similar methods. The SPSS ver. 15.0 (SPSS Inc., Chicago, IL, USA) and Medicalc software ver. 11 (Mariakerke, Belgium) were used to perform the statistical analyses. A two-tailed p<0.05 was considered to be statistically significant for all of the analyses.
RESULTS
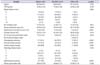
Among 341 patients with PCa, 24 patients (7.04%) had LNI after RP and PLND (Table 1). Patients with LNI displayed significantly higher biopsy Gleason scores, percentage of positive core, and maximal tumor length in a core before RP. The rates of extracapsular extension, seminal vesicle invasion, positive surgical margin and BCR were higher in the LNI group after RP. The extracted mean total number of LNIs was 8.15±4.50. There was no significant difference in the rate of LNI according to surgical method: open RP, 5.3% (7/131); robotic RP, 8.1% (17/210).
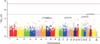
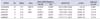
Genotype frequencies in patients with and without LNI were analyzed by using a logistic regression model (Fig. 1). The results of genotyping 242,186 SNPs by use of exome arrays showed that five SNPs (rs75444444, rs8055236, rs2301277, rs9300039, and rs6908581) were significantly associated with LNI in men who underwent RP (Table 2). These significant SNPs were all positively correlated with LNI; ORs and significance levels are shown in Table 2; however, the aforementioned SNPs were not significant after multiple testing with false-discovery rate.
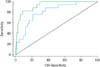
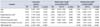
The initial serum PSA levels, biopsy Gleason scores, clinical stage, percentage of positive cores, and maximal tumor length in a core were significant factors for LNI in the univariate analysis. The multivariate models incorporated these variables and age, including and excluding the SNP variants, as shown in Table 3. The biopsy Gleason scores and maximal tumor length in a core were significant factors for predicting LNI in a multivariate logistic model; the predictive accuracy for this model was 80.7% (95% confidence interval [CI], 0.762-0.847). By adding the genetic variant factors, the clinicogenetic multivariate model showed that predictive accuracy was 93.2% (95% CI, 0.900-0.956). Thus, the accuracy was increased within a significant level (difference between area, 0.124; 95% CI, 0.0357-0.213; p=0.006) (Fig. 2).
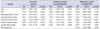
The Cox proportional hazard models for predicting BCR are shown in Table 4. The clinicopathological multivariate models showed that pathologic Gleason scores, seminal vesicle invasion, positive surgical margin, and LNI were significant factors for predicting BCR. Selected SNP-related LNI was also a significant factor for BCR in the multivariate Cox proportional models (hazard ratio, 2.244; 95% CI, 1.030-4.888; p=0.042). The AUC increased from 71.8% in the model without genetic factors to 72.3% in the model with genetic factors (p=0.346).
DISCUSSION
In the present study, we investigated potential genetic biomarkers for predicting LNI among patients with PCa who underwent RP and PLND. The logistic regression analysis results suggested that five SNPs were significantly associated with the risk for LNI. Moreover, we applied the information derived from the genetic studies to an actual clinical model based on previously established clinical factors and found an additional predictive gain for predicting LNI.
Most of the recent nomograms used to predict LNI have comparable predictive accuracy. The first nomogram introduced by Briganti et al. [11] showed 76% accuracy by adjusting for PSA, clinical stage, and biopsy Gleason scores. In another nomogram that included percentage of positive cores as a covariate, predictive accuracy increased to 81.5% for LNI [13]. Afterwards, many studies that contained external and internal validation results of these nomograms showed a higher accuracy level [6,8,9]. Recent updated nomograms predicting LNI showed 87.6% accuracy in 588 patients with clinically localized PCa who underwent RP and extended PLND [7]. Hansen et al. [8] showed externally validated updated nomograms among 1,282 PCa men and showed 82.9% accuracy. In our setting, including biopsy parameters, the multivariate model for predicting LNI was 80.7%; however, with the addition of the genetic parameters to the multivariate model, accuracy was significantly increased to 93.2%.
Although recently published nomograms related to PCa prognosis need to be improved by including new variables, models based on plasma or tissue quantitative biomarkers have recently been proposed [21,22]. However, although associations between SNPs and PCa have been reported, whether including any of these SNPs or a combination might improve the classic nomograms has not been explored [23]. Huang et al. [15] showed that among 320 patients with PCa after RP, 3 of 20 SNPs were significantly associated with BCR (p<0.02) after adjustment for clinicopathological factors such as age, preoperative PSA, pathologic stage, and surgical margin. Likewise, we performed a broader investigation by analyzing 242,186 SNPs among men who underwent RP by use of a custom HumanExome BeadChip and applied our genetic information from the exome array to the clinical model. As a result, we developed a more accurate model for predicting LNI. Because the action of SNPs is generally understood to be a function of multiple variant combinations and not a single action, it was important to find many potential genetic variant outcomes.
The relationship between the five SNPs selected from our series and PCa has not yet been investigated. rs75444444, which is located in chromosome 19 (MUC16), is known as the largest glycoprotein of the mucin family. It is normally expressed in the epithelial lining of various tissues and is elevated in some organ malignancies [24]. The high rs8055236 (IER3) expression revealed in the prostate and bladder was described as being regulated by p53 and involved in the proapoptotic action by the tumor suppressor [25]. rs2301277 (PBX2) works as a transcriptional activator for valosin-containing protein expression in breast cancer and is known to be an important factor for cell survival [26]. However, an accurate mechanism of action of these SNPs in PCa has not been published; it is necessary to confirm the genetic variants and lymph node metastasis in PCa through molecular work. Actually, our selected SNP, which is related to LNI, had significance to PCa-related BCR in the multivariate analysis; these markers or the combination of these markers had a likelihood of being a potential biomarker for PCa.
The present study had several limitations, such as the extent of PLND. Although the ideal candidate for PLND still needs to be defined, general agreement has been reached that if PLND is contemplated, it should be extended to reach an adequate nodal staging accuracy [27,28]. Consequently, if an LNI prediction model is developed, it must be based on an extended PLND series. Conversely, applying predictive tools developed on patients treated with limited PLND might significantly underestimate the true risk of LNI [4]. However, LNI was detected even in low-risk patients with PCa in whom PLND is not indicated in the current era; therefore, we need the available nomogram in this real clinical setting. Our predictive model had a higher accuracy rate above 90% and consisted of preoperative parameters with genetic information obtained from serum. Therefore, by adding a recently published nomogram obtained from an extended PLND setting, the external validation of our selected biomarker exhibited an excellent model for predicting LNI. Owing to the limited extent of PLND, the small number of positive lymph nodes was a limitation.
The sample size was another limitation; however, all men included in this study were of a homogeneous racial population. PCa diagnosed in Asian, American, and European men may have innate differences associated with racial and environmental factors. Because PCa is a hormone-dependent disease, various investigators have suggested that racial variations in the serum levels of testosterone and derivatives may contribute to differences in PCa risks and prognoses among different races [29]. Differences in the hormonal milieu and a lack of PSA screening have been speculated to play a role in the generally more aggressive profile of PCa diagnosed in contemporary Korean men compared with their Western counterparts [30]. The effects of racial differences may originate from genetic differences. Therefore, our data from an Asian population may differ from the data for a Western population. Another limitation was that our data should be validated in other independent cohorts for persistent significance. Despite these limitations, a potential predictive marker should be judged on the basis of its capacity to improve the preexisting optimized predictive model rather than simply on the basis of its status as an independent variable.
CONCLUSIONS
We showed that five SNPs were significant predictors of LNI. Furthermore, the addition of genetic information from exome arrays effectively enhanced the predictive accuracy of our multivariate model, which incorporated various clinical factors. These results need to be validated in future studies but may lead to the development of an accurate model that predicts LNI in the preoperative setting.
 XML Download