

 PDF
PDF ePub
ePub Citation
 Print
Print


INTRODUCTION
Shock wave lithotripsy (SWL) was invented in the early 1980s and since then has become a standard treatment for renal and ureteral calculi owing to its noninvasiveness. SWL is particularly recommended for the treatment of renal and ureteral stones smaller than 10 mm [1,2]. SWL has been less successful in treating larger urinary calculi (>20 mm) and staghorn calculi and thus is recommended for smaller, uncomplicated calculi. In our clinical practice, we develop individualized treatment plans after assessing stone size and location. Conventionally, excretory urography provides important information for treatment decision-making. However, the valuable information obtained from noncontrast computed tomography (NCCT), including stone location, size, number, and obstructive grade, has an important role in treatment planning. Some reports have suggested that stone attenuation value on NCCT is an independent predictor of clinical outcome after SWL [3-7]. In the present study, we attempted to identify the radiographic parameters on NCCT that best predicted SWL success.
MATERIALS AND METHODS
From August 2005 to March 2009, we used the Dornier Compact S (Dornier Med Tech, Weβling, Germany) device to perform SWL in 236 patients. A total of 105 patients also underwent preoperative evaluation by use of multidetector CT. Patients were excluded if maximum stone length was greater than 20 mm, if follow-up for the presence of unsatisfactory residual fragments was inadequate, or if the patient underwent an additional SWL session within 2 weeks (because this was considered too short an interval to assess the effect of a single treatment).
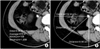
We retrospectively reviewed the records of 75 patients who met the inclusion criteria and underwent SWL with a Dornier Compact S lithotripter for urinary calculi measuring 5 to 20 mm. Patients were treated with 3,000 shock waves at a maximum energy level of 6 (for renal calculi) or 7 (for ureteral calculi). The procedure was terminated when targeted calculi were fragmented, as determined by fluoroscopy. Maximum stone length was measured by using plain abdominal film (kidney, ureter, bladder; KUB) or intravenous pyelography (IVP). All scans were performed preoperatively by using a Somatom Plus 4 scanner (Siemens, Munich, Germany) with 4 detector rows (2.5-mm collimation width, 5 helical pitch, 120 kV, and 150 effective mAs). Using reconstructed 6-mm NCCT images archived to a POP-Net Server (ImageONE Co., Tokyo, Japan), a single urologist (M.T.) traced the contour of the inner edge of the stone (not including the surrounding soft tissue) on the slice with the maximum stone cross-sectional area (Fig. 1A). This illustration was then used to automatically calculate stone area and average, maximum, and minimum stone attenuation values on the POP-Net server. Using the NCCT images, we defined stone-to-skin distance (SSD) as the average of measurements taken at 0°, 45°, and 90° (Fig. 1B). KUB was done on postoperative day 1. In general, patients reported for follow-up evaluation by KUB after 2 to 4 weeks. Subsequent follow-up was irregular. Patients underwent an additional session if substantial fragments remained. On follow-up imaging using KUB or NCCT, clinical outcome was classified as successful (patients who were stone-free or had fragments <4 mm in diameter) or failed (stone fragments measuring ≥4 mm). Outcomes were decided when patients were judged 1) to be stone-free or to have fragments less than 4 mm in diameter or 2) to be SWL-resistant (e.g., an alternative treatment was selected for an unchanged stone or additional treatment was abandoned).
The same urologist (M.T.) assessed all preoperative and postoperative images. All statistical analysis was performed with JMP ver. 4.05J (SAS Institute, Cary, NC, USA). In all analyses, p-values less than 0.05 were considered to indicate statistical significance. We used the chi-square test and unpaired t-test to compare the preoperative parameters of successfully and unsuccessfully treated patients. The impact of preoperative parameters, i.e., stone length, location, average stone attenuation value, stone cross-sectional area, and SSD, were evaluated by univariate and multivariate analysis. In addition, these parameters were evaluated by using optimal cutoffs determined by receiver operating characteristic (ROC) curve analysis and were reevaluated by univariate and multivariate analysis.
RESULTS
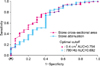
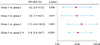
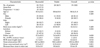
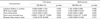
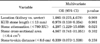
Of the 75 patients (46 men and 29 women), 27 (36.0%) had a renal stone (calyx or renal pelvis) and 48 (64.0%) had a ureteral stone. Seven patients (9.3%) had multiple stones. The mean number of extracorporeal SWL sessions was 1.1±0.4, and clinical outcomes were assessed after an average follow-up of 61.8±34.6 days. Forty-three patients (57.3%) were stone-free. The overall success rate, i.e., stone-free or fragments less than 4 mm, was 73.3%. The mean duration of follow-up was 57.2±33.5 days for successfully treated patients and 74.3±35.5 days for unsuccessfully treated patients (p=0.059); the mean number of SWL sessions was 1.1±0.3 and 1.3±0.6 (p=0.035), respectively. Preoperative parameters were compared between the success and failure groups (Table 1). The respective average stone attenuation value, stone length, and stone cross-sectional area were 627.4±166.5 vs. 788.1±233.9 HU (Hounsfield unit) (p=0.002), 11.7±3.8 vs. 14.2±3.6 cm (p=0.015), and 0.31±0.17 vs. 0.57±0.41 cm2 (p<0.001), respectively. Table 2 shows the results of the univariate and multivariate analyses of radiographic parameters. The results of the univariate analysis showed that average stone attenuation value, stone length, and stone cross-sectional area were associated with SWL success (p=0.004, p=0.019, and p=0.003, respectively), whereas stone location (i.e., kidney or ureter) was not associated with SWL success. However, stone attenuation value was the only independent predictor of SWL success in the multivariate analysis (p=0.023), although stone cross-sectional area had a tendency to be associated with SWL success (p=0.053). The ROC analysis revealed the optimal cutoff values for stone length, stone attenuation value, stone cross-sectional area, and SSD in relation to SWL outcome. All variables were categorized by optimal cutoff values. Among these variables, average stone attenuation value, stone length, and stone cross-sectional area were significant predictors of SWL outcome in the univariate analysis, and stone attenuation value was the only independent predictor in the multivariate analysis, as in the above-mentioned analysis (Table 3). Fig. 2 shows the ROC curves for stone attenuation value and stone cross-sectional area. On the basis of those values, patients were then classified into group 1 (attenuation ≤780 HU and cross-sectional area ≤0.4 cm2), group 2 (≤780 HU and >0.4 cm2), group 3 (>780 HU and ≤0.4 cm2), and group 4 (>780 HU and >0.4 cm2). Compared with the other groups combined, the odds ratio (OR) in group 1 for a successful result on SWL was 11.6 (95% confidence interval [CI], 3.9 to 54.7; p<0.001).
DISCUSSION
The results of this study showed that stone attenuation value and stone cross-sectional area are good predictors of extracorporeal SWL outcome. In the multivariate analysis, stone attenuation value was the only independent predictor of SWL success (as a continuous and as a categorical variable; p=0.023, together), and stone cross-sectional area, as a continuous variable, had a tendency to be associated with SWL success (p=0.053). Patients with a stone attenuation value of 780 HU or less and a stone cross-sectional area of 0.4 cm2 or less were 11.6 times as likely to have a successful result on SWL as were the other groups combined (95% CI, 3.9 to 54.7; p<0.001). The combination of stone attenuation value and stone cross-sectional area provided information that was useful in determining the SWL treatment for patients with urinary calculi.
Bon et al. [8] examined the associations of the preoperative radiographic appearance of calculi (i.e., homogeneity, density, and morphologic features) with SWL outcome and concluded that density and morphologic features were predictors of SWL success. However, their method of evaluating stone properties used relative measurements. NCCT is clearly superior to conventional plain abdominal radiography and IVP both in its capacity to aid in diagnosis of urolithiasis and in cost-effectiveness [9,10]. Several studies have identified stone attenuation as a predictor of SWL success [3-7]. As mentioned above, lower stone attenuation values are predictive of SWL success (Fig. 3), and our results support that finding. Perks et al. [7] found that the stone-free rate for stones of 1,000 HU or greater was only 17%. Kacker et al. [11] noted that to achieve a 60% stone-free rate, the density cutoff value for solitary 6- to 10-mm stones was 1,000 HU for stones in the proximal ureter and 640 HU for those in the renal pelvis. As compared with the stone radiographic pattern on KUB, stone density on NCCT is a much clearer criterion for stone assessment. Patient data and images can be easily stored and retrieved from a workstation system in almost all clinics, and stone attenuation values can be calculated in minutes.
Pareek et al. [6] found that an SSD greater than 10 cm on NCCT was a predictor of SWL failure (OR, 0.32; 95% CI, 0.29 to 0.35; p<0.01). Similarly, Perks et al. [12] noted that the combination of an SSD less than 9.0 cm and a stone attenuation value less than 900 HU was a good predictor of SWL success as compared with other groups (OR, 7.1; 95% CI, 1.6 to 32; p<0.01). However, in the present study, SSD did not differ significantly between the success and failure groups. This discordance with regard to SSD may be due to differences between the physical characteristics of the present patients and those of Western subjects.
Dretler and Polykoff [13] demonstrated the possibility of determining stone composition by radiographic appearance, and prediction of stone composition by NCCT has been reported in several studies. According to these reports, the density of uric acid stones is lower than that of calcium oxalate stones [14,15]. However, calcium oxalate monohydrate and cystine, which are resistant to SWL, could not be identified preoperatively. In the present study, stone composition analysis was performed in 51 patients: 50 had either calcium oxalate stones only or combined calcium oxalate/calcium phosphate stones and 1 had a cystine stone. Therefore, we were unable to assess the relation between stone composition and stone attenuation value.
Several clinical studies have shown that SWL failure is associated with greater stone attenuation value. Our results agree with these findings. Stone attenuation values in previous studies ranged from 578 to 837 among successfully treated patients and from 910 to 1,225 among unsuccessfully treated patients [3,4,12]. We believe that the wide range of previously reported stone attenuation values is likely due to differences in CT collimation width, the method used to measure stone attenuation, and the lithotripter used. Stone attenuation values appear to be influenced by CT collimation, which affects the volume averaging of the surrounding soft tissue. Saw et al. [16] found that attenuation values were consistently lower at larger collimation widths. Several technique of measuring stone attenuation value have been used in previous reports. Perks et al. [12] investigated 2 methods elliptical region of interest (incorporating the largest cross-sectional area, excluding adjacent soft tissue) and mean attenuation calculated from three small, nonoverlapping regions of interest in each stone and found that these methods were significantly correlated (r2=0.98, p<0.001). We modified the former method to calculate maximum stone cross-sectional area and contour the inner edge of the stone without including the surrounding soft tissue. Although we reconstructed 6-mm NCCT images, measurement of the attenuation value for stones smaller than 6 mm might be affected by volume averaging. In the present study, stone attenuation values for stones smaller than 6 mm were significantly lower than those for stones larger than 6 mm (519.022±110.566 vs. 690.882±199.372 HU, p=0.014). We measured stone cross-sectional area by contouring the inner edge of the stone and took great care to exclude the surrounding soft tissue. However, this method, too, might have resulted in volume averaging, especially in smaller stones.
Although several methods of determining stone surface area have been reported (graph paper, planimeter, computerized image analysis, and calculation as an ellipse), all of these measurements were collected by using KUB. Tiselius [17] calculated stone surface area from the longitudinal and transverse diameters as an ellipse with the formula length×width×π×0.25 and found a positive correlation between the number of SWL sessions and stone surface area. Lam et al. [18] investigated 3 techniques use of graph paper, planimeter, and computerized image analysis and concluded that computerized image analysis was the most accurate, fastest, and easiest to perform. We assessed the effect of stone cross-sectional area calculated by contouring the inner edge of the stone on CT, not KUB. In the multivariate analysis, stone cross-sectional area had a tendency to be associated with SWL success (p=0.053). In addition, Yoshida et al. [19] showed that stone volume was a good predictor of stone fragility. Lam et al. [18] reported an excellent correlation between stone volume and stone surface area (r2=0.84, p=0.005). Stone length is one-dimensional, stone cross-sectional area is two-dimensional, and stone volume is three-dimensional. Thus, these three predictors are likely correlated.
Ng et al. [20] maintained that treatment planning is aided by a scoring system that uses stone volume, stone attenuation, and SSD to determine SWL outcome for upper ureteral stones. In the present study, we showed that classification by stone attenuation and cross-sectional area is a good predictor of SWL success.
The potential limitations of this study include the possible underestimation of stone attenuation values in stones smaller than 6 mm and the indefinite follow-up schedule. In addition, stone location (e.g., upper, middle, or lower pole of kidney or ureter) was not assessed. Nevertheless, our findings confirm that classification by stone attenuation value and cross-sectional area is a practical method for determining the potential effectiveness of SWL. Data on stone attenuation value and cross-sectional area are easily stored and retrieved in imaging workstation systems. Furthermore, such a system aids in individualized treatment planning.
CONCLUSIONS
NCCT not only assists in diagnosing urolithiasis, it is also a predictor of SWL success. Although stone attenuation and cross-sectional area, as determined by multidetector noncontrast CT, are good individual predictors of extracorporeal SWL outcome, combined classification by stone attenuation and cross-sectional area is a strong predictor of extracorporeal SWL outcome. In addition, because of the unique properties of SWL devices, optimal stone attenuation cutoff values should be determined for each device type.
 XML Download