

 PDF
PDF ePub
ePub Citation
 Print
Print


INTRODUCTION
Chronic kidney diseases, which lead to end-stage kidney failure, are associated with changes in kidney structure and fibrosis regardless of the underlying cause [1]. Urinary tract obstruction is characterized by tubular atrophy or dilation, tubular cell death by apoptosis and necrosis, interstitial leukocyte infiltration, and increased interstitial matrix deposition. [1]. Such an obstruction might be observed after benign prostatic hyperplasia; renal, ureteral, or bladder calculi; urethral stricture; and neoplasm of the bladder, prostate, or urethra [1]. The hydrostatic pressure, which is the result of the blockage, initiates renal injuries. The injuries are characterized by tubular dilatation or atrophy, inflammatory infiltration of leucocytes, fibroblast activation, proliferation, increase in matrix proteins, and progressive interstitial fibrosis with the loss of renal parenchyma. Unilateral ureteral obstruction (UUO) is an experimental rat model of renal injury that imitates the process of obstructive nephropathy in an accelerated manner [1]. Evidence supports a key role of the inflammatory process in the renal structural changes that occur after uropathy [2].
Taurine (2-aminoethanesulfonic acid) is an organic acid and a major component of the bile. Taurine is a derivative of the sulfur-containing amino acid cysteine. Taurine has been shown to have beneficial effects on the renal fibrosis that occurs after cisplatin-induced injuries, diabetic nephropathy, and age-related renal changes [1,3,4]. Taurine has also been associated with a reduction in oxidant levels in diabetic nephropathy [4]. It also plays an important role in some biochemical and physiological processes in the kidney. In a review, Chesney et al. [2] described the renal-taurine interactions related to ion reabsorption, renal blood flow, renal vascular endothelial function, and antioxidant properties (especially in the glomerulus) [5]. In addition, it has been reported that taurine plays a major role in the renal cell cycle as well as in apoptosis and also functions as an osmolyte during the stress response. Taurine has been shown to play an important role in four different forms of kidney diseases: glomerulonephritis [6], diabetic nephropathy, chronic renal failure [7], and acute kidney injury [8].
Taxol (paclitaxel) is a mitotic inhibitor that is used in cancer chemotherapy. Paclitaxel stabilizes microtubules and as a result interferes with the normal breakdown of the microtubules during cell division. Sun et al. [9] and Zhang et al. [10] have reported that paclitaxel ameliorates fibrosis in the UUO rat kidney model. In addition, Sommardahl et al. [11] showed the efficacy of Taxol in the mouse model of polycystic kidney disease. In addition, Zhou et al. [12] reported the ameliorative effects of paclitaxel on liver fibrosis.
In this study, we tried to determine whether taurine and Taxol can attenuate the tubulointerstitial fibrosis and preserve the normal renal histology in a rat model of UUO. Moreover, stereological survey was applied to investigate structural changes in the uropathic kidney, including the volume of the cortex, medulla, glomeruli, proximal convoluted tubules (PCT), distal convoluted tubules (DCT), Henle tubules, collecting ducts, vessels, and fibrous tissue. In addition, the length of the tubules and the vessels was estimated. These methods provide both quantitative and comparative data.
MATERIALS AND METHODS
1. Animals
Twenty-four male rats weighing 160±30 g were selected. The animals were treated according to the standard directive as recommended and approved by the research authorities of Shiraz University of Medical Sciences. The rats were randomly divided into four groups each including six animals, which is considered acceptable for stereological studies [13]. In group one (sham-operated animals), laparotomy only was done without any procedures and the rats did not receive any treatments. On the other hand, groups two, three, and four underwent a surgery to induce UUO. The second group received distilled water by gavage. The third group received Taxol (0.3 mg/kg twice per week intraperitoneally) for 28 days [8]. Finally, the fourth group was treated with taurine (7.5 mg/kg/d) dissolved in a distilled water vehicle given by gavage for 28 days [9].
2. Surgical procedure
After the rats were anesthetized with ketamine/xylosine (25 mg/kg i.p. and 2.5 mg/kg i.p., respectively), the abdominal cavity was opened by an incision to reach the left ureter. A 3-0 silk ligature was tied around the ureter, after which the incision was closed. After 28 days, the rats' kidneys were removed.
3. Stereological study
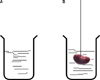
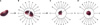
The renal pelvis was dissected out and the kidney was weighed. The primary volume of the kidney, Vprimary, was measured by using Sherle's immersion method [14]. A brief description is presented under Fig. 1. The kidney was fixed in neutral buffered formaldehyde for 1 week. Then, the tissue shrinkage produced by fixation, processing, and staining was estimated. Estimation of the shrinkage and the length of the renal tubules as well as the vessels requires isotropic, uniform random sections [15-17]. These sections were obtained through the orientator method. A brief description is presented under Fig. 2. The estimated shrinkage was also used to estimate the final volume of the kidney to avoid the consecutive sectioning that is required for the Cavalieri method. A description can be found under Fig. 3. After estimating the volume shrinkage [15-17], the final volume of the kidney (the reference space) was corrected by using the following formula:
Vfinal=Vprimary×(1-volume shrinkage).
4. Estimation of the volume and length densities
Each sampled section was analyzed by using a video microscopy system that was made up of a microscope (E-200, Nikon, Tokyo, Japan) linked to a video camera, a computer, and a monitor to determine the parameters. Between 8 and 12 microscopic fields were selected in a systematic random manner. A description can be found under Fig. 3. Then, the stereological grids were superimposed on the images by means of the stereology software designed at Histomorphometry & Stereological Research Center, Shiraz University of Medical Sciences, Shiraz, Iran.
The volume density of each structure (the fraction of the unit volume of the kidney that is occupied by the structure) was estimated by using the point-counting method. A brief description is presented under Fig. 4. The volume fraction of the cortex and the medulla were estimated at a final magnification of ×375 and other parameters at ×1,500. The length density (the length of each tubular structure in the unit volume of the kidney) of the proximal and the DCT, collecting ducts, Henle's loop, and vessels was estimated by randomly overlaying an unbiased counting frame [15] with an area of 2,700 µm2 on the live monitor images. A brief description is presented as the legend of Fig. 5.
RESULTS
1. Histopathological changes
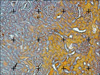
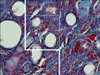
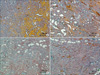
The histological changes of the kidney after the UUO procedure as well as after the UUO procedure plus Taxol or taurine treatment can be observed in Fig. 6. Renal disruption, tubular atrophy, degeneration, necrosis, and fibrosis were observed in the UUO animals. After treatment with Taxol or taurine, the histopathological changes were ameliorated such that more tubules remained identifiable. The amount of fibrotic and necrotic tissue decreased after treatment with Taxol or taurine. Furthermore, the UUO rats treated with Taxol showed more intact renal structures.
2. Volume of the kidney structures
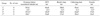
The mean and the standard deviation of the kidney volume, the volume of the cortex, and the volume of the medulla are presented in Table 1. No significant differences were observed between the groups.
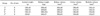
The total volume of the glomeruli, PCT, DCT, Henle's loop, collecting duct, degenerative tubules, and necrotic and fibrotic tissue in the different groups is shown in Table 2. The volume of the glomeruli, PCT, DCT, Henle's loop, and collecting ducts was reduced in the rats after UUO. Less than -8% of these structures remained intact on average. After treatment of the UUO rats with Taxol, -87%, -32%, -51% , -72%, and -88% of the glomeruli, PCT, DCT, Henle's loop, and collecting ducts remained intact, respectively (p<0.01).
After treatment of the UUO rats with taurine, -25%, -16%, -16%, -40%, and -46% of the glomeruli, PCT, DCT, Henle's loop, and collecting ducts remained intact, respectively (p<0.01).
Table 2 depicts the increase in degenerative tubules and necrotic and fibrotic tissues in the UUO groups. In addition, after treating the UUO animals with Taxol, the volume of the degenerative tubules and necrotic and fibrotic tissues was decreased -42% and -53%, respectively, compared with that in the UUO rats.
After treating the UUO rats with taurine, the volume of the degenerative tubules increased 1.8-fold, whereas necrotic and fibrotic tissues decreased -63% compared with that in the UUO rats without any treatments (p<0.01).
3. Length of the tubular structures of the kidney
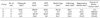
On average, less than -3% of the lengths of these structures remained intact in the UUO rats. After treatment of the UUO rats with Taxol, -65%, 70%, 56%, and 61% of the PCT, DCT, Henle's loop, and collecting ducts remained intact, respectively (p<0.01).
On the other hand, after treatment of the UUO rats with taurine, -49%, -53%, -43%, and -45%, of the length of the PCT, DCT, Henle's loop, and collecting ducts remained intact, respectively (p<0.01) (Table 3).
DISCUSSION
The present study confirmed through a quantitative survey the protective role of Taxol and taurine on renal tissue damage after the induction of UUO in rats. Furthermore, the findings of the present study revealed that Taxol was more protective than taurine. Paclitaxel is an alkaloid plant that is derived from the bark of the Pacific yew tree. Paclitaxel works by disrupting the microtubular network essential for cell division and other normal cellular functions, which eventually leads to cell death [12]. The positive effects of Taxol have been reported in cisplatin-induced and ischemia-reperfusion injuries [18,19]. Moreover, a study demonstrated that Taxol can attenuate oxidative/nitrosative stress, glutathione depletion, enhanced urinary hydrogen peroxide excretion, and the decrease in antioxidant enzymes (catalase, glutathione peroxidase, and glutathione-S-transferase) [18]. In addition, Yoon et al. [18] reported that Taxol can induce cytoprotective enzymes and thereby improve the ischemia-reperfusion-induced changes in lipid hydroperoxides, glutathione, creatinine clearance, kidney weight, and histological abnormalities.
The other compound that was used in the present study was taurine. The protective effect of taurine on nephrotoxicity after cyclosporine or cisplatin treatment has been reported. It is believed that taurine, owing to its antioxidant properties, avoids cyclosporine-induced reactive oxygen species and, consequently, nephrotoxicity [20,21]. In a recent article by Yousef et al. [22], it was shown that taurine induces a protective property after paracetamol-induced oxidative injury of the kidney. Articles have discussed various mechanisms by which Taxol and taurine may protect renal structure changes after UUO. For example, the results of a study by Sun et al. [9] revealed that a low dose of paclitaxel ameliorates renal fibrosis via the modulation of microRNA-192 pathobiology and transforming growth factor-β signaling [10]. Transforming growth factor-β has been shown to play a central role in the development of the tubulointerstitial fibrosis. Guerrero-Beltran et al. [23] reported that Taxol can prevent cell death and inflammation in nephropathy. The antifibrotic effects of Taxol have been observed in other tissues including the liver. The findings of the study by Zhou et al. [12] indicate that 200 nmol/l paclitaxel ameliorates hepatic fibrosis by modulating transforming growth factor-beta signaling. In addition, Koz et al. [24] showed that paclitaxel provided antifibrotic effects during conjunctival wound healing.
The role of taurine in various renal structures has also been reviewed [2]. These major roles include regulating the blood flow in the vasculature of the kidney, scavenging the reactive oxygen species in glomerulus, Na+ transport in the proximal tubules, and osmoregulation as well as cell volume regulation in the medulla. In addition to the preventive roles of taurine in renal fibrosis, other tissues can also be protected. Devi et al. [25] reported that taurine reduces iron-potentiated alcoholic liver fibrosis by reducing oxidative stress, inflammatory and fibrogenic mediators, and stellate cell activation. In addition, the results of the study by Devi and Anuradha [26] showed that the restorative effect of taurine in an experimental model of liver fibrosis involved amelioration of protein and lipid damage by decreasing oxidative and nitrosative stresses. Therefore, a variety of mechanisms can be considered responsible for the protective effects of Taxol and taurine in the present study.
CONCLUSIONS
It can be concluded that Taxol and taurine are both effective in preventing some structural renal damage in the direct obstruction model in rats. The volume of the necrotic and fibrotic tissue was found to be less in the Taxol- and taurine-treated groups. Furthermore, taurine revealed a more protective role on renal structures.

 XML Download