

 PDF
PDF ePub
ePub Citation
 Print
Print


INTRODUCTION
Prostate cancer is the most frequent malignancy of the male genitourinary tract, with an incidence in Asians of approximately 82.2 cases per 100,000 [1]. Early detection of prostate cancer has been essential for decreasing mortality rates. As a result of widespread screening with the prostate-specific antigen (PSA), prostate cancer has been increasingly detected at an early stage [2]; however, the specificity of the PSA level for prostate cancer screening has been limited, and even at PSA levels between 2.5 and 4 ng/ml, cancer is detected in only 25% to 30% of biopsies [3]. A noninvasive test that could detect or exclude such areas throughout the prostate would be of great diagnostic help in prostate cancer patients. Thus, magnetic resonance imaging (MRI) has become increasingly important in the local staging of prostate cancer.
Despite its promise, however, accurate MRI has been complicated by interference from conditions other than prostate cancer, including hemorrhage after biopsy, radiotherapy and hormone therapy, scars, positional and inflammatory changes, and dystrophic changes [4]. Among these factors, hemorrhaging after biopsy has been the most common obstacle to the accurate detection of prostate cancer after a prostate biopsy. Therefore, despite the usefulness of MRI, it can be influenced by post-biopsy hemorrhage. For that reason, magnetic resonance diffusion-weighted (MRDW) and magnetic resonance spectroscopic (MRS) imaging have been adopted as useful tools to overcome the weaknesses of MRI. Prostate magnetic resonance and MRS imaging together with the evaluation of metabolites such as choline, creatine, and citrate have shown considerable promise in the evaluation of tumor diagnosis, extent, and aggressiveness in patients with biopsy-proven prostate cancer [5-8]. A number of studies have found high choline levels and low citrate levels in the areas affected by prostate carcinoma. Therefore, it was reported that the (choline+creatinine)/citrate ([Cho+Cr]/Cit) level may be an effective indicator of prostate cancer [9-11].
Furthermore, MRDW now makes it possible to obtain images of the movement of water molecules in organs. The diffusion properties of the examined tissue can be quantified by calculating the diffusion coefficient, termed the apparent diffusion coefficient (ADC). Studies on prostate cancers have suggested that an increase in ADC values, caused by the loss of cellular density, can provide an early quantitative assessment of a positive tumor response [12].
For the aforementioned reasons, MRDW and MRS have been helpful in the differential diagnosis of prostate cancer. However, the usefulness of MRDW and MRS tests for post-biopsy hemorrhage has yet to be studied. Therefore, in this study we evaluated the effect of post-prostate biopsy hemorrhage on the interpretation of MRDW and MRS imaging in the detection of prostate cancer. Also, we also investigated the hemorrhagic effects on MRI according to the interval from biopsy to MRI to find the optimal timing for MR examination after prostate biopsy.
MATERIALS AND METHODS
1. Patients
This retrospective study was approved by our institutional review board. We reviewed the records of 135 men in whom prostate cancer had been detected following prostate biopsy. All patients underwent MRI (T1-weighted, T2-weighted, diffusion-weighted [DW] imaging, and MRS examinations) after ultrasonographic-guided systematic prostate biopsy of more than 8 cores from January 2007 and March 2011 at our institution. We performed additional biopsies on hypoechoic lesions found on prostate ultrasonography. Among the participants, five men were excluded from this study because they did not match one or more of the following inclusion criteria: MRI examination including DW and MRS imaging and prostate biopsy results available for review. MRI was performed from 1 to less than 61 days after prostate biopsy and no treatment for prostate cancer was received before MRI.
In all subjects, a tissue diagnosis of prostate cancer was determined from an analysis of prostate biopsy specimens. Patient age, PSA level, prostate volume, biopsy results for Gleason score, and percentage of tumor involvement of the biopsy core were recorded from a review of the patients' medical and pathologic records.
2. Magnetic resonance imaging examination
All prostate MRI examinations were performed on a 3.0-T system (Intera Achieva 3.0T, Philips Medical Systems, Best, The Netherlands). Sequences acquired included thin-section high-spatial-resolution sagittal, axial, and coronal T2-weighted fast spin-echo (FSE) images of the prostate and seminal vesicle with the following parameters: TR 3300-3800 ms, TE 80-100 ms, slice thickness 3.0 mm, gap 0.3 mm, and 512×360 matrix. Our protocol also included T1-weighted FSE sequences (TR 2300-3000 ms, TE 63-65 ms, slice thickness 3.0 mm, gap 1 mm, 80×80 matrix) to detect post-biopsy prostate hemorrhage. Diffusion-encoding gradients were applied as bipolar pairs at b-values of 0 and 1000 s/mm2 along the axial directions of motion-probing gradients.
3. Magnetic resonance imaging analysis and histopathologic findings
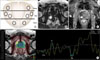
For visual assessment, hemorrhage was considered to be present when an area of high signal intensity within the prostate was observed on T1-weighted MRI. T2-weighted images were used in distinguishing between transitional and peripheral zones. The prostate peripheral zone was divided into 8 sectors, which were divided in the same way as the prostate biopsy region (Fig. 1).
Regions of interest (ROIs) were drawn manually by reviewing the uroradiologist's T1-weighted MRI ADC maps in each of the 8 sectors. The ROI area range was 10.19 mm2. Mean signal intensity values and SDs in the ROI were automatically determined by using picture archiving and communication system (PACS), and the ADC maps were automatically constructed pixel-by-pixel and ADC values for each ROI were generated by using PACS. ADC maps obtained by using a b-value of 1000 s/mm2 were assessed (Fig. 1).
Uroradiologists graded the degree of visible post-biopsy hemorrhage in each of the 8 sectors by using a 4-point scale: a score of 0 indicated no hemorrhage; 1, hemorrhage involving <1/3 of a sector; 2, hemorrhage involving 1/3 to 2/3 of a sector; and 3, hemorrhage involving >2/3 of a sector. For each patient, the total score calculated by summing up the hemorrhage scores from all 8 sectors was designated as the total hemorrhage score [13,14].
Three-dimensional MRS imaging data were acquired by using a water and lipid-suppressed double spin-echo point-resolved spectroscopy (PRESS) sequence. After examination, one experienced uroradiologist, blinded to patient status, performed a consensus review of all MRI, and calculated (Cho+Cr)/Cit levels. In each reading session, high-resolution T2-weighted imaging was used secondarily if descriptions of anatomic details of the prostate were needed (Fig. 1). Pathology slides were reviewed retrospectively by a pathologist and Gleason scores were calculated.
4. Statistical analysis
We retrospectively analyzed the pathologic data regarding biopsy, including age, weight, serum PSA level at diagnosis, prostate volume, biopsy Gleason score, and the interval from biopsy to MRI. We used Spearman correlation analysis to measure the correlation between total hemorrhage score and the interval from biopsy to MRI. We investigated the effect of hemorrhage score (0-3) on ADC values and (Cho+Cr)/Cit ratio, and the relationship between prostate biopsy results and MRI findings by Student's t-test, ANOVA, and chi-square test using SPSS ver. 17.0 (SPSS Inc., Chicago, IL, USA). A level of significance of 5% was adopted.
RESULTS
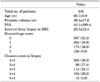
Patient demographic outcomes are provided in Table 1. In this study, 135 men (mean age, 68.7 years; range, 38 to 91 years) had a total of 1080 core prostate biopsies, and 516 (47.8%) of these biopsies yielded prostate cancer. The mean PSA level was 43.1 (range, 1.18 to 1384) (Table 1).
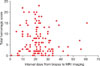
The mean interval from TRUS-guided biopsy to MRI was 23.5 days (range, 1 to 61 days), and the mean total hemorrhage score for our subjects was 6.3 (range, 0 to 23) as graded from prostate MRI. Total hemorrhage scores demonstrated no significant correlations with the interval from biopsy to MRI (p=0.133)(Fig. 2), ADC values and cancer, or the effect of prostate biopsy hemorrhage on MRDW or MRS imaging.
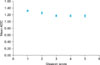
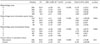
The mean ADC (SD) score was significantly lower for segments with cancer, at 1.25 (0.30)×10-3 mm2/s, than for segments without cancer, at 1.39 (0.28)×10-3 mm2/s (p<0.001). Higher hemorrhagic scores indicated a significant association with higher ADC values for all scores (0 to 3) in both prostate cancer and non-prostate-cancer groups. In the cancer group, 1.2 (0.29)×10-3 mm2/s represented a hemorrhage score of 0, 1.25 (0.29)×10-3 mm2/s a hemorrhage score of 1, 1.36 (0.29)x10-3 mm2/s a hemorrhage score of 2, and 1.47 (0.27)×10-3 mm2/s a hemorrhage score of 3. In the noncancer group, 1.36 (0.29)×103 mm2/s represented a hemorrhage score of 0, 1.38 (0.23)×10-3 mm2/s a hemorrhage score of 1, 1.41 (0.3)×10-3 mm2/s a hemorrhage score of 2, and 1.52 (0.28)×103 mm2/s a hemorrhage score of 3 (p<0.001)(Table 2). Furthermore, ADC values were inversely correlated with tumor Gleason scores in biopsy cores (p<0.001)(Fig. 3).
Table 2 shows the relationship between the (Cho+Cr)/Cit ratio and hemorrhagic grade in cancer and noncancer, respectively (p>0.718, p>0.804). Also, the (Cho+Cr)/Cit ratio did not show any association with prostate biopsy results (p>0.832).
DISCUSSION
Accurate tumor staging is necessary to determine the extent of disease and the choice of treatment. In general, prostate cancer commonly has a lower signal intensity than the normal peripheral zone of the prostate on T2 MRI [15]. More recently, other authors found that the standardized T2 signal intensity of prostate tumors was related to the tumor's Gleason score and lower signal intensities were found in higher tumor grades [16]. The role of MRI in prostate cancer has been the local staging of disease and diagnosis of extracapsular tumor extension [17]. Also, new treatment strategies (e.g., imaging-guided brachytherapy, laser therapy, and cryotherapy) have required an extension of diagnostic imaging beyond staging to provide more precise information about tumor presence and location [18-20]. MRI has demonstrated good sensitivity but low specificity in identifying tumor location because of a large number of false-positives (e.g., cancer, hemorrhage after biopsy, change after radiotherapy, inflammatory changes, and scars) [4]. Accurate tumor localization will allow greater benefit of treatment to areas of prostate cancer and will ideally increase the effectiveness of treatment while reducing treatment-related morbidity.
Prostate cancer is diagnosed in patients through a prostate biopsy. Accordingly, hemorrhage is major barrier to achieving accurate MRI interpretation, and the reduction of any hemorrhage effects is necessary to minimize this barrier. As such, patients undergoing anticoagulant therapy should have that stopped 5 to 7 days before prostate biopsy, warfarin should not be taken, and the international normalized ratio needs to be corrected to <1.5 [21].
Several studies have reported a relationship between diminished time of hemorrhage grade and the time from biopsy [22,23], with some authors arguing that hemorrhage was significantly reduced up to 21days after prostate biopsy [5]. Other authors have suggested that MRI and MRS imaging should be conducted 8 weeks after biopsy [23]; however, other authors have argued that hemorrhage was not significantly reduced until 55 days after prostate biopsy [13]. In our study, 137 men were examined, and the mean time between biopsy and MRI was 23.5 days. The total hemorrhagic score from eight cores demonstrated no significant associations with the interval from biopsy to MRI (p=0.133). Our observation that total hemorrhage grade was not correlated with the time between biopsy and MRI may indicate that the after effects of prostate biopsy may last for variable time periods in different patients. Therefore, we do not recommend individualized deferred MRI times for more accurate cancer staging.
ADCs for prostate cancer detection have been significantly lower in cancer tissue than in noncancerous tissue [24,25]; however, some authors have demonstrated a wide variability of ADC values in noncancerous tissue, which causes a considerable overlap of ADC values between cancerous and noncancerous tissue [26]. For that reason, we investigated the following two areas: the correlation of ADC values and cancer, and the effect of a hemorrhage on ADC values. In our study, the mean ADC (SD) score was significantly lower for segments with cancer, at 1.25 (0.30), than for segments without cancer, at 1.39 (0.28) (p<0.001). Diffusion-weighted imaging is based on differences in water molecule diffusion that are attributable to differences in cellular density between normal and cancerous prostate tissue. We wanted to examine the association between the hemorrhage and MRI of the prostate. For that reason, we had to calculate ADC values even though hemorrhage had an effect on detecting prostate cancer. In our study, a higher hemorrhagic score meant a significant association with higher ADC values at all scores (0 to 3) in both prostate cancer and non-prostate-cancer groups. We extrapolated that these results were due to the effects of hemorrhage on the relaxation properties of prostate tissues and on contrast enhancement (representing microvessel density and leaky vasculature).
We also investigated the relationship between the ADC values and the aggressiveness of prostate cancer. In our study, ADC values were inversely correlated with tumor Gleason score in biopsy cores (p<0.001). That meant that the degree of prostate cancer differentiation influenced the signal intensity of this tumor on DW imaging. The lower ADC values in the more aggressive tumors in our study may have been due to higher cellular density in poorly differentiated tumors, resulting in more restricted movement of water protons [27]. Therefore, it was demonstrated that ADC values could aid in the understanding of cancer aggressiveness.
In several studies, MRI has had good specificity but low sensitivity in the detection of prostate cancer [4-7]. Kozlowski et al reported that combining DW with dynamic imaging obtained better sensitivity, with a small decrease in specificity in the differentiation between cancer and noncancer lesions [28]. In a recent study, combined MR and MRS imaging were better with respect to diagnostic performance than MRI alone [29,30]. Furthermore, a number of studies have found high choline levels and low citrate levels in prostate cancer [9,10]; however, we found no correlation between the (Cho+Cr)/Cit ratio and hemorrhage grade and no significant differences in (Cho+Cr)/Cit ratios between cancer and noncancer lesions. We hypothesized that these findings were due to two reasons. First, there were some differences in protocol between hospitals. The standardization of imaging is very important in order to accurately measure (Cho+Cr)/Cit ratios; however, we did not have a standardized protocol and it was therefore difficult to validate the (Cho+Cr)/Cit ratio levels. Second, the (Cho+Cr)/Cit ratio is a highly sensitive exam and is biased by any patient movement. In our hospital, MRS required more than 20 minutes, and we believe that the (Cho+Cr)/Cit ratios may have been biased by patient movement [31].
There were limitations to the present study. First, this study involved relatively few patients from a single institute, and the study was retrospective. We need further studies including those in a multicenter manner using validated MRS protocols as well as prospective studies. Second, this study was retrospective, and even if the most similar MRI and pathology sections had been selected, there was still some inconsistency between pathology and radiology sections. It is very important to ensure consistency between pathologic and MRI regions to accurately measure ADC and (Cho+Cr)/Cit ratios. In the current study, we did not validate this consistency, and we used ROI to measure on MRI imaging; however, ROI on MRI was not consistent with the core size of prostate biopsies. The third limitation was that hyperintensity on DW images has been reported in hyperacute (intracellular oxy Hb) and late subacute (extracellular meth Hb) stages of hemorrhage. The ADC values have been reported to be decreased in the hyperacute stage and increased in the late subacute stage [32,33]. In the current study, we did not examine ADC and hemorrhage across the five periods (hyperacute, acute, early subacute, late subacute, and chronic state); however, the hemorrhage score was associated with ADC values and it is important to consider the bias effect of hemorrhage on the interpretation of MRDW imaging given that hemorrhage can affect ADC values. The last limitation was that we used biopsy specimens instead of prostatectomy specimens. Discrepancies exist between prostate biopsy and prostatectomy specimens; therefore, we will investigate the correlation between MRDW and MRS findings and prostatectomy specimens in future studies. Despite these limitations, the current study is the first to investigate the effect of hemorrhage on MRDW and MRS findings in normal prostate and prostate cancer specimens. In the future, more accurate imaging markers on MRI that are unaffected by hemorrhage will aid in the diagnosis of prostate cancer.
CONCLUSIONS
Hemorrhage had no significant associations with the interval from biopsy to MRI. Furthermore, ADC values may help to detect prostate cancer and predict the aggressiveness of cancer; however, it is important to consider the bias effect of hemorrhage on the interpretation of MRDW imaging given that hemorrhage can affect ADC values.
 XML Download