

 PDF
PDF ePub
ePub Citation
 Print
Print


INTRODUCTION
Accurate cancer staging systems are essential for planning treatment, to estimate prognosis, to evaluate treatment results, to allow exchange of information among medical centers, and to investigate clinical trials for cancer [1]. Currently, the TNM classification, which defines local extension of the primary tumor (T), involvement of regional lymph nodes (N), and presence of distant metastases (M), is globally accepted for the staging of diverse solid tumors, including renal cell carcinoma (RCC). The sixth edition of the TNM classification of RCC, promulgated in 2002, has been validated in single- and multi-institutional cohorts of patients treated by surgery [2,3].
The incidence of localized RCC has been increasing over the past two decades, mainly because of a rise in the detection of small renal masses [4]. As a result, many studies have evaluated the prognostic significance of tumor size and have proposed modifications of the TNM classification, in particular with regard to the tumor size cutoffs for stage I and II disease [5]. Two recent studies proposed a subclassification of T2 patients into T2a and T2b subgroups based on tumor size [6,7]. Moreover, locally advanced RCC is a heterogeneous disease characterized by invasion of various surrounding structures or extension through venous systems, and the subclassification thereof remains controversial [5]. Accordingly, numerous proposals that the 2002 TNM classification for RCC be updated have appeared [8-15].
On the basis of these recent studies, the Union Internationale Contre le Cancer (UICC) and the American Joint Committee on Cancer (AJCC) updated the TNM classification of RCC in 2009. In this new classification system, (i) T2 tumors are subdivided into two subgroups based on a tumor size cutoff of 10 cm: as T2a if the tumor is 10 cm or less and as T2b if the tumor is greater than 10 cm; (ii) tumors with renal vein involvement are reclassified as T3a; (iii) tumors with ipsilateral adrenal involvement are reclassified as T4 if contiguous invasion and M1 if not contiguous; and (iv) the lymph node classification is simplified from N1 versus N2 to N1, regardless of number of positive lymph nodes [16].
Recently, an Italian group validated the new classification by using a multi-institutional cohort [17]. Another two groups evaluated the prognostic impact of the 2009 TNM classification for T2 RCC [18] and RCC with venous extension [19]. However, only one group has yet compared the accuracies of the new and old systems with respect to prediction of patient outcome [20]. In the present work, we compared the predictive ability of the 2009 and 2002 TNM classification by using a single-center cohort of patients who underwent radical nephrectomy (RN) or partial nephrectomy (PN) for RCC.
MATERIALS AND METHODS
1. Patients
By review of the Nephrectomy Database of the Asan Medical Center, we identified 1731 patients who underwent RN or PN for RCC from 1989 to 2007. A total of 40 patients were excluded, 30 with bilateral RCC and 10 with end-stage renal disease or von Hippel-Lindau disease. A total of 1691 patients underwent RN or PN for unilateral, sporadic RCC in our analysis. The study protocol was approved by the Institutional Review Board of the Asan Medical Center.
2. Evaluation
Staging work-up at the time of diagnosis included chest X-ray, computed tomography (CT) of the abdomen and pelvis, and a bone scan. Based on signs and symptoms, some patients underwent CT of the chest or brain imaging. RN and PN were performed by using standard techniques. If an enlarged lymph node (greater than 1 cm in the longest dimension) was evident on the preoperative CT scan, we always performed regional lymphadenectomy. Sampling biopsies were performed in patients with disease of T3 or higher. Pathologic stage was reclassified according to the 2002 and 2009 TNM classifications. All patients were recommended to undergo radiological evaluation, including chest X-ray, CT of the abdomen and pelvis, and bone scan, every 6 months for 2 years and yearly thereafter. Diagnosis of disease recurrence was based on radiological findings and was confirmed by biopsy if needed. The mean follow-up duration was 60 months (median 51; range, 1-238 month).
3. Statistical analysis
Quantitative data are expressed as means and medians with ranges. Cancer-specific survival (CSS) was calculated from the time of surgery to death from RCC. Follow-up duration was calculated from the time of surgery to the date of death or last follow-up. Cause of death was determined from medical records, from death certificates, or by contacting the family. Patients who were alive or died from causes other than RCC were censored at the date of last contact or death. Kaplan-Meier survival curves were used to estimate CSS and were compared by using log-rank tests. Estimated CSS rates are expressed as percentages with standard errors (SEs). Associations of disease stages based on the 2002 and 2009 TNM classifications with death from RCC were evaluated by using Cox proportional hazards regression models. Each correlation between CSS and disease stage is expressed as a hazard ratio (HR) with 95% confidence interval (CI). The predictive abilities of the two classifications were evaluated by using Harrell's concordance index (c index) [21]. A c index value of 1.0 indicates that the model perfectly separates patients with different outcomes, and a value of 0.5 indicates that the model yields data no better than would be obtained by chance alone. All statistical tests were two-sided, with a p<0.05 considered significant. Data were analyzed by using the SAS software package (SAS Institute, Cary, NC, USA).
RESULTS
Of the 1,691 evaluated cases, 465 patients (27.5%) were females and 1,226 (72.5%) were males. Mean age was 54.3 years, with a range of 10 to 87 years. There were 1,365 (80.7%) clear cell RCCs, and the Fuhrman nuclear grade distribution was as follows: grade 1, n=82 (4.8%); grade 2, n=842 (49.8%); grade 3, n=629 (37.2%); grade 4, n=118 (7.0%); and unmentioned, n=20 (1.2%).
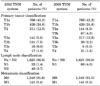
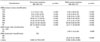
Table 1 summarizes the distribution of the 1,691 patients according to the two TNM systems. The 2009 TNM system subdivided the 211 T2 patients into 144 T2a patients and 67 T2b patients, and the numbers of patients in the T3a, T3b, and T4 classifications also differed compared with the numbers seen with use of the older system.
At the last follow-up, 326 patients had died, including 234 who succumbed to RCC at a mean time of 38 months after nephrectomy (median 26; range, 2-176 months). The mean follow-up time of the 1,366 patients who were still alive at the last follow-up was 64 months (median 57; range, 1-238 months). Estimated 5- and 10-year CSS rates for the entire cohort were 86.3±1.0% and 79.2±1.7%, respectively.
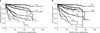
According to the 2002 primary tumor classification, the 5-year CSS rates were estimated as 97.6±0.7% for T1a patients, 92.0±1.5% for T1b, 83.3±2.7% for T2, 61.9±4.6% for T3a, 51.1±5.1% for T3b, 40.0±15.5% for T3c, and 33.6±11.8% for T4 (p for trend<0.001) (Fig. 1A). According to the 2009 classification, the 5-year CSS rates were estimated as 83.2±3.2% for T2a patients, 83.8±5.0% for T2b, 62.6±3.7% for T3a, 41.1±8.8% for T3b, 50.0±17.7% for T3c, and 26.1±8.4% for T4 (p for trend<0.001) (Fig. 1B). In a subset of 211 patients with T2 disease, the CSS values of patients with T2a and T2b RCC did not differ significantly (p=0.945). Considering only the 198 patients with N0/NxM0 RCC, the difference between these two classifications was not statistically significant (p=0.986). The pairwise survival differences among other T stages were statistically significant with the exception of those observed between T3b and T3c diseases (pairwise p=0.759) and between T3c and T4 diseases (pairwise p=0.569).
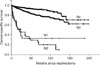
According to the 2002 lymph node classification, the 5-year CSS rates were estimated as 93.7±1.0% for Nx patients, 84.1±1.5% for N0, 33.2±10.1% for N1, and 29.7±7.8% for N2 (p<0.001) (Fig. 2). However, in a subset of 68 patients with regional lymph node metastases, the CSS values of patients with N1 and N2 classification were not significantly different (p=0.728).
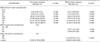
Table 2 and 3 show the results of the univariate and multivariate analyses of the 2002 and 2009 primary tumor classifications with respect to prediction of CSS, respectively. The c index for the 2002 primary tumor classification was 0.810 (95% CI: 0.782-0.839) in the univariate analysis and increased to 0.906 (95% CI: 0.886-0.925) after adjustment for regional lymph node involvement, distant metastases, cell type, and grade by multivariate analysis. The c index for the 2009 primary tumor classification was 0.808 (95% CI: 0.779-0.837) in the univariate analysis and increased to 0.904 (95% CI: 0.884-0.923) in the multivariate analysis.
DISCUSSION
Until the 1990s, Robson's modification of Flocks and Kadesky's system, which emphasized outcomes in patients with locally advanced RCC by focusing on the extent of tumor spread, was accepted as the standard staging system. With the rising incidence of localized RCC over the past two decades [4], the TNM classification has become more widely accepted in clinical practice, and many investigators have assessed the predictive ability of the system, resulting in its continuous refinement [5].
Following the introduction of the 2002 TNM classification, large retrospective cohort studies have suggested subdivision of T2 disease on the basis of tumor size [6,7], and the National Cancer Data Base findings were confirmed regarding impact of size of T2 disease on CSS [16]. In addition, several independent studies suggested that T3 RCC should be subdivided, because ipsilateral adrenal involvement was associated with poorer survival than was T3a RCC with fat invasion [8-10]. Other studies showed that the survival rates of patients with renal vein thrombosis were better than those of patients with subdiaphragmatic vena caval thrombosis [11-13]. These led to further subclassification of T2 RCC in 2009 into T2a and T2b with a 10-cm cutoff, and the criteria for T3 and T4 classifications were modified [16].
The 2002 TNM classification of RCC has been validated by various institutions [2,3], but the 2009 TNM classification has not yet been widely explored. A multi-institutional Italian study found that the 2009 TNM classification was a powerful independent predictor of CSS, but that some primary tumor classifications afforded overlapping prognoses, and some included patients with heterogeneous outcomes [17]. However, the cited study had the limitations of heterogeneity of multi-institutional data and a lack of comparison with the 2002 classification. This motivated us to perform our current work, which compares the 2002 and 2009 TNM classification of RCC with the use of a large, single institutional cohort.
Our results indicate that the 2009 primary tumor classification performed well in stratification of patients with locally advanced RCC on the basis of CSS. The 2009 primary tumor classification was statistically significantly associated with death from RCC with a stepwise increase in risk ratios from T3a to T4, which were approximately 19 for T3a, 37 for T3b, 45 for T3c, and 61 for T4 in the univariate analysis. Although the pairwise survival differences between T3c and the adjacent primary tumor classification did not show statistical significance owing to the small sample size, the difference between T3b and T4 approached statistical significance (pairwise p=0.095). In a multi-institutional Italian study, Novara et al also reported similar CSS between patients with T3c and T4 RCC [17]. Similarly, from a large, single institutional cohort, Kim et al reported no significant survival difference between T3b and T3c diseases [20]. However, in a multi-institutional study including 585 patients with inferior vena cava involvement or higher, Martínez-Salamanca et al found tumor thrombus level was an independent predictor of CSS even after adjustment for tumor size, grade, regional lymph node involvement, distant metastases, and fat invasion [19].
However, we found no significant difference in the CSS of patients with T2a and T2b disease, and we observed that the subclassification of T2 disease by using the 2009 primary tumor classification did not afford superior predictive ability than that offered by the 2002 classification (0.808 vs. 0.810). Our observation that the CSS values of T2a and T2b RCC patients did not differ may be partly attributable to our relatively small sample size. Our study cohort included only 211 patients with T2 RCC and was thus statistically underpowered to detect survival differences between patients with T2a and T2b disease. In a single-institutional study of 544 patients with T2 RCC, Frank et al reported that patients with tumors 10 cm or greater in diameter were more likely to die of RCC than were patients with tumors less than 10 cm in diameter, after adjustment for regional lymph node involvement and distant metastasis [6]. Recently, from the same institutional cohort including more patients, Kim et al reconfirmed the adverse prognosis for T2b tumors compared with T2a and found modestly superior predictive ability of the new TNM classification compared with the 2002 TNM classification [20]. In an international multicenter study of 706 patients with T2 RCC, Klatte et al found a significant association of tumor size with CSS (HR 1.11, p<0.001) and suggested that a tumor diameter size cutoff of 11 cm was appropriate [7]. The results from a multi-institutional Italian study supported a subdivision of T2 tumors by 10 cm [17]. However, a recent multi-institutional German study of 579 patients with T2 RCC revealed no significant difference in CSS between T2a and T2b patients (p=0.38). Even so, previous reports found that tumor size was significantly associated with CSS when size was modeled as a continuous variable in patients with localized RCC [22] and also in patients with locally advanced RCC [23,24]. Thus, it may be that any cutoff is significantly associated with CSS if the sample size is sufficiently large.
The 2002 lymph node classification considers the absolute number of metastatic lymph nodes (Nx, no regional lymph nodes resected; N0, no nodes with metastasis; N1, metastasis in a single regional lymph node; N2, metastasis in more than one regional lymph node), assuming that at least eight lymph nodes are examined. However, several studies found no significant difference in the survival of N1 and N2 patients [14,15], and the 2009 lymph node classification thus integrated N1 and N2 into a single stage, designated N1 [16]. In the present study, we found no significant difference in the CSS of patients with N1 or N2 disease. Thus, amalgamation of node-positive RCC may improve the predictive ability of the 2009 TNM classification when adjusted for regional lymph node involvement.
The present study had several limitations. The major problem is that we used a retrospective design and did not include pathologic review, and thus our results may be vulnerable to confounding errors and bias. Second, with a tremendous increase in stage I tumors, the proportions of T2b, T3b, T3c, and T4 disease were rather low. Thus, our study may not have had sufficient statistical power to detect survival differences among groups of patients with these classifications of disease. Finally, most of our patients who experienced recurrence did not have access to targeted therapies for RCC because they were treated before the development of these relatively new agents.
Primary tumor size has long been a key component of the primary tumor classification for localized RCC. In the development of the 1997 classification, the only modifications of the 1987 classification were the selection of optimal tumor size cutoff points to distinguish T1 and T2 disease. However, the tumor size was still an independent prognostic factor in integrated prognostic systems, including tumor stage [25,26]. The 2002 and 2009 TNM classifications were modified to select optimal tumor size cutoffs for classification of T1 and T2 disease.
In general, TNM classifications must be modified over time to improve prognostic ability and to keep pace with the demands of clinical practice. The frequencies of small and incidental RCCs are increasing, and the cutoff for PN is currently a diameter of 4 cm [27]. The subclassification of T1 RCC was thus designed to keep pace with the results from and requirements of clinical practice. An RCC patient is rarely assigned to T2 classification, because the 2002 TNM classification included renal sinus fat invasion and sinus vein invasion in T3a and T3b, respectively [28]. Moreover, both T2a and T2b RCCs are treated by RN. In future updates of the TNM classification of RCC, we suggest that clinical demands and treatment options be considered in addition to patient prognosis.
CONCLUSIONS
The new TNM classification updated in 2009 offers good statistical power in prediction of the CSS of patients treated by RN or PN. However, the predictive ability by the c index was not superior to that of the 2002 TNM classification in our single institutional cohort, which may be attributable to the subdivision of T2 tumors.
 XML Download