

 PDF
PDF ePub
ePub Citation
 Print
Print


INTRODUCTION
Benign prostatic hyperplasia (BPH) is a prevalent problem among older men, and its incidence is expected to increase as the human lifespan is prolonged. Symptoms of BPH, such as lower urinary tract symptoms (LUTS), have a negative impact on quality of life [1].
Prostate-specific antigen (PSA) is the most important prostate cancer screening tool and the majority of prostate cancers are detected with biopsy after abnormal PSA results. The ability to accurately detect prostate cancer can be compromised by any factor that decreases PSA. Several studies have found that obese men have lower PSA values than do nonobese men [2-7]. Because of hemodilution by the large plasma volume in obese men, some investigators have hypothesized that the PSA value is underestimated in obesity [8].
Multiple studies have reported that obese men have a larger prostate volume (PV) [9-13], and recently some studies have also revealed that a relationship exists between obesity and LUTS [9,11,14,15]. There have been few studies, however, concerning the effect of obesity on LUTS as well as BPH parameters in Korean men, especially symptomatic BPH patients. Furthermore, we think it might be meaningful to investigate this correlation in a single institution. Therefore, we examined the correlation between body mass index (BMI) as a marker of obesity and PSA, PV, and International Prostate Symptom Score (IPSS) in symptomatic BPH patients.
MATERIALS AND METHODS
From January 2008 to December 2008, we retrospectively investigated 258 patients diagnosed with BPH in our institution. All patients underwent detailed clinical evaluations with the IPSS questionnaire and blood tests including PSA values. Transrectal ultrasound (TRUS) of the prostate was also performed. Anthropometric measurements including height and weight were performed. BMI was calculated as weight in kilograms divided by the square of height in meters (kg/m2). IPSS was used as the objective scale for degree of LUTS.
BPH was defined as a PV≥25 ml and IPSS≥8, which are commonly used as clinical BPH criteria [16]. BMI (kg/m2) groups were categorized according to the WHO BMI criteria for Asians as follows: underweight (BMI <18.5), normal weight (BMI 18.5-23.0), overweight (BMI 23.0-27.5), and obese (BMI≥27.5) [17].
The exclusion criteria of this study were the use of medications affecting prostate growth, such as 5-α-reductase inhibitors and antiandrogens; the presence of neurogenic bladder dysfunction; confirmed prostate cancer by needle biopsy of the prostate; acute or chronic urinary retention status; a history of recurrent urinary tract infection or bladder stones; acute or chronic prostatitis within the previous 3 months; and a previous surgical procedure related to BPH.
Statistical analyses were performed by using the SPSS ver. 17.0 (SPSS Inc., Chicago, IL, USA) PSA values were natural-log-transformed to improve normality and to control for age when presenting the results because of the known association between PSA and age [18]. Thus, mean values of PSA are presented as age-adjusted (geometric) means in the figure but are referenced as mean PSA in the text, including tables, to simplify matters. One-way analysis of variance (ANOVA) was used to determine the statistical significance of the differences in age, PSA, PV, and IPSS among the groups according to BMI. Univariate analysis by Pearson's correlation coefficient was used to test the linearity of the relationships between PSA, PV, IPSS, and BMI. A p-value of <0.05 was considered statistically significant.
RESULTS
1. Subjects characteristics
The mean age of the patients was 65.19±9.13 years and their mean BMI was 23.7±4.4 kg/m2. Of the subjects,11 (4.3%) were diagnosed with hypertension and 19 (7.4%) with diabetes mellitus. All of the patients had been using medication and had well-controlled blood pressure or plasma glucose levels. No subjects had diagnosed metabolic syndrome.
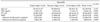
The BMI distribution of the 258 subjects was as follows: 40, 72, 85, and 61 in the underweight (15.5%), normal weight (27.9%), overweight (32.9%), and obese (23.7%) groups, respectively. Mean PSA, BMI, PV, and IPSS including subscores according to each age group are shown in Table 1. Shown in Table 2 are the comparsions of the study subjects in each BMI group.
2. Prostate-specific antigen
The mean PSA value was 3.42±1.53, 3.07±1.88, 2.74±1.75, and 2.60±1.44 ng/ml in each BMI group. The PSA value was lowest in the obese group. There were significant differences in PSA values among the BMI groups (p=0.023) (Table 2).
3. Prostate volume
The mean PV was 35.40±12.82, 46.78±24.34, 49.53±27.14, and 59.95±26.27 ml in each BMI group. PV was largest in the obese group. There were significant differences in PV among the BMI groups (p=0.007) (Table 2).
4. International Prostate Symptom Score
The mean IPSS was 15.13±3.96, 17.90±5.98, 20.19±6.77, and 25.07±5.22 in each BMI group. The IPSS and subscores for obstructive and irritative symptoms were highest in the obese group. There were significant differences in IPSS among the BMI groups (p<0.05) (Table 2).
5. Associations between PSA, PV, IPSS and BMI
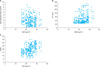
We examined the relationships between PSA, PV, IPSS, and BMI. In the univariate analysis by Pearson's correlation coefficient, BMI correlated negatively with PSA (p=0.023) and positively with PV (p=0.001) and IPSS (p=0.02). The correlation coefficients of PSA, PV, and IPSS were -0.142, 0.320, and 0.470, respectively (Fig. 1).
DISCUSSION
Over the past decades, many different groups have investigated the influence of obesity on the developmentof BPH with conflicting results [19-23]. Freedland et al examined the association between BMI and PSA among men who underwent radical prostatectomy for prostate cancer. They found no association between BMI and PSA [24]. However, Bañez et al examined the association between obesity-related plasma hemodilution and PSA concentration among men who underwent radical prostatectomy for prostate adenocarcinoma. They suggested that the PSA value was underestimated in obesity and that lower PSA values were largely due to hemodilution by the large plasma volume in obese men [8]. Sohn et al investigated the association between BMI and PSA among 26,912 Korean men who visited health promotion centers. They noted that BMI was inversely correlated with PSA [25]. In this study, the mean PSA value was lowest in the obese group. In the univariate analysis by Pearson's correlation coefficient, BMI correlated negatively with PSA (p=0.023).
In terms of correlation between PV and BMI, Kim et al investigated the relationship of PV with metabolic and anthropometric parameters. They reported that PV correlated positively with weight and height, but there was no statistical correlation between PV and BMI in the multivariable linear regression analysis [26]. A recent study of 465 men recruited through a health promotion center showed that PV was positively correlated with central obesity, as represented by waist circumference, but not with overall obesity, as represented by BMI [27]. By contrast, a US study of men who had undergone radical prostatectomy reported that BMI was positively associated with PV in those younger than 63 years [24]. In another study of men shown by biopsy to be without prostate cancer, BMI was directly associated with PV [28].
Obesity may influence prostatic enlargement and may also worsen urinary obstructive symptoms by increasing activity of sympathetic nervous systems [29]. Kristal et al examined several modifiable lifestyle factors related to the development of symptomatic BPH in 5,600 men enrolled in the placebo arm of the Prostate Cancer Prevention Trial who were followed for 7 years [19]. They reported significant increases in symptomatic BPH (IPSS>14) with obesity. Therefore, they suggested that obesity in adulthood was associated with a higher prevalence of LUTS. Rohrmann et al investigated the association between obesity and LUTS in the National Health and Nutrition Examination Survey (NHANES) III cohort [14]. They recognized that an increase in BMI after age 25 was positively associated with LUTS.
We examined patients who visited the department of urology and were diagnosed with BPH. The results of our study showed that the mean value of PV and IPSS increased with elevated BMI. In the correlation analysis, BMI correlated positively with PV (p=0.001) and IPSS (p=0.02). The correlation coefficients for PV and IPSS were 0.320 and 0.470, respectively.
Several recent studies concerning the relationships between BMI and BPH parameters have been reported, but these studies included healthy populations of men who visited a health promotion center. In the present study, we studied symptomatic BPH patients who visited the department of urology for evaluation or treatment. It was an aim of our study to reveal the relationship between BMI and BPH parameters in symptomatic BPH patients. Therefore, we think that it might be meaningful to announce the results of this study to BPH patients.
CONCLUSIONS
Patients with a large BMI tended to have a lower PSA value, larger PV, and higher IPSS. We hypothesize that weight loss could help in the relief of LUTS in BPH patients. We also note that the PSA value was underestimated in obesity. To prevent delay in early diagnosis of coexisting prostate cancer in obese patients, a study of prostate cancer screening in coordination with BMI is warranted.

 XML Download