Abstract
Purpose:
We investigated whether a short-term follow-up prostate-specific antigen (PSA) measurement before prostate biopsy is useful in predicting the presence of prostate cancer.
Materials and Methods:
From January 2004 to May 2008, 670 patients underwent transrectal ultrasound-guided prostate biopsy. The initial PSA (PSA1) was measured at the first outpatient visit. The second PSA (PSA2) was measured the evening before prostate biopsy. Only the patients with a PSA1 between 2.5 and 20 ng/ml and an interval between PSA1 and PSA2 of between 7 and 90 days were included in this study. The short-term PSA velocity (PSAVm) was defined as {(PSA2−PSA1/interval (days)}x30. Prostate volume (PV), PSA1, PSA2, and PSAVm were compared between the patients with prostate cancer and those with benign histology.
Results:
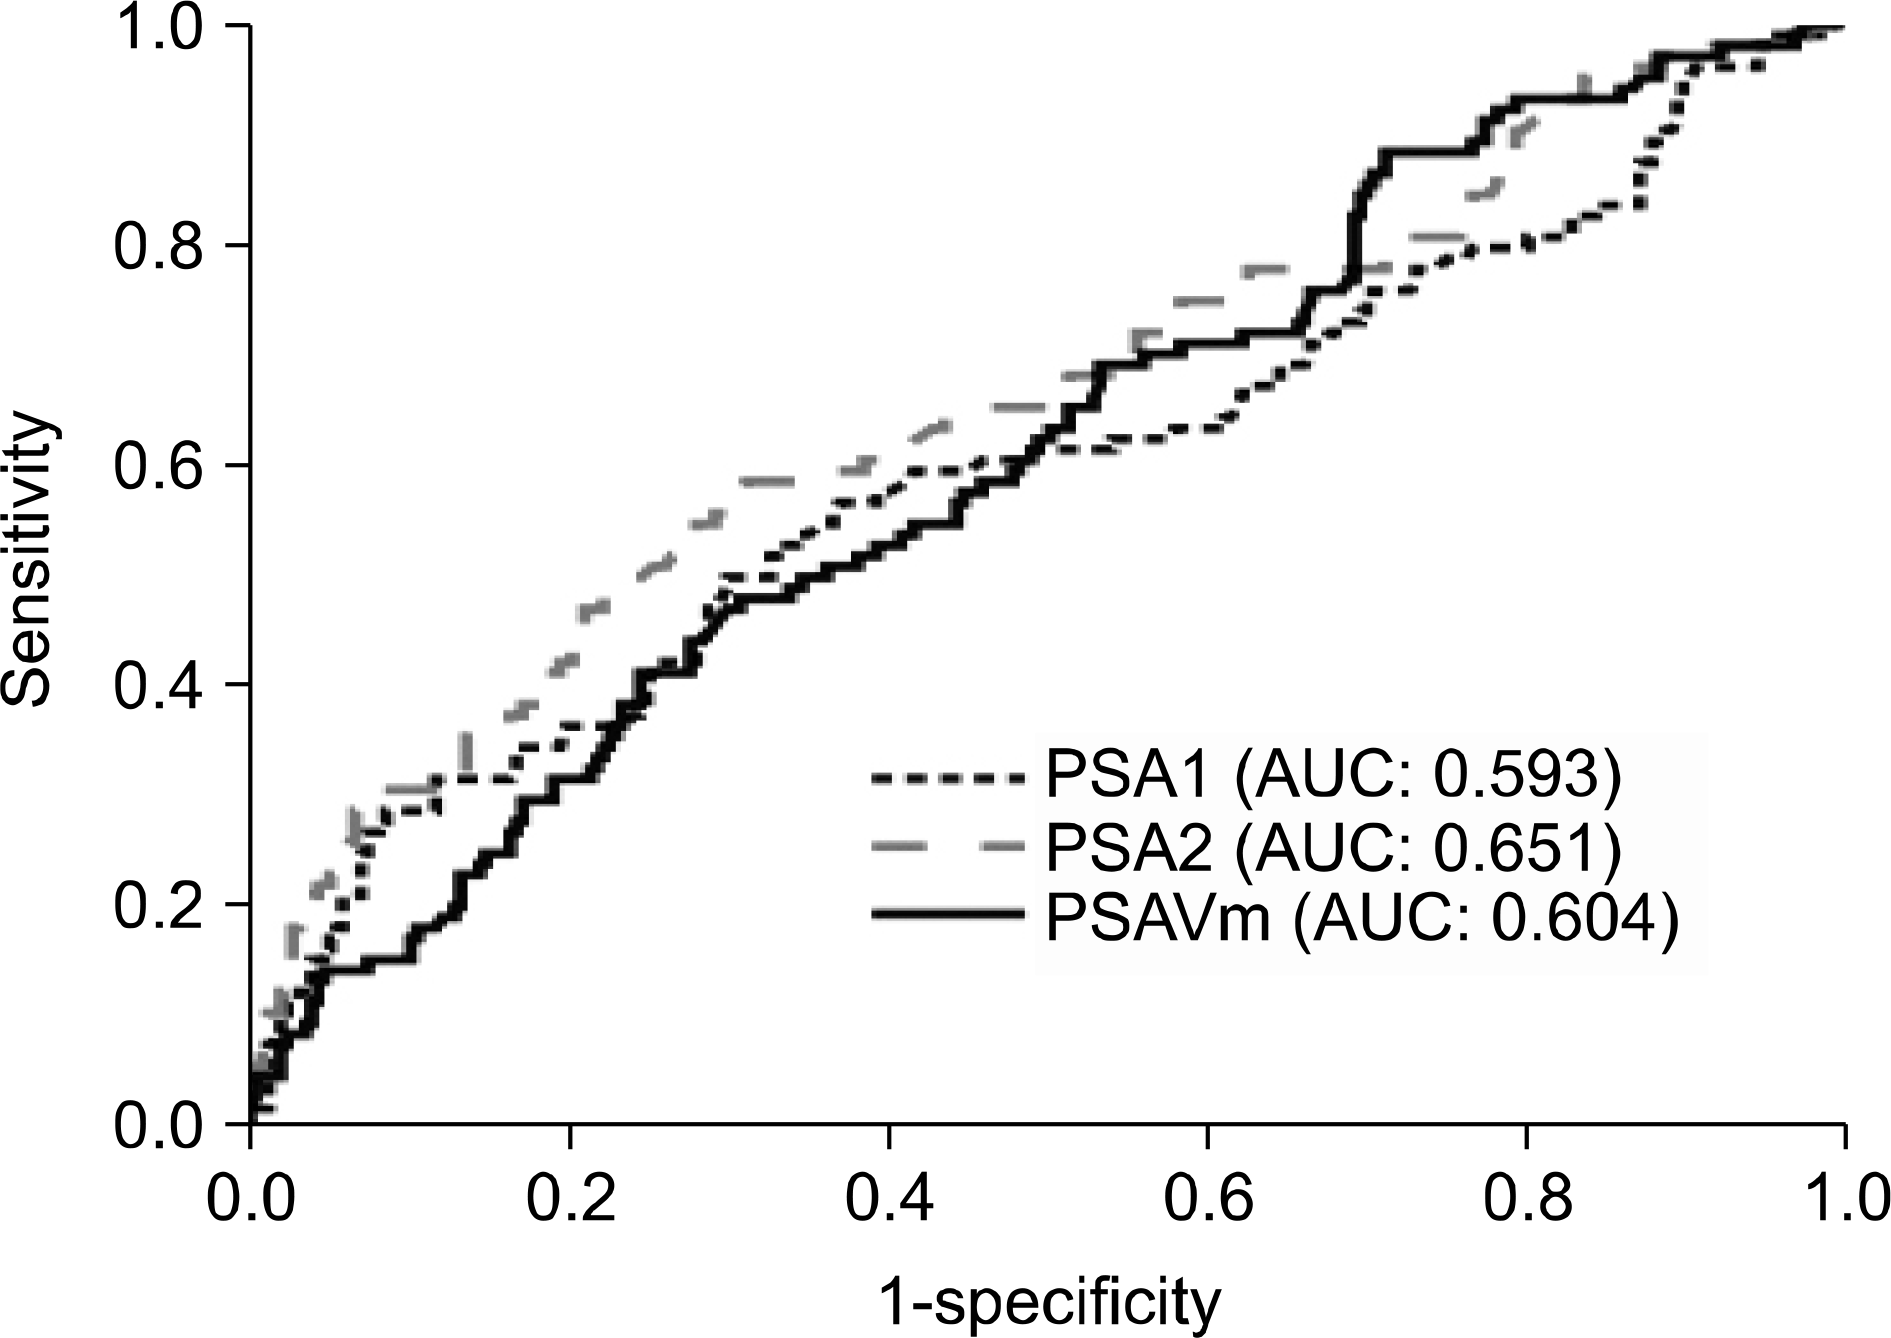
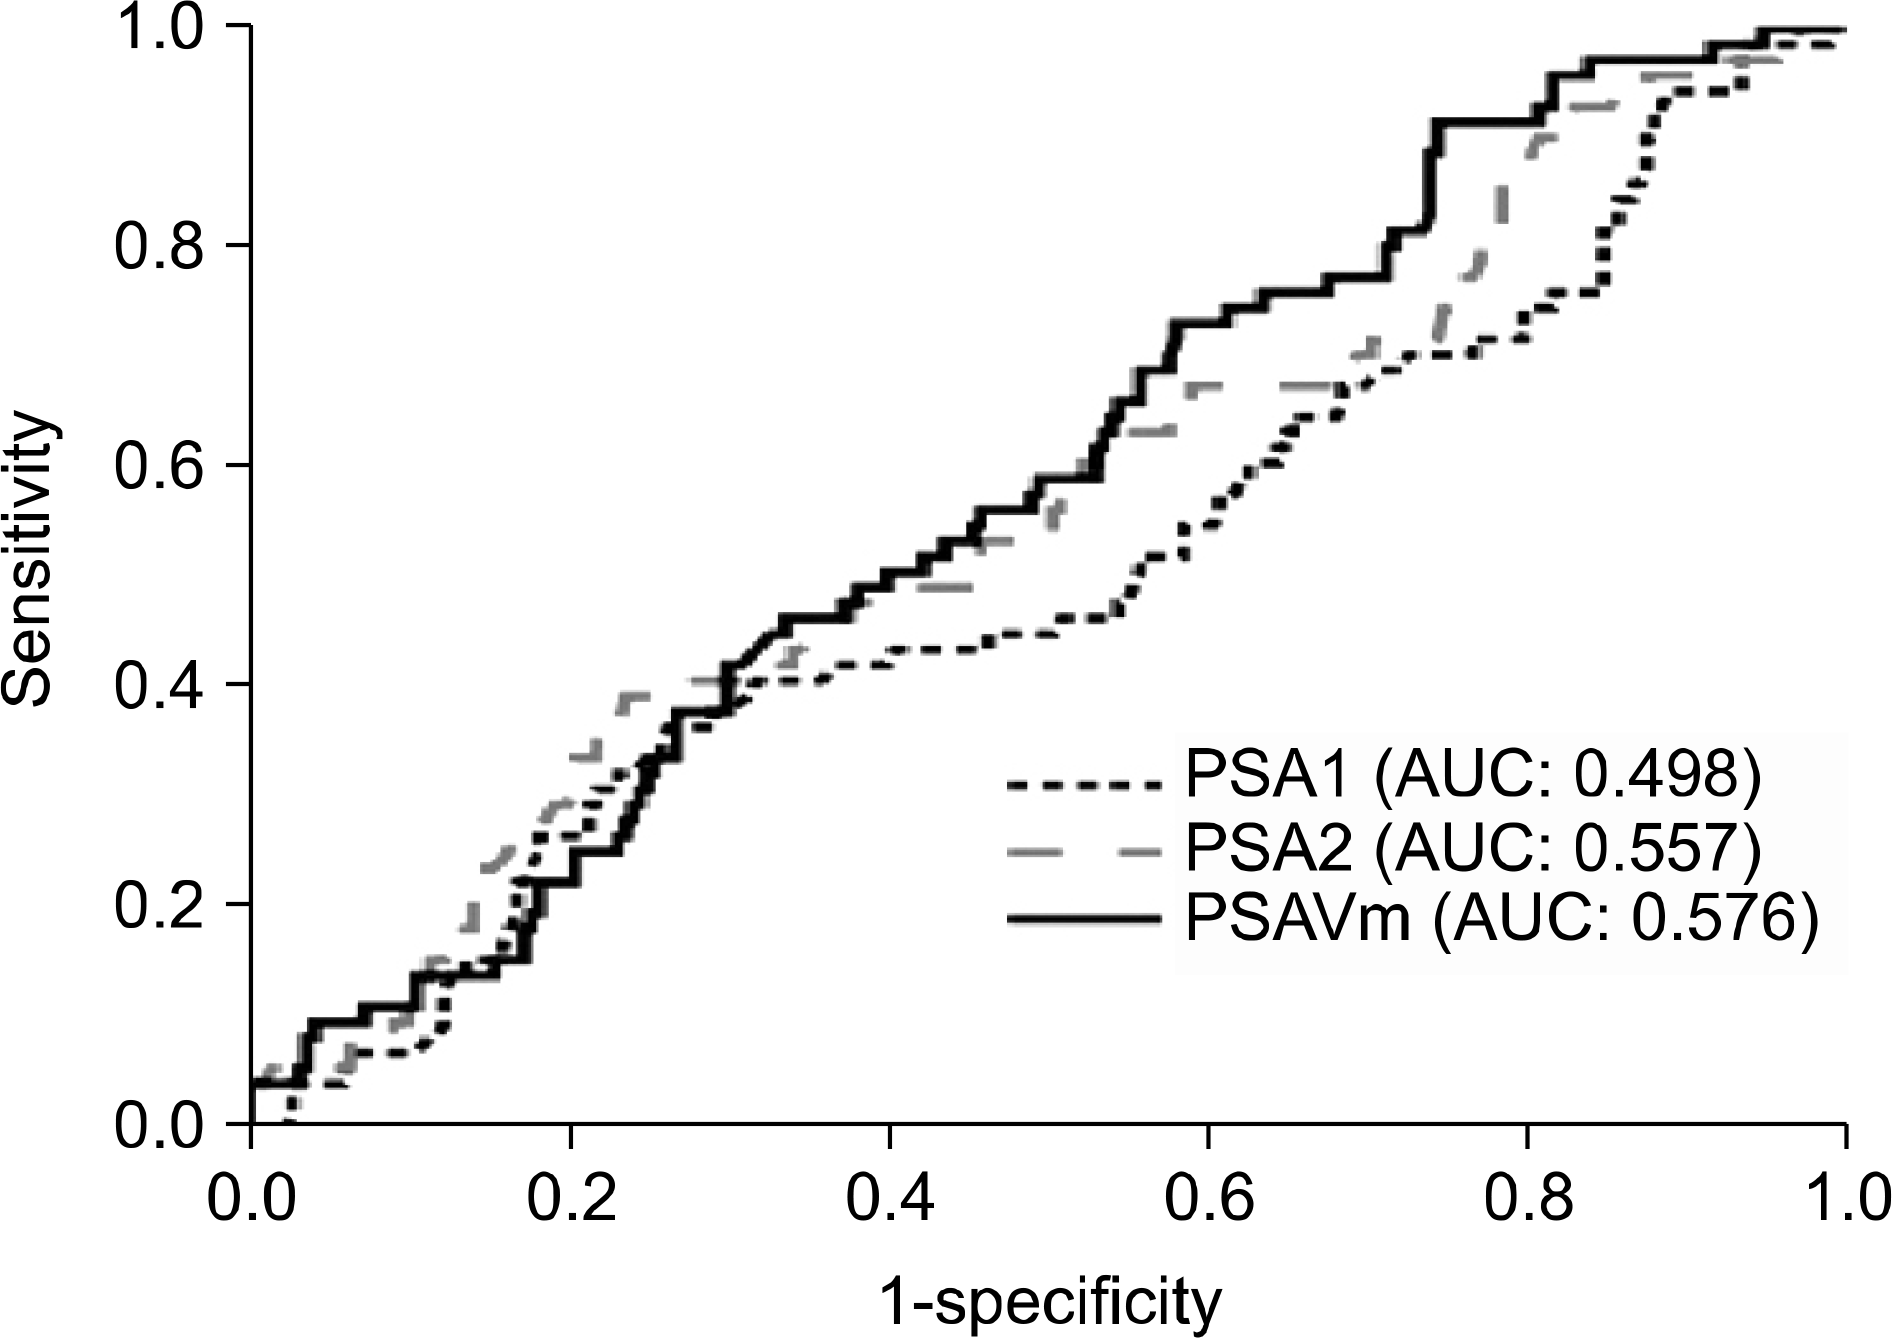
Of the 362 patients who fulfilled the entry criteria, 365 prostate biopsies were performed. The PSAVm differed significantly between patients with prostate cancer and those with benign histology (p=0.021). In patients with a PSA1 of 10-20 ng/ml, age, PV, PSA1, PSA2, and PSAVm were significantly different between patients with prostate cancer and those with benign histology, whereas in patients with a PSA1 of 2.5-10 ng/ml, only PV was significantly different. In multivariate logistic regression analysis excluding PSA1 and PSA2, PSAVm was a significant predictor of prostate cancer overall and in patients with a PSA1 of 10-20 ng/ml, but not in patients with a PSA1 of 2.5-10 ng/ml.
REFERENCES
1.Kim WJ., Chung JI., Hong JH., Kim CS., Jung SI., Yoon DK. Epidemiological study for urologic cancer in Korea (1998-2002). Korean J Urol. 2004. 45:1081–8.
2.Ravery V., Meulemans A., Boccon-Gibod L. Clearance of free and total serum PSA after prostatic surgery. Eur Urol. 1998. 33:251–4.

3.Barry MJ. Clinical practice. Prostate-specific-antigen testing for early diagnosis of prostate cancer. N Engl J Med. 2001. 344:1373–7.
4.Djavan B., Zlotta A., Kratzik C., Remzi M., Seitz C., Schulman CC, et al. PSA, PSA density, PSA density of transition zone, free/total PSA ratio, and PSA velocity for early detection of prostate cancer in men with serum PSA 2.5 to 4.0 ng/ml. Urology. 1999. 54:517–22.

5.Carter HB., Pearson JD., Waclawiw Z., Metter EJ., Chan DW., Guess HA, et al. Prostate-specific antigen variability in men without prostate cancer: effect of sampling interval on prostate-specific antigen velocity. Urology. 1995. 45:591–6.

6.Kim JY., Cho JS., Kwon MS., Jang WS., Park SY., Chung BS, et al. Biological variation of serum prostate specific antigen levels in men aged 50 or older without prostate cancer. Korean J Urol. 2006. 47:1284–8.

7.Prestigiacomo AF., Stamey TA. Physiological variation of serum prostate specific antigen in the 4.0 to 10.0 ng./ml. range in male volunteers. J Urol. 1996. 155:1977–80.

8.Roehrborn CG., Pickens GJ., Carmody T 3rd. Variability of repeated serum prostate-specific antigen (PSA) measurements within less than 90 days in a well-defined patient population. Urology. 1996. 47:59–66.

9.Morote J., Raventós CX., Lorente JA., Enbabo G., López M., de Torres I. Intraindividual variations of total and percent free serum prostatic-specific antigen levels in patients with normal digital rectal examination. Eur Urol. 1999. 36:111–5.

10.Lynn NN., Collins GN., O'Reilly PH. The short-term prostate-specific antigen velocity before biopsy can be used to predict prostatic histology. BJU Int. 2000. 85:847–50.

11.Partin AW., Carter HB., Chan DW., Epstein JI., Oesterling JE., Rock RC, et al. Prostate specific antigen in the staging of localized prostate cancer: influence of tumor differentiation, tumor volume and benign hyperplasia. J Urol. 1990. 143:747–52.

12.Song C., Ahn H., Lee MS., Park J., Kwon TG., Kim HJ, et al. Mass screening for prostate cancer in Korea: a population based study. J Urol. 2008. 180:1949–52.

13.Bruun L., Becker C., Hugosson J., Lilja H., Christensson A. Assessment of intra-individual variation in prostate-specific antigen levels in a biennial randomized prostate cancer screening program in Sweden. Prostate. 2005. 65:216–21.

14.Piironen T., Pettersson K., Suonpää M., Stenman UH., Oesterling JE., Lövgren T, et al. In vitro stability of free prostate-specific antigen (PSA) and prostate-specific antigen (PSA) complexed to alpha 1-antichymotrypsin in blood samples. Urology. 1996. 48(6A Suppl):81–7.
15.Cho CR., Um TH. Evaluation of immunochemical autoa-nalyzer Modular Analytics(R). J Lab Med Qual Assur. 2005. 27:219–25.
16.Sölétormos G., Semjonow A., Sibley PE., Lamerz R., Petersen PH., Albrecht W, et al. Biological variation of total prostate-specific antigen: a survey of published estimates and consequences for clinical practice. Clin Chem. 2005. 51:1342–51.
17.Kobayashi M., Nukui A., Morita T. Serum PSA and percent free PSA value changes after antibiotic treatment. A diagnostic method in prostate cancer suspects with asymptomatic prostatitis. Urol Int. 2008. 80:186–92.
Fig. 1
Receiver operating characteristics (ROC) curves of PSA1, PSA2, and PSAVm. PSA1: initial prostate-specific antigen (PSA), PSA2: PSA measured the evening before prostate biopsy, PSAVm: short-term PSA velocity.

Fig. 2
Receiver operating characteristics (ROC) curves of PSA1, PSA2, and PSAVm when PSA1 was 2.5-10 ng/ml. PSA1: initial prostate-specific antigen (PSA), PSA2: PSA measured the evening before prostate biopsy, PSAVm: short-term PSA velocity.

Table 1.
Comparison between patients with prostate cancer and those with benign histology
| Variables | Total | Cancer group | Benign group | Univariatea p-value | OR (95% CI) | Multivariateb p-value |
|---|---|---|---|---|---|---|
| No. of cases | 362 | 104 (29%) | 258 (71%) | |||
| Age (years) | 65.9 (12) | 67.5 (11) | 65.4 (13) | 0.001 | 1.07 (1.05-1.10) | <0.001 |
| Interval between PSA1 | 29 (20) | 26.0 (20) | 30.0 (19) | 0.072 | ||
| and PSA2 (days) | ||||||
| Prostate volume (ml) | 43.0 (28.5) | 37.9 (18.8) | 47.3 (28.4) | <0.001 | 0.97 (0.96-0.98) | <0.001 |
| PSA1 (ng/ml) | 6.70 (4.02) | 7.87 (6.19) | 6.55 (3.66) | 0.006 | ||
| PSA2 (ng/ml) | 6.07 (3.84) | 7.54 (5.96) | 5.85 (3.23) | <0.001 | ||
| PSAVm (ng/ml/month) | -0.58 (2.1) | -0.20 (2.2) | -0.70 (2.2) | 0.002 | 1.10 (1.01-1.89) | 0.021 |
Table 2.
Comparison of variables according to subgroup
| Variables | Antibiotics intake | p-value | Detection during PSA follow-up | p-value | Detection from health promotion center | p-value | |||
|---|---|---|---|---|---|---|---|---|---|
| Yes | No | Yes | No | Yes | No | ||||
| No. of cases | 49 | 313 | 77 | 285 | 41 | 321 | |||
| Age (years) | 48.5 (25) | 66.9 (11) | <0.001a | 65.9 (10) | 66.0 (13) | 0.679a | 55.5 (19) | 66.7 (11) | <0.001a |
| Prostate volume (ml) | 31.8) (23.8) | 45.0 (28.0) | <0.001a | 46.1 (31.9) | 42.8 (27.1) | 0.182a | 33.2 (25.7) | 43.9 (28.6) | 0.002a |
| PSA1 (ng/ml) | 6.10 (2.65) | 6.92 (4.24) | 0.032a | 6.79 (3.80) | 6.64 (4.19) | 0.675a | 6.59 (3.93) | 6.77 (3.98) | 0.268a |
| PSA2 (ng/ml) | 5.72 (2.88) | 6.20 (4.04) | 0.538a | 5.92 (3.47) | 6.20 (3.99) | 0.858a | 5.48 (4.43) | 6.20 (3.69) | 0.121a |
| PSAVm (ng/ml/month) | -0.14 (1.9) | -0.60 (2.1) | 0.492a | -0.51 (1.4) | -0.60 (2.2) | 0.900a | -0.26 (2.3) | -0.60 (2.1) | 0.783a |
| No. of prostate cancer | 10 (20.4%) | 94 (30.0%) | 0.179b | 15 (19.5%) | 89 (31.2%) | 0.047b | 11 (26.8%) | 93 (29.0%) | 0.856b |
Table 3.
Comparison between patients with prostate cancer and those with benign histology when the PSA1 was 10-20 ng/ml
| Variables | Total | Cancer group | Benign group | Univariatea p-value | OR (95% CI) | Multivariateb p-value |
|---|---|---|---|---|---|---|
| No. of cases | 70 | 33 (47.1%) | 37 (52.9%) | |||
| Age (years) | 69.3 (14) | 71.2 (11) | 66.7 (13) | 0.014 | 1.06 (0.99-1.13) | 0.088 |
| Prostate volume (ml) | 47.1 (40.3) | 42.9 (26.1) | 60.9 (44.8) | 0.009 | 0.99 (0.98-1.00) | 0.352 |
| PSA1 (ng/ml) | 12.23 (4.58) | 12.97 (5.66) | 11.70 (4.42) | 0.038 | ||
| PSA2 (ng/ml) | 11.14 (5.66) | 13.70 (6.76) | 9.64 (6.20) | <0.001 | ||
| PSAVm (ng/ml/month) | -1.49 (4.6) | 0.00 (3.6) | -2.10 (3.9) | 0.001 | 1.19 (1.03-1.37) | 0.016 |
Table 4.
Comparison between patients with prostate cancer and those with benign histology when the PSA1 was 2.5-10 ng/ml
| Variables | Total | Cancer group | Benign group | Univariatea p-value | OR (95% CI) | Multivariateb p-value |
|---|---|---|---|---|---|---|
| No. of cases | 292 | 71 (24.3%) | 221 (75.7%) | |||
| Age (years) | 65.7 (12) | 65.9 (10) | 65.3 (13) | 0.087 | ||
| Prostate volume (ml) | 42.5 (26.0) | 36.8 (17.6) | 46.1 (26.6) | <0.001 | 0.96 (0.95-0.98) | <0.001 |
| PSA1 (ng/ml) | 6.09 (2.70) | 5.90 (3.42) | 6.20 (2.46) | 0.968 | ||
| PSA2 (ng/ml) | 5.53 (2.86) | 5.84 (3.45) | 5.50 (2.46) | 0.152 | ||
| PSAVm (ng/ml/month) | -0.47 (1.8) | -0.25 (1.4) | -0.52 (1.9) | 0.053 | 1.07 (0.98-1.17) | 0.149 |


 PDF
PDF ePub
ePub Citation
 Print
Print


 XML Download