Abstract
Purpose
We wanted to investigate the effect of dominant kidney nephrectomy on the postoperative renal function and we wanted to determine the preoperative risk factors that influence the postoperative renal function in living donor nephrectomy.
Materials and Methods
A total of 297 living kidney donors (159 males and 138 females) who underwent nephrectomy were included in this study. Renal function was measured by the serum creatinine levels and99mTc-diethylenetriamine penta-acetic acid (DTPA) renal scanning. Using univariate and multivariate analyses, the following independent variables were evaluated to predict a postoperative serum creatinine level 1.5mg/dl or higher: removal of a functionally dominant kidney or a larger kidney according to the DTPA renal scan or CT, age, gender, body mass index (BMI), comorbidity, preoperative serum creatinine and the preoperative glomerular filtration rate (GFR).
Results
Of the 297 subjects, 134 (55%) underwent donor nephrectomy on the left side, and 163 (45%) underwent donor nephrectomy on the right side. Univariate analysis showed that gender and the preoperative creatinine level were significantly associated with postoperative serum creatinine elevation (1.5mg/dl or higher) (p<0.05). Multivariate analysis showed that the preoperative creatinine level (p<0.001), the preoperative GFR (p=0.015) and removal of a functionally dominant kidney (p=0.049) were significant factors. The cut-off values from the receiver operating characteristics (ROC) curves were 1.0mg/dl for the preoperative creatinine level, 90.24ml/min/1.73m2 for the preoperative GFR, and 10.94% for the difference of the relative renal function on DTPA.
Conclusions
The preoperative serum creatinine level and the preoperative GFR are critical predictive factors for renal function after living donor nephrectomy. The impact of removing a functionally dominant kidney on the postoperative renal function should be cautiously interpreted in patients where the function of the nondominant kidney is favored.
References
1. Harrison JH, Merrill JP, Murray JE. Renal transplantation in identical twins. Surg Forum. 1956; 6:432–6.
2. Lee YK, Lim SK, Min BS, Chung WH, Kim SG, Lee YU, et al. Renal transplantation in Korea. J Korean Med Assoc. 1969; 12:983–92.
4. Mandal AK, Cohen C, Montgomery RA, Kavoussi LR, Ratner LE. Should the indications for laparoscopic live donor nephrectomy of the right kidney be the same as for the open procedure? Anomalous left renal vasculature is not a contraindication to laparoscopic left donor nephrectomy. Transplantation. 2001; 71:660–4.
5. Sundaram CP, Bargman V, Bernie JE. Method of vascular control during laparoscopic donor nephrectomy. J Endourol. 2006; 20:467–70.
6. Simmons RL, Tallent MB, Kjellstrand CM, Najarian JS. Kidney transplantation from living donors with bilateral double renal arteries. Surgery. 1971; 69:201–7.
7. Farrel RM, Stubenbord WT, Riggio RR, Muecke EC. Living renal donor nephrectomy: evaluation of 135 cases. J Urol. 1973; 110:638–42.
8. Hsu TH, Su LM, Ratner LE, Trock BJ, Kavoussi LR. Impact of renal artery multiplicity on outcomes of renal donors and recipients in laparoscopic donor nephrectomy. Urology. 2003; 61:323–7.

9. Yoo ES, Kim BW, Chang SK. Living donor nephrectomy: surgical selection criteria of laterality. Korean J Urol. 2002; 43:923–6.
10. Najarian JS, Chavers BM, McHugh LE, Matas AJ. Twenty years or more of follow-up of living kidney donors. Lancet. 1992; 340:807.
11. Bia MJ, Ramos EL, Danovitch GM, Gaston RS, Harmon WE, Leichtman AB, et al. Evaluation of living renal donors. The current practice of US transplant centers. Transplantation. 1995; 60:322–7.

12. Kerr SR, Gillingham KJ, Johnson EM, Matas AJ. Living donors >55 years: to use or not to use? Transplantation. 1999; 67:999–1004.
13. Itoh K, Asano Y, Kato C, Nakada K, Nagao K, Goto T, et al. Quantitation of absolute and relative renal uptake using 99mTc-DMSA: sequential change in time and correlation with 99mTc-DTPA uptake. Kaku Igaku. 1990; 27:237–42.
14. van de Wiele C, Everaert K, van de Eeken H, van Haelst JP, Simons M, Dierckx RA. Differential renal function measured by 99mTc-DTPA and 99mTc-DMSA in a complete unilateral renal obstruction rat model. Nucl Med Commun. 1997; 18:1036–9.
15. D'Souza RC, Kotre CJ, Owen JP, Keir MJ, Ward MK, Wilkinson R. Computed tomography evaluation of renal parenchymal volume in patients with chronic pyelonephritis and its relationship to glomerular filatration rate. Br J Radiol. 1995; 68:130–3.
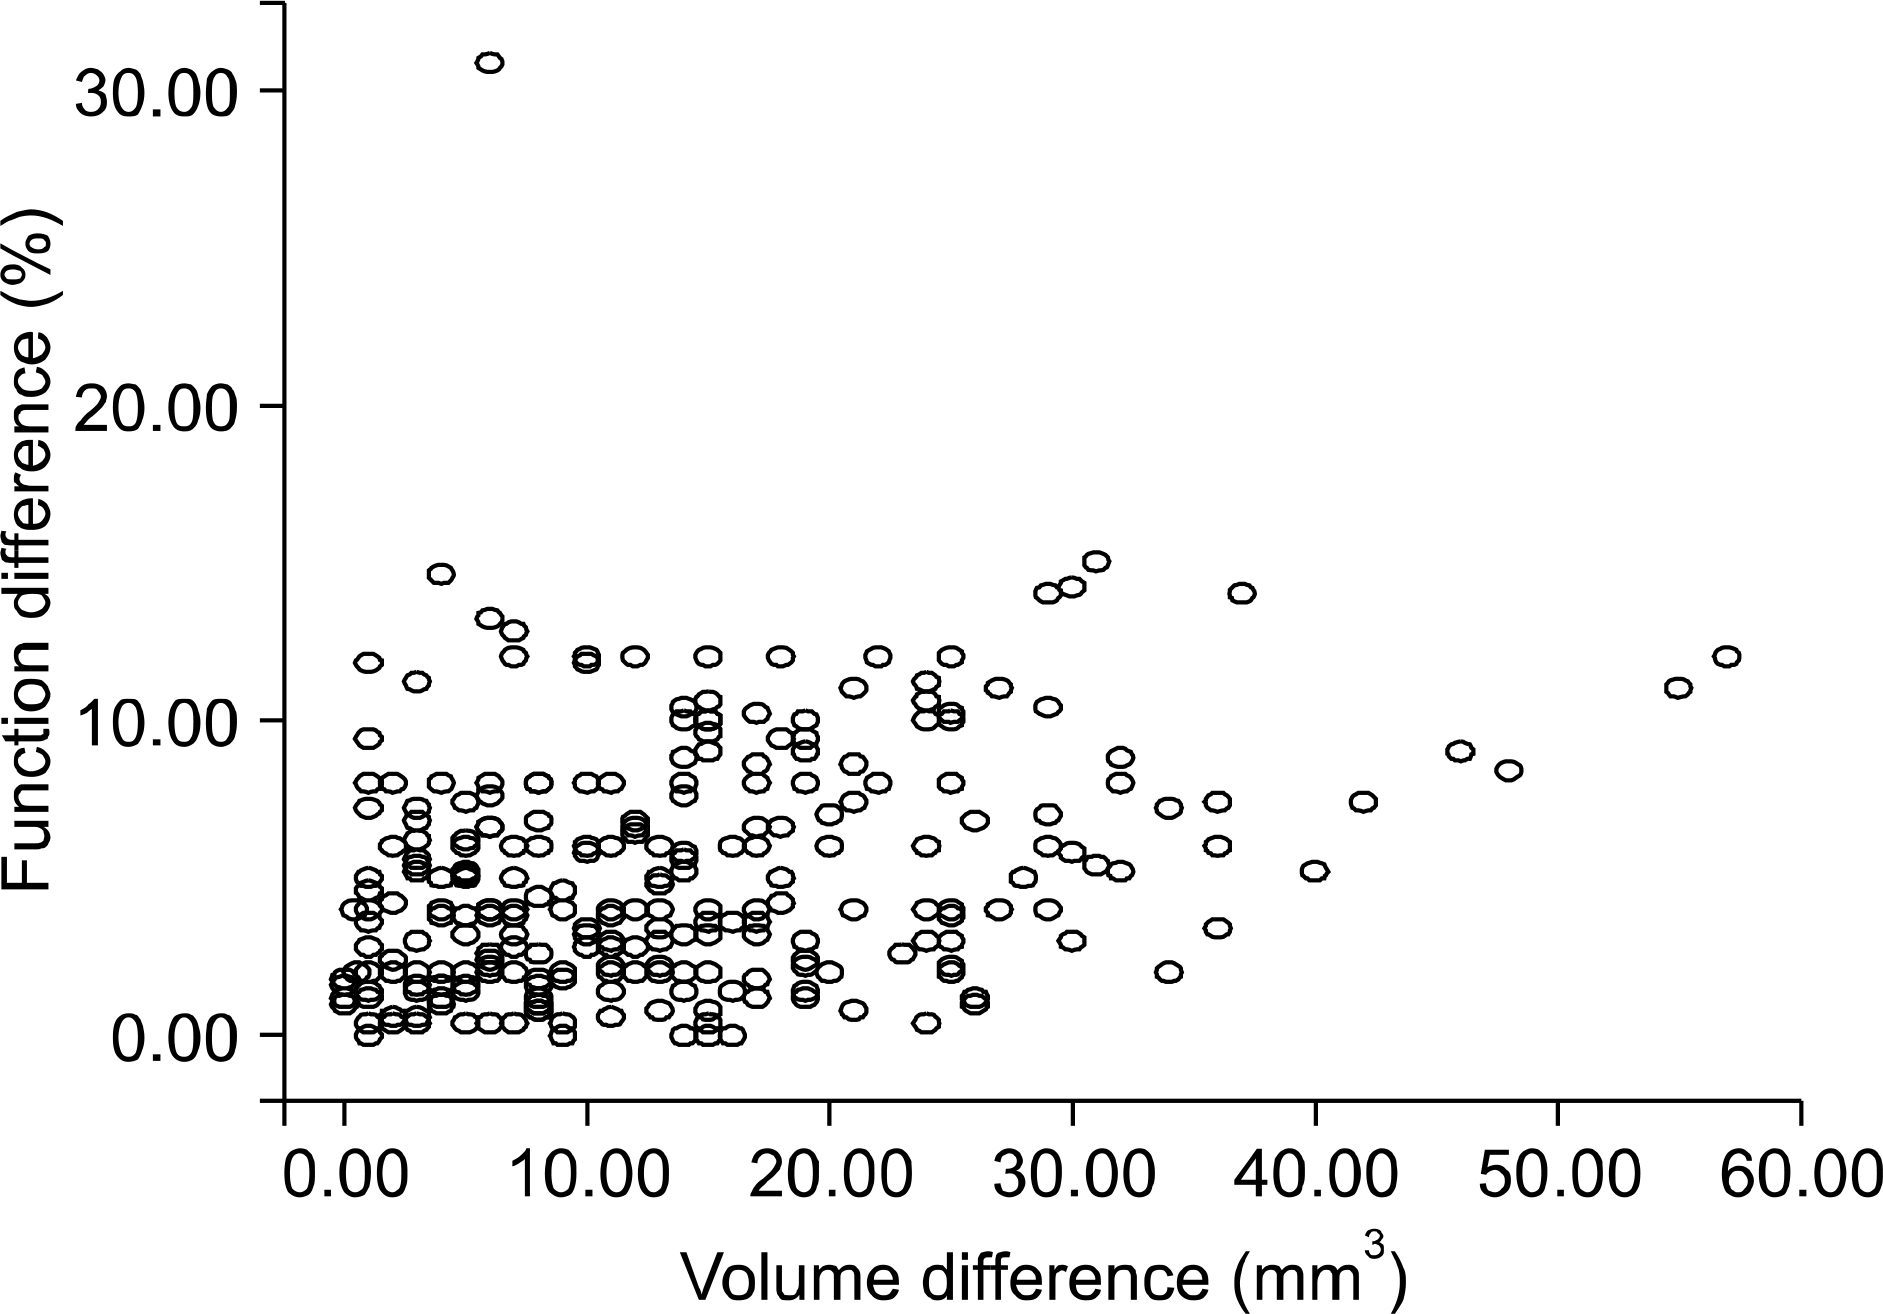
Fig. 1.
Scatter plots of the relationship of volume differences and function differences. Mean volume differences of the CT scan measured volume in both kidneys (mm3). Function difference means the difference in 99mTc-diethylenetriamine penta-acetic acid (DTPA) as measured by the relative function in both kidneys (%).

Table 1.
Patients' characteristics
Table 2.
Reasons for the function-dominant nephrectomies
Table 3.
Relationship of the volume and function differences with the creatinine differences
| Logistic regre creatinine di | ession of volum ifference | me and function d | ifference with |
|---|---|---|---|
| Difference | p-value | Odd ratio | 95% CI |
| Volume | 0.686 | 0.954 | [0.759, 1.199] |
| Function | 0.273 | 1.034 | [0.974, 1.097] |
Table 4.
Univariate analysis of the multiple factors for postoperative azotemia with using the chi-square test
Table 5.
Multivariate analysis of the multiple factors for postoperative azotemia


 PDF
PDF ePub
ePub Citation
 Print
Print


 XML Download