Abstract
Purpose
To evaluate the value of non-enhanced computed tomography (NECT) as a predictor of renal stone destruction by the use of extracorporeal shock wave lithotripsy (SWL).
Materials and Methods
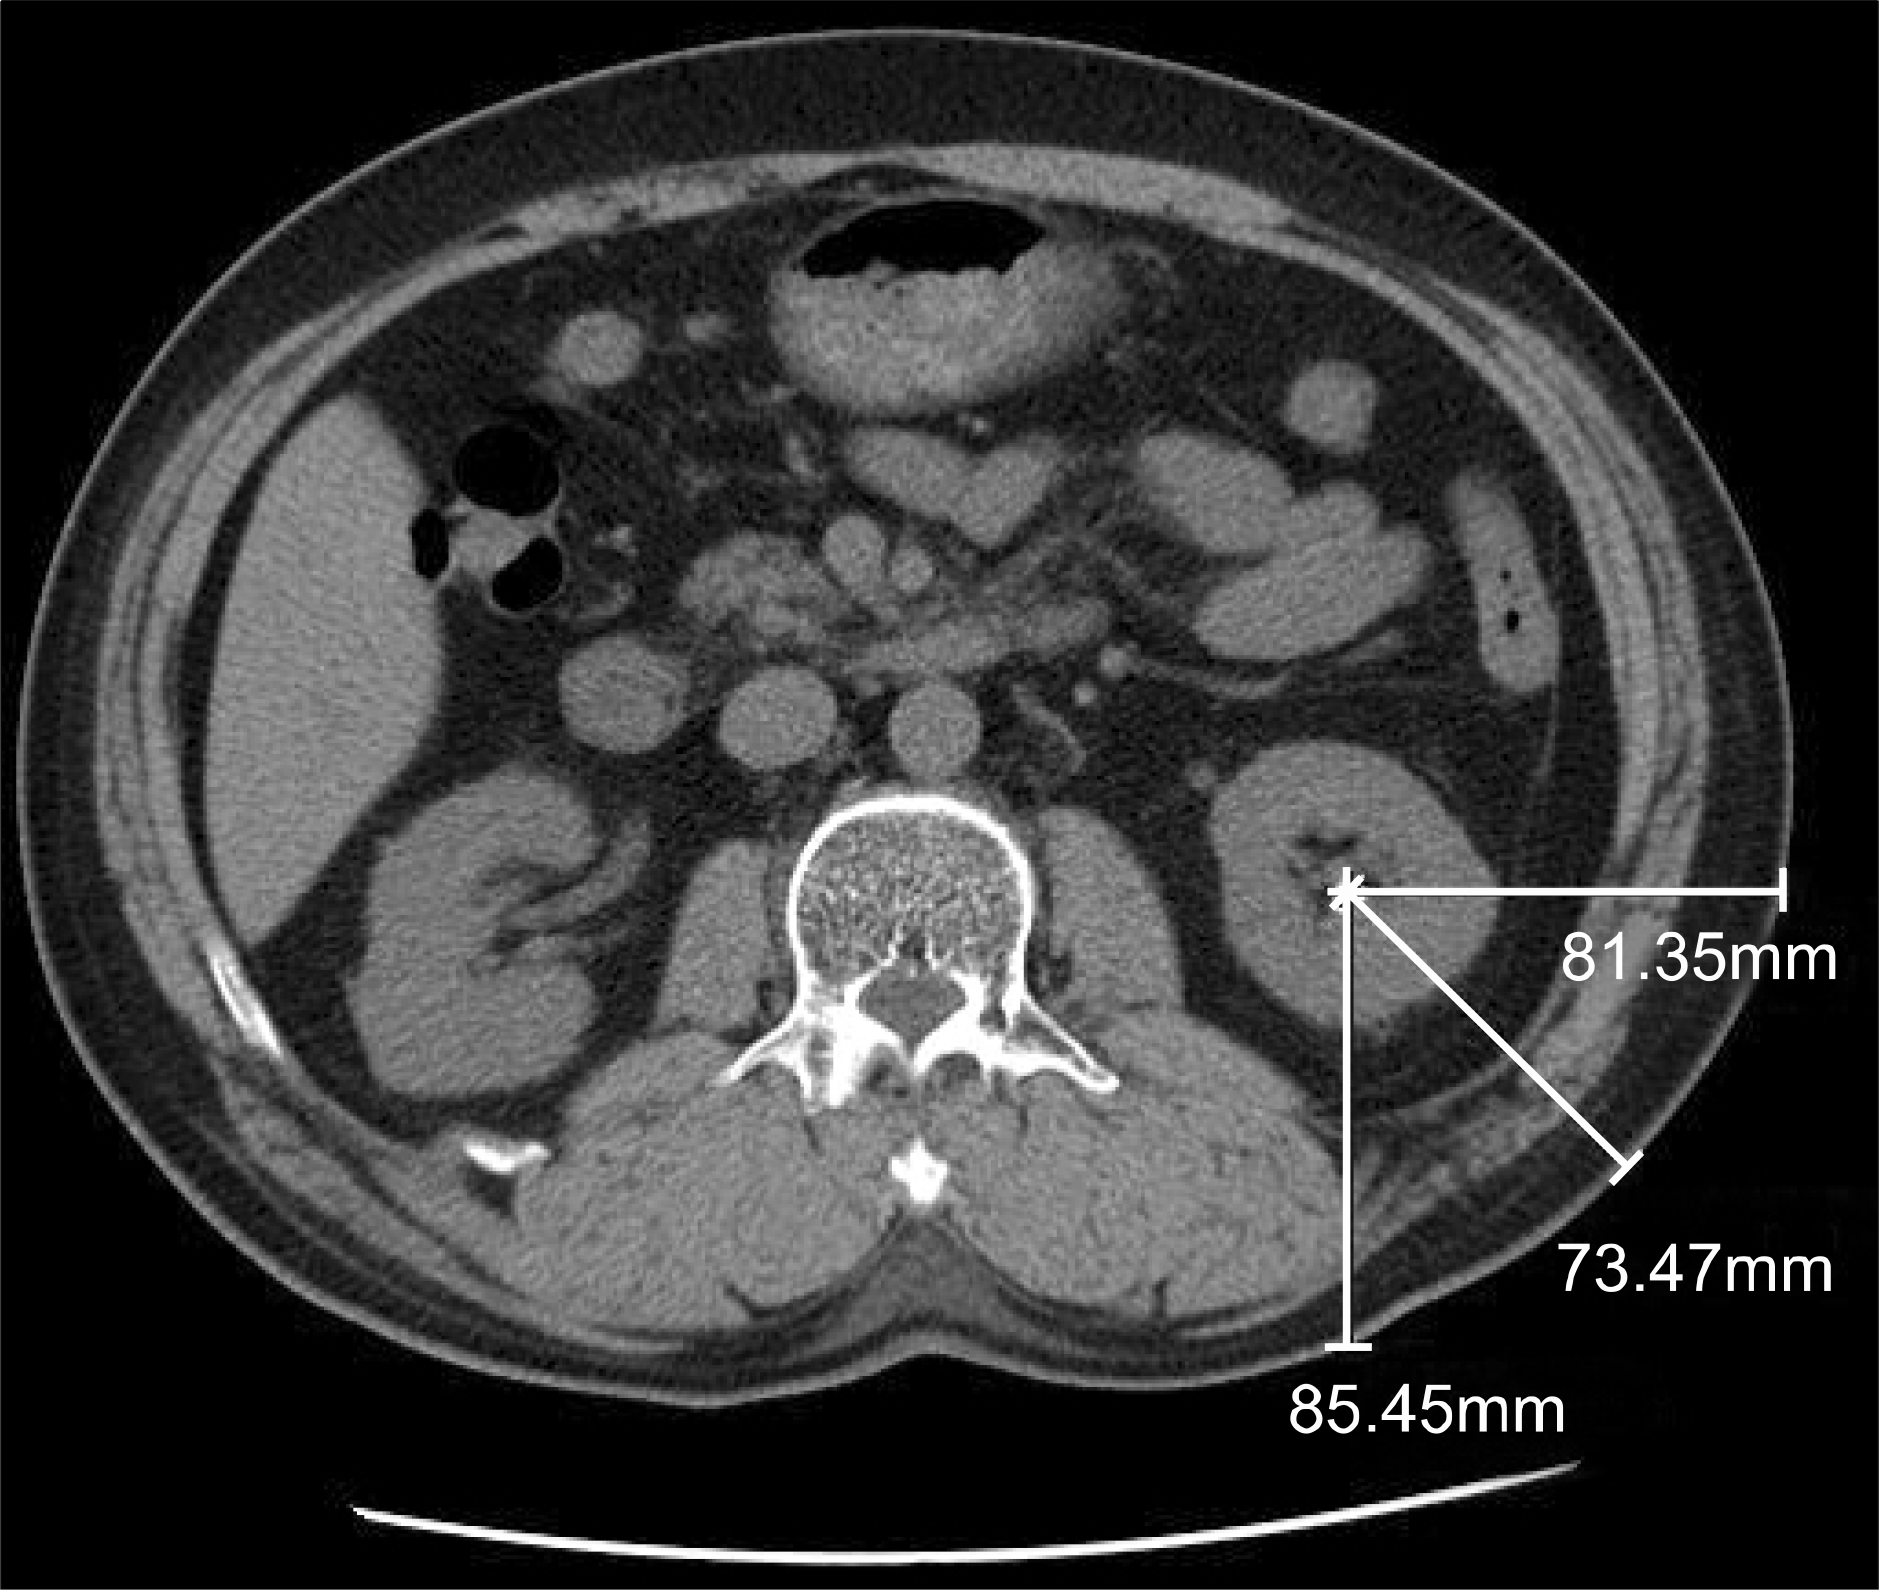
The study included 34 patients with a renal stone diagnosed by NECT. The stone location and size, body mass index (BMI), Hounsfield units (HU) density, and skin-to-stone distance (SSD) were assessed. The SSD was calculated by averaging three distances from the skin to the stone (at 0o, 45o and 90o angles) on NECT. The HU density was evaluated by measuring three different areas of the stone on NECT. Failure of disintegration was defined as no fragmentation or expulsion of the stone after three sessions of SWL.
Results
Failure of disintegration was observed in 14 patients (41.2%). The mean SSD was 8.70±0.75cm for patients where SWL failed to disintegrate the stone (failure group) versus 6.90±1.19cm for patients where SWL successfully disintegrated the stone (success group) (p<0.01). The mean BMI of the failure group (26.37±2.29kg/m2) was significantly higher than that of the success group (23.36±3.48kg/m2) (p<0.01). Stone laterality, size, and HU density were not related to the stone fragmentation rate (p>0.05). By multivariate analysis, SSD was found to independently decrease the stone fragmentation rate of a renal stone (p=0.013; odds ratio=6.219).
Go to : 
REFERENCES
1. Paik ML, Resnick MI. Is there a role for open stone surgery? Urol Clin North Am. 2000; 27:323–31.

2. Wilson WJ, Preminger GM. Extracorporeal shock wave lithotripsy. An update. Urol Clin North Am. 1990; 17:231–42.
3. Singal RK, Denstedt JD. Contemporary management of ureteral stones. Urol Clin North Am. 1997; 24:59–70.

4. Politis G, Griffith DP. ESWL. Stone-free efficacy based upon stone size and location. World J Urol. 1987; 5:225–8.

5. Kim KH, Kim DG, Lee KS, Seo YJ. The factors affecting stone clearance after shock wave lithotripsy for lower calyceal stones. Korean J Urol. 2003; 44:628–32.
6. Yilmaz S, Sindel T, Arslan G, Ozkaynak C, Karaali K, Kaba-alioglu A, et al. Renal colic: comparison of spiral CT, US and IVU in the detection of ureteral calculi. Eur Radiol. 1998; 8:212–7.

7. El-Nahas AR, El-Assmy AM, Mansour O, Sheir KZ. A prospective multivariate analysis of factors predicting stone disintegration by extracorporeal shock wave lithotripsy: the value of high-resolution noncontrast computed tomography. Eur Urol. 2007; 51:1688–93.

8. Park SY, Hong JH, Jeon SS. Predicting the composition of urinary stone by non-enhanced spiral computed tomography. Korean J Urol. 2006; 47:717–21.

9. Chae HS, Lee SH. Hounsfield units of urinary calculi as a predictor of the therapeutic effect of extracorporeal shockwave lithotripsy. Korean J Urol. 2006; 47:70–4.

10. Pareek G, Hedican SP, Lee FT Jr, Nakada SY. Shock wave lithotripsy success determined by skin-to-stone distance on computed tomography. Urology. 2005; 66:941–4.

11. Miller OF, Rineer SK, Reichard SR, Buckley RG, Dnovan MS, Graham IR, et al. Prospective comparison of unenhanced spiral computed tomography and intravenous urogram in the evaluation of acute flank pain. Urology. 1998; 52:982–7.

12. Kim HS, Jang SW, Jeong YB, Kim YG, Kim JS. The usefulness of unenhanced helical computerized tomography in patients with urinary calculi. Korean J Urol. 2003; 44:796–800.
13. Dalla-Palma L, Pozzi-Mucelli R, Stacul F. Present-day imaging in patients with renal colic. Eur Radiol. 2001; 11:4–17.
14. Dalrymple NC, Verga M, Anderson KR, Bove P, Covey AM, Rosenfield AT, et al. The value of unenhanced helical computerized tomography in the management of acute flank pain. J Urol. 1998; 159:735–40.

15. Smith RC, Rosenfiled AT, Choe KA, Essenmacher KR, Verga M, Glickman MG, et al. Acute flank pain: comparison of non-contrast-enhanced CT and intravenous urography. Radiology. 1995; 194:789–94.

16. Ahn SS, Lee SH, Kang I. The value of non-enhanced spiral CT in the diagnosis of suspected urolithiasis. Korean J Urol. 2002; 43:1008–13.
17. Pareek G, Armenakas NA, Fracchia JA. Hounsfield units on computerized tomography predict stone-free rates after extracorporeal shock wave lithotripsy. J Urol. 2003; 169:1679–81.

18. Pareek G, Armenakas NA, Panagopoulos G, Bruno JJ, Fracchia JA. Extracorporeal shock wave lithotripsy success based on body mass index and Hounsfield units. Urology. 2005; 65:33–6.

19. Choi HS, Son KC, Oh KJ, Kwon DD, Park K, Ryu SB. The meaning of computed tomography in extracorporeal shock wave lithotripsy treatment: predicting factors of failure. Korean J Urol. 2007; 48(Suppl 2):): 188, abstract 123.
Go to : 
 | Fig. 1.The measurement of skin-to-stone distance at 0o, 45o, and 90o on an axial scan of non-enhanced computed tomography. |
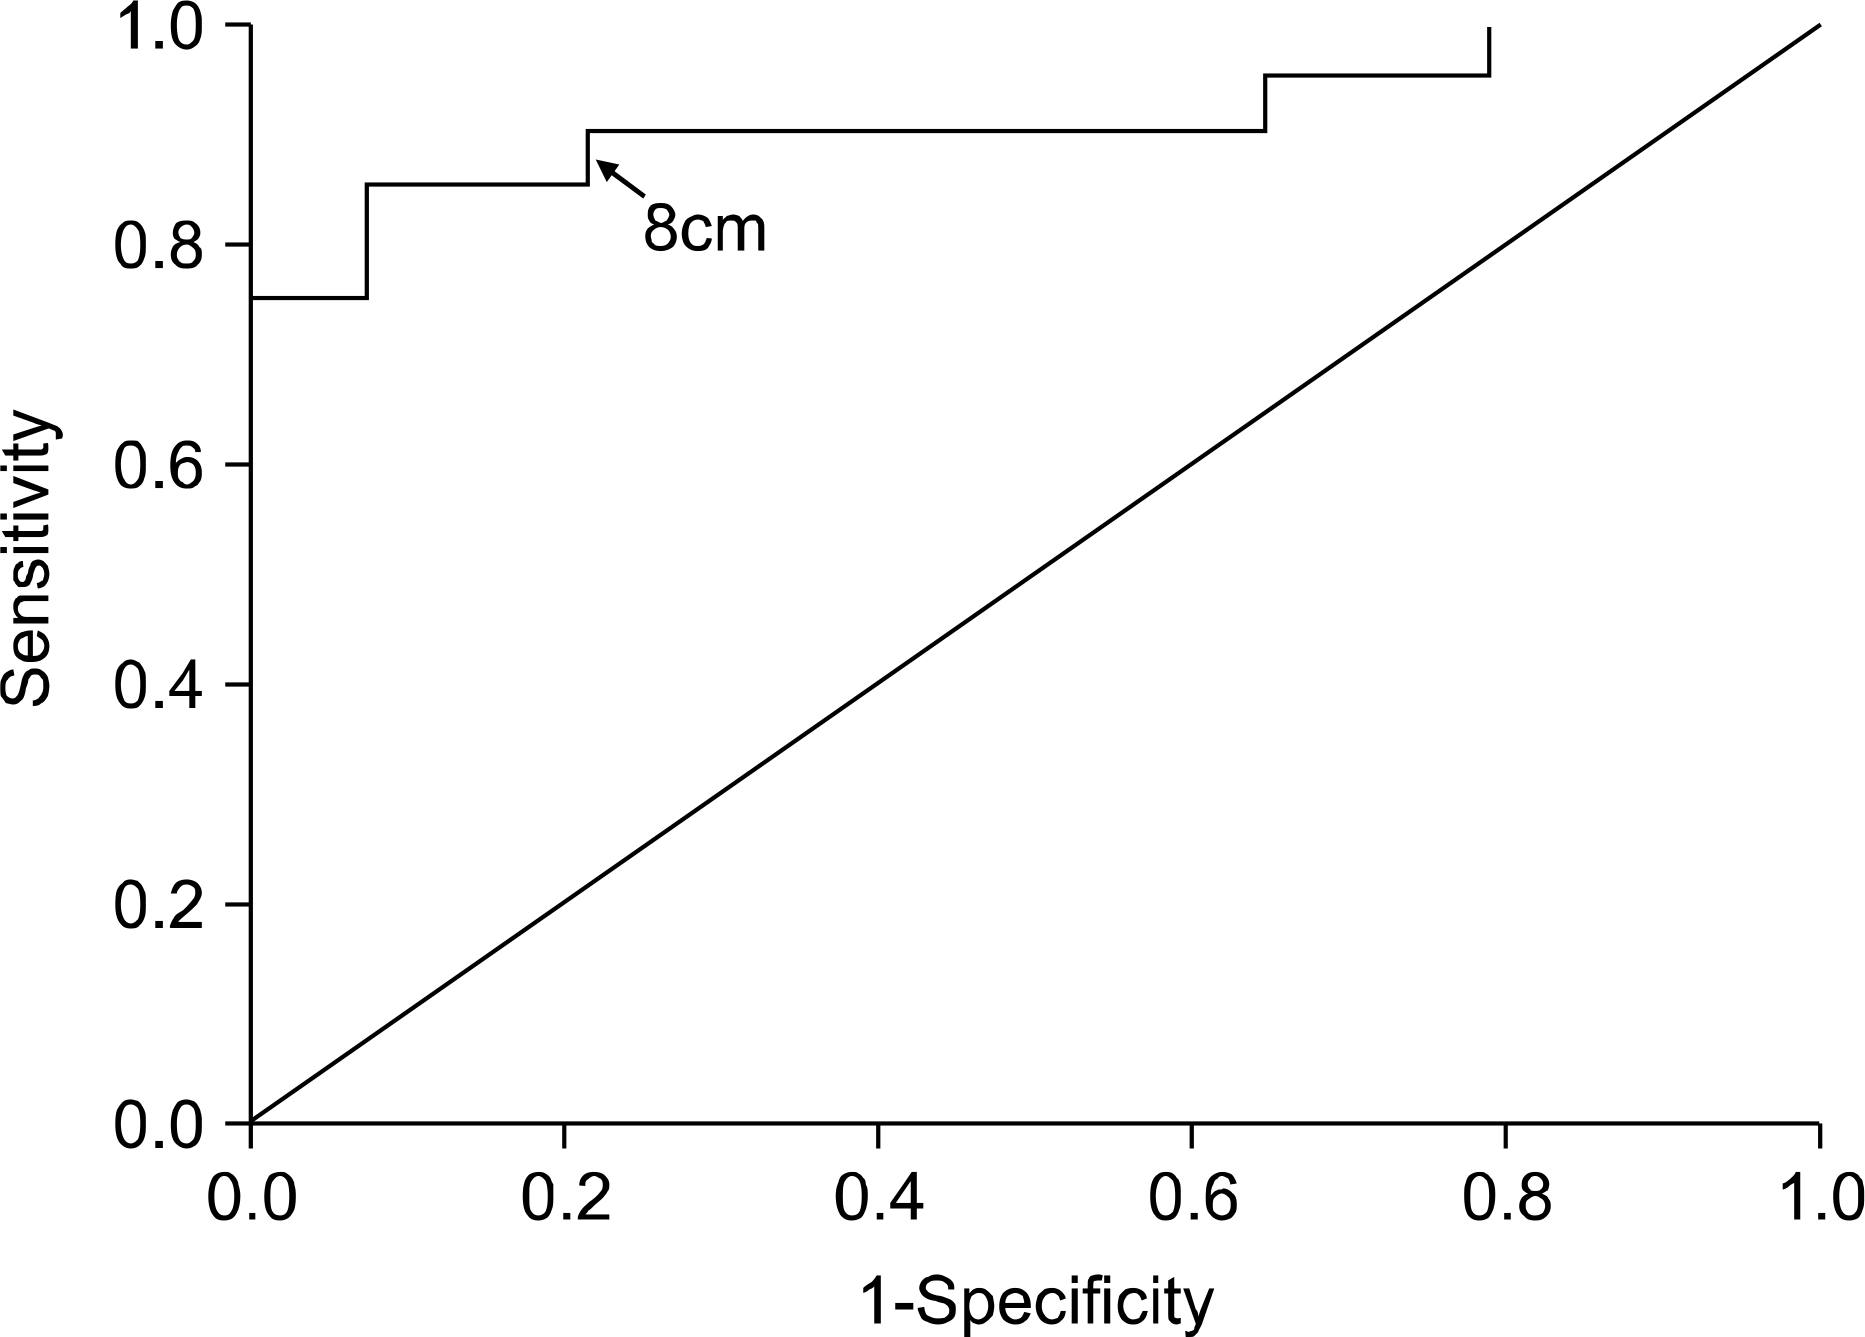
 | Fig. 2.A receiver operating characteristic curve demonstrating the area under the curve of 0.911. An SSD of 8cm represented the most sensitive (87%) and specific (79%) point on the curve. |
Table 1.
Comparison of characteristics in the ESWL-success group of patients and ESWL-fail group of patients
| Success mean±SD | Failure mean±SD | p-value∗ | |
|---|---|---|---|
| Age (year) | 56.95±16.79 | 62.50±12.46 | 0.302 |
| BMI (kg/m2) | 23.36±3.48 | 26.37±2.29 | 0.008 |
| Hounsfield units (HU) | 570.15±339.99 | 783.50±429.79 | 0.116 |
| Stone size (mm) | 9.50±6.04 | 13.21±7.46 | 0.109 |
| SSD (cm) | 6.90±1.19 | 8.70±0.75 | <0.001 |
Table 2.
Univariate analysis for categorical variables predicting failure of disintegration by extracorporeal shock wave lithotripsy
| n | No. of failures (%) | p-value∗ | |
|---|---|---|---|
| Gender | 0.774 | ||
| Male | 18 | 7 (38.9) | |
| Female | 16 | 7 (43.8) | |
| Obesity | 0.005 | ||
| Not obese | 17 | 3 (17.6) | |
| Obese | 17 | 11 (64.7) | |
| Laterality | 1.000 | ||
| Right | 17 | 7 (41.2) | |
| Left | 17 | 7 (41.2) | |
| Stone attenuation | 0.187 | ||
| <1,000 HU | 25 | 9 (36.0) | |
| ≥1,000 HU | 8 | 5 (62.5) | |
| Skin-to-stone distance | <0.001 | ||
| <8cm | 21 | 3 (14.3) | |
| ≥8cm | 13 | 11 (84.6) |
Table 3.
Multivariate analysis of the ESWL success rate according to the parameters by multiple logistic regression analysis
| Odds ratio | 95% confidence interval | p-value∗ | ||
|---|---|---|---|---|
| Lower | Upper | |||
| Age | 0.054 | 0.935 | 1.089 | 0.816 |
| BMI | 0.066 | 0.663 | 1.708 | 0.797 |
| Hounsfield units | 0.053 | 0.997 | 1.003 | 0.818 |
| Stone size | 1.669 | 0.935 | 1.387 | 0.196 |
| SSD | 6.219 | 1.046 | 1.458 | 0.013 |


 PDF
PDF ePub
ePub Citation
 Print
Print


 XML Download