Abstract
Purpose
With the widespread use of screening for prostate-specific antigen (PSA), T1c prostate cancer has shown a marked increase in Western countries. We reviewed the trends in clinical stage migration and the changes in the clinical characteristics for patients with prostate cancer in Korea, and we compared these values with those of Western men.
Materials and Methods
Between 1997 and 2006, 758 men (mean age: 68.6 years) were diagnosed with prostate cancer at our institution. According to the diagnostic period, the patients were divided into 3 groups (the 1997–2000, 2001–2003 and 2004–2006 groups) for comparative analysis of the clinical stage, the serum PSA level and the biopsy Gleason score.
Results
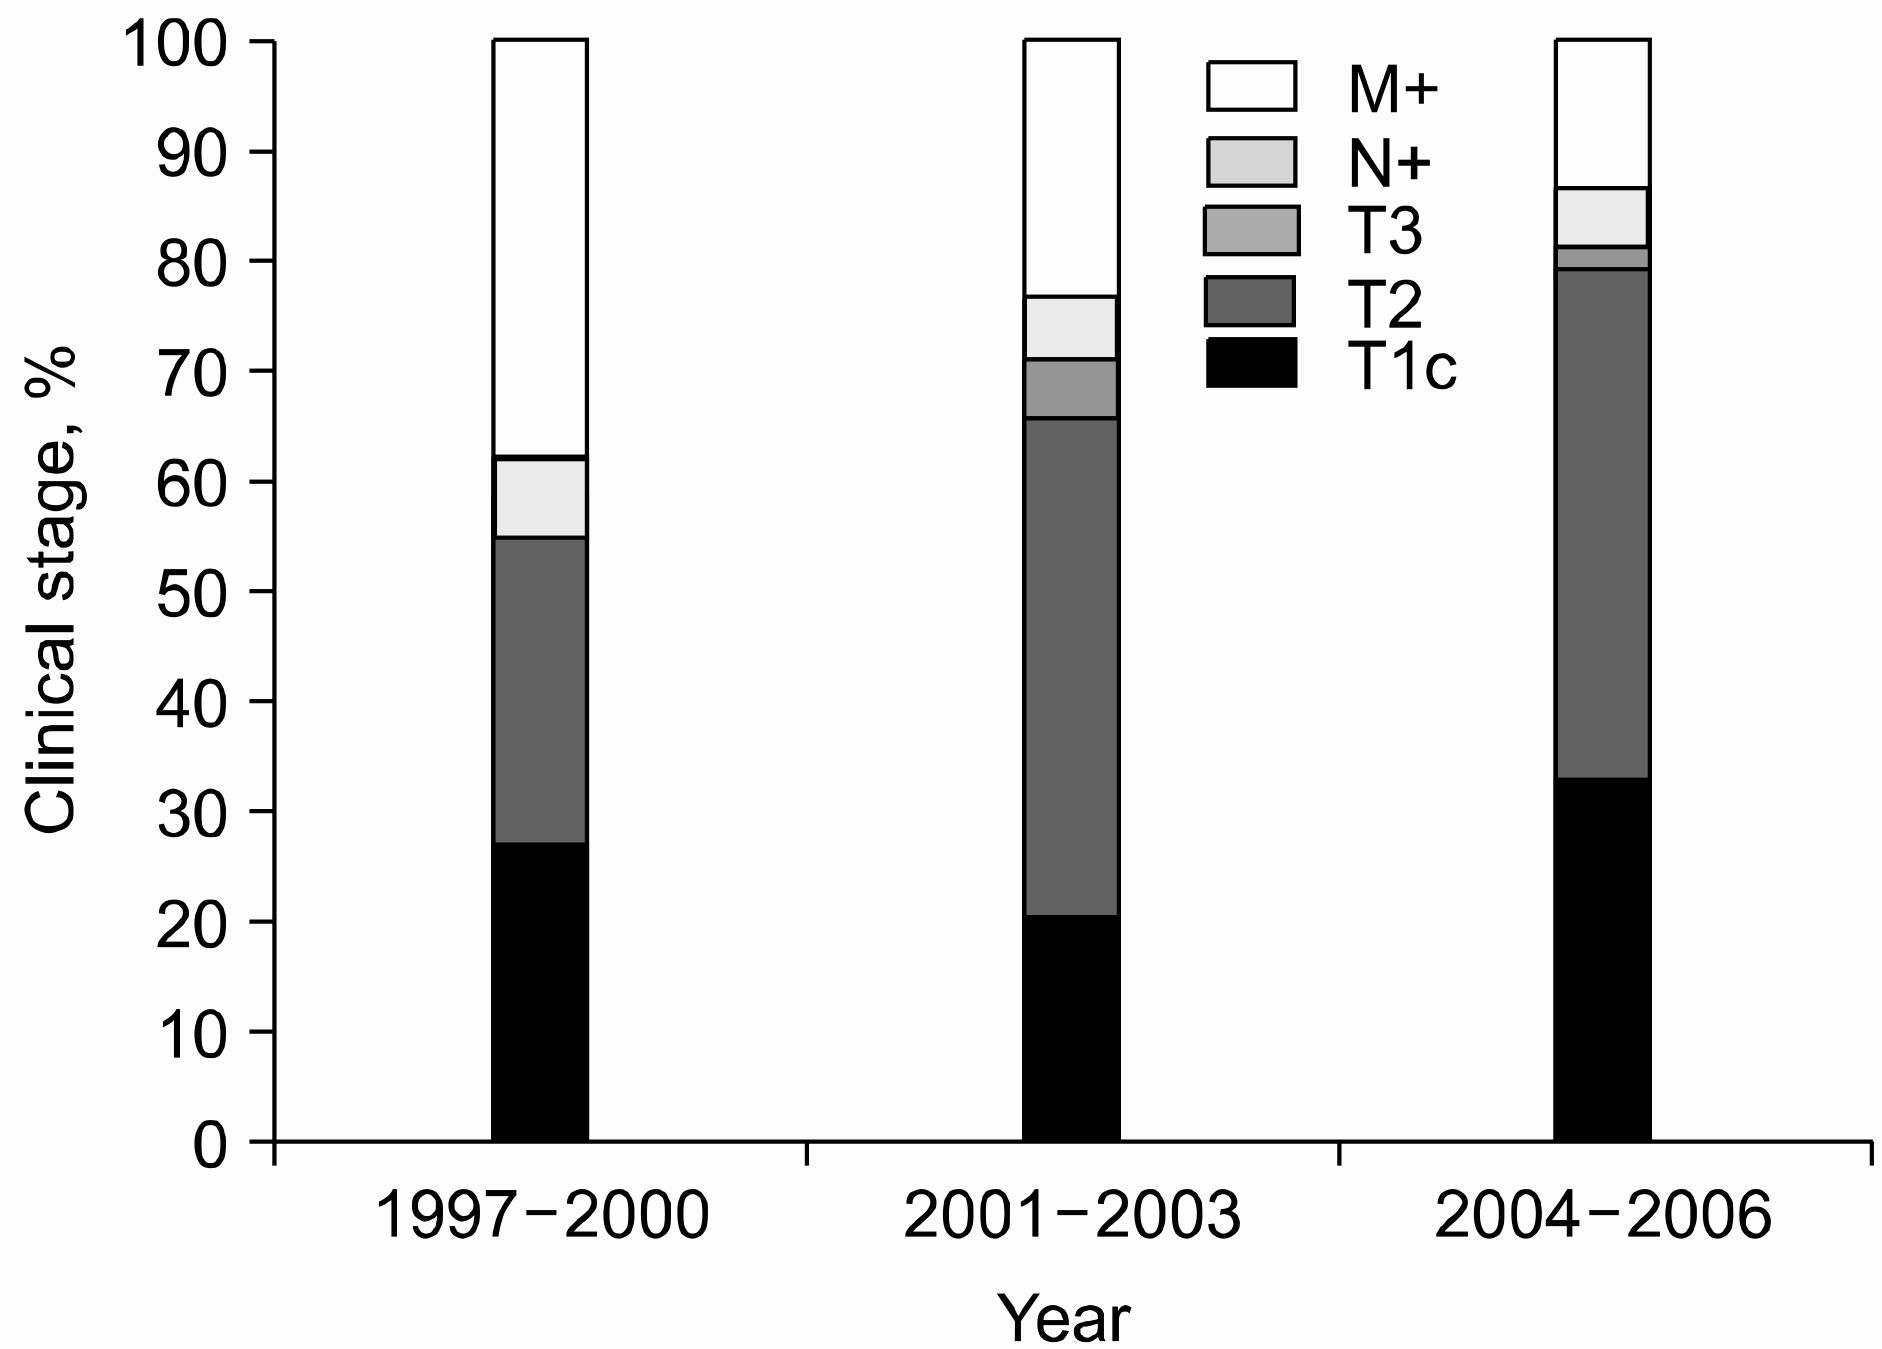
The proportion of clinically localized prostate cancer significantly increased by the period (56.8%, 62.5% and 75.4%, respectively; p<0.001) with that of metastatic disease showing a decreasing according to groups (40.0%, 27.5% and 17.6%, respectively; p<0.001). For localized disease, T1c cancers also increased from 26.4% to 19.2% to 31.6% (p=0.002), respectively. The median serum PSA level at diagnosis decreased from 34.5 ng/ml to 16.6ng/ml to 10.8ng/ml (p<0.001), respectively, with the proportion of patients with a PSA level≤10ng/ml increasing significantly (19.2%, 33.3% and 47.7%, respectively; p<0.001). Although the proportion of biopsy Gleason scores that were 8–10 decreased from 71.2% to 50.2% to 38.3%, respectively, it still comprised 20.8% of the T1c cancers and 22.8% of the cancers with a PSA≤10ng/ml in the last period, and these values were significantly higher than those in the Western reports.
Conclusions
Downward migration of the clinical stage along with decreases for the serum PSA level and biopsy Gleason score were evident in Korean men. However, the proportion of T1c cancer was still lower than that in the Western series and the fraction of Gleason score 8–10 cancer was distinctively high. We believe this mandates establishing PSA screening programs and administering vigorous management.
References
1. Jemal A, Siegel R, Ward E, Murray T, Xu J, Smigal C, et al. Cancer statistics, 2006. CA Cancer J Clin. 2006; 56:106–30.

2. Cancer Registration and Biostatistics Branch, National Cancer Center. Cancer Statistics in Korea. 2003.
3. Lu-Yao GL, Greenberg ER. Changes in prostate cancer incidence and treatment in USA. Lancet. 1994; 343:251–4.

4. Catalona WJ, Smith DS, Ratliff TL, Basler JW. Detection of organ-confined prostate cancer is increased through prostate-specific antigen-based screening. JAMA. 1993; 270:948–54.

5. Amling CL, Blute ML, Lerner SE, Bergstralh EJ, Bostwick DG, Zincke H. Influence of prostate-specific antigen testing on the spectrum of patients with prostate cancer undergoing radical prostatectomy at a large referral practice. Mayo Clin Proc. 1998; 73:401–6.

6. Farkas A, Schneider D, Perrotti M, Cummings KB, Ward WS. National trends in the epidemiology of prostate cancer, 1973 to 1994: evidence for the effectiveness of prostate-specific antigen screening. Urology. 1998; 52:444–8.

7. Stamey TA, Donaldson AN, Yemoto CE, McNeal JE, Sozen S, Gill H. Histological and clinical findings in 896 consecutive prostates treated only with radical retropubic prostatectomy: epidemiologic significance of annual changes. J Urol. 1998; 160:2412–7.

8. Soh S, Kattan MW, Berkman S, Wheeler TM, Scardino PT. Has there been a recent shift in the pathological features and prognosis of patients treated with radical prostatectomy? J Urol. 1997; 157:2212–8.

9. Mettlin C, Murphy GP, Babaian RJ, Chesley A, Kane RA, Littrup PJ, et al. The results of a five-year early prostate cancer detection intervention. Investigators of the American Cancer Society National Prostate Cancer Detection Project. Cancer. 1996; 77:150–9.
10. Murphy GP, Natarajan N, Pontes JE, Schmitz RL, Smart CR, Schmidt JD, et al. The national survey of prostate cancer in the United States by the American College of Surgeons. J Urol. 1982; 127:928–34.

11. Kim SD, Sung GT, Yoon JH. Epidemiological survey of prostate cancer prevalence in Kangseo-gu, Busan, Korea. Korean J Urol. 2003; 44:1251–5.
12. Derweesh IH, Kupelian PA, Zippe C, Levin HS, Brainard J, Magi-Galluzzi C, et al. Continuing trends in pathological stage migration in radical prostatectomy specimens. Urol Oncol. 2004; 22:300–6.

13. Tewari A, Horninger W, Pelzer AE, Demers R, Crawford ED, Gamito EJ, et al. Factors contributing to the racial differences in prostate cancer mortality. BJU Int. 2005; 96:1247–52.

14. Song C, Kang T, Ro JY, Lee MS, Kim CS, Ahn H. Nomograms for the prediction of pathologic stage of clinically localized prostate cancer in Korean men. J Korean Med Sci. 2005; 20:262–6.

15. Song C, Ro JY, Lee MS, Hong SJ, Chung BH, Choi HY, et al. Prostate cancer in Korean men exhibits poor differentiation and is adversely related to prognosis after radical prostatectomy. Urology. 2006; 68:820–4.

16. Okihara K, Nakanishi H, Nakamura T, Mizutani Y, Kawauchi A, Miki T. Clinical characteristics of prostate cancer in Japanese men in the eras before and after serum prostate-specific antigen testing. Int J Urol. 2005; 12:662–7.

17. Nakata S, Ohtake N, Kubota Y, Ito K, Suzuki K, Yamanaka H, et al. Chronological changes of incidence rates, clinical stages and pathological differentiation of prostate cancer in Gunma Prefecture, Japan. Hinyokika Kiyo. 2004; 50:165–70.
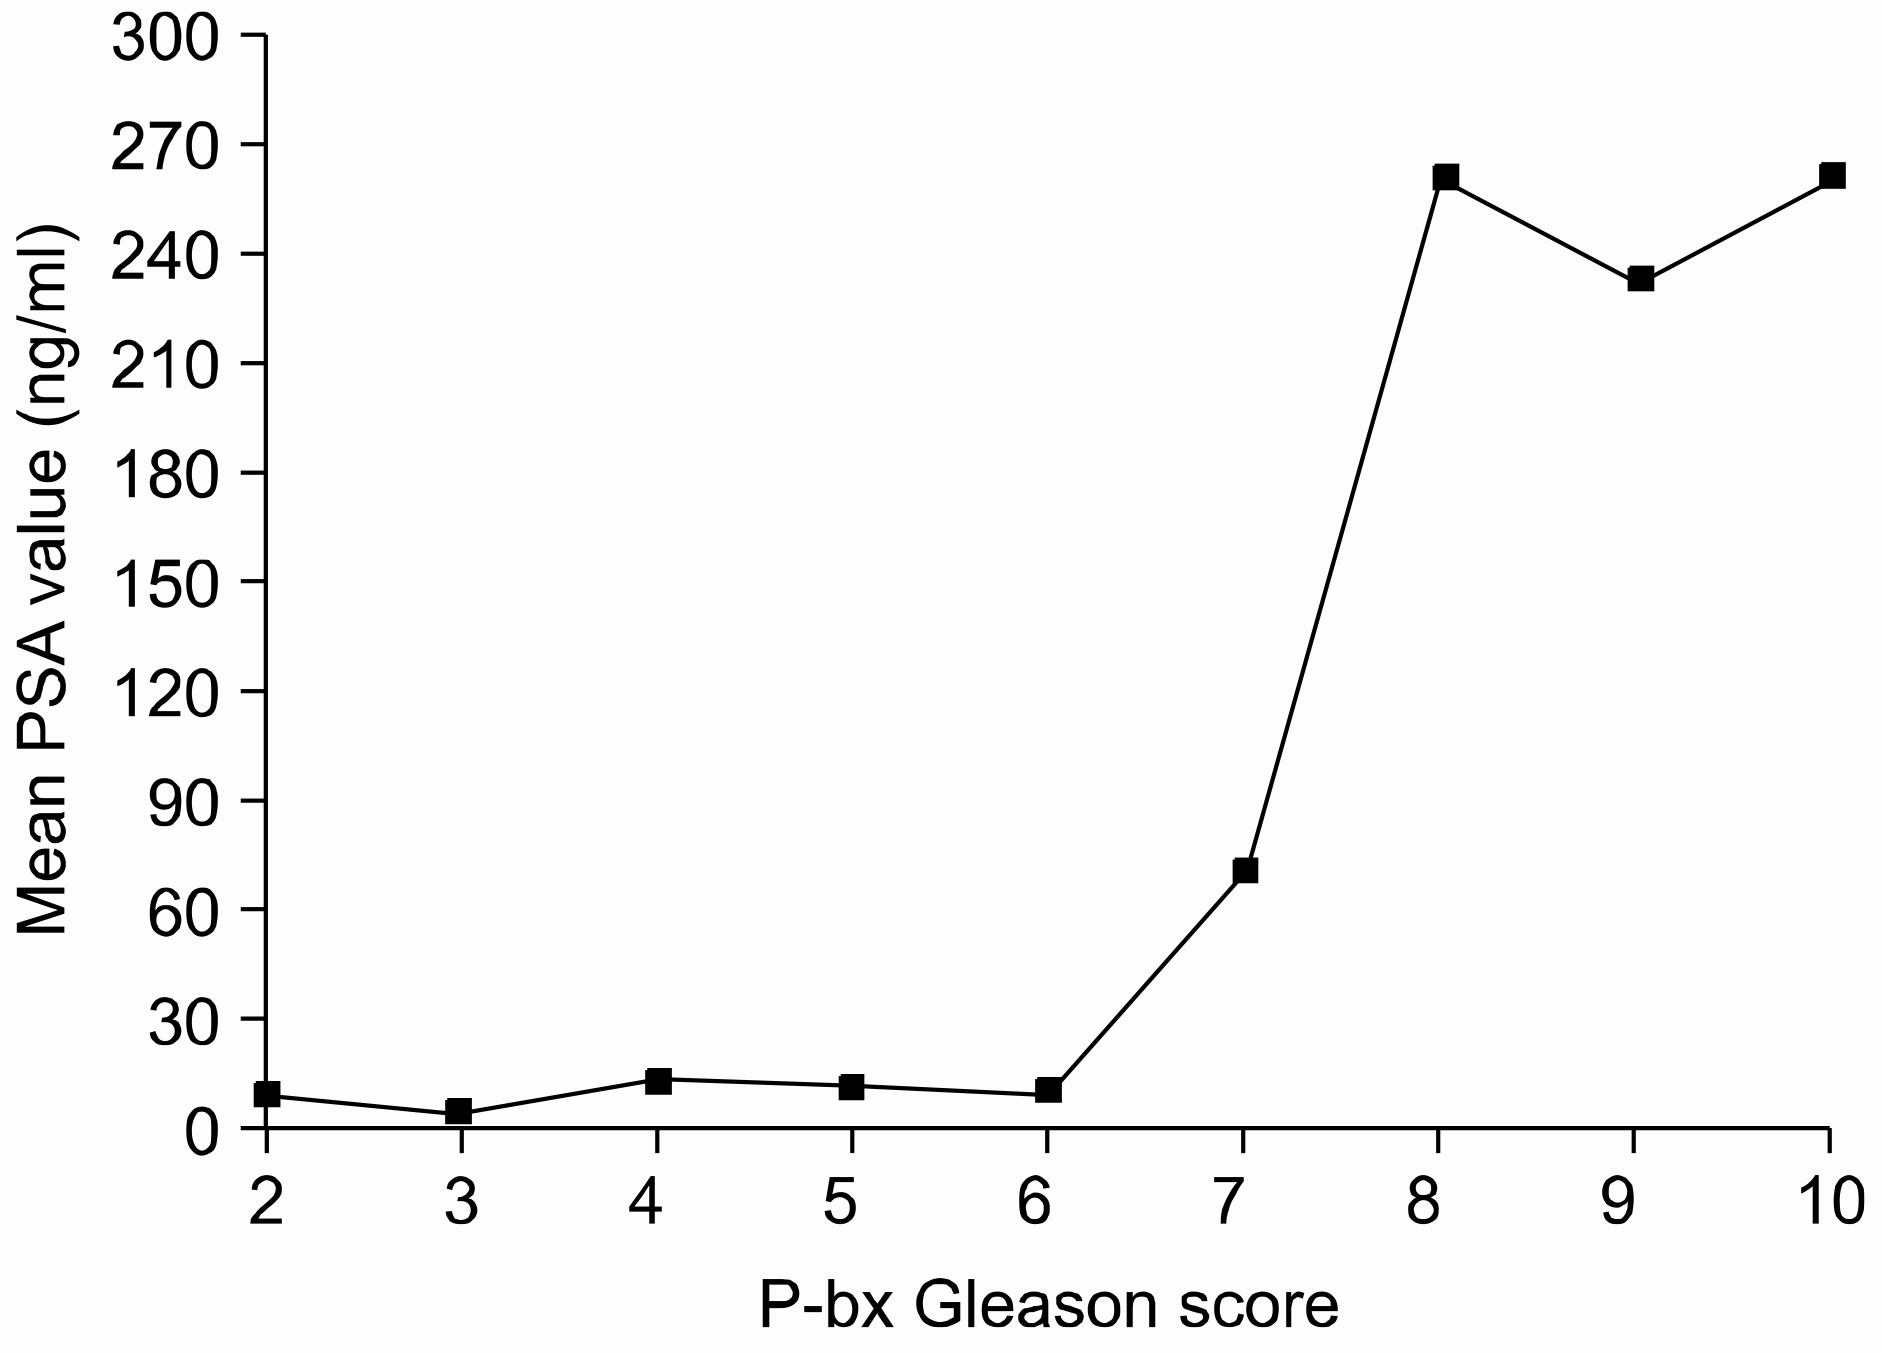
Fig. 2.
Correlation between serum the prostate-specific antigen (PSA) level and the prostate biopsy Gleason score.

Table 1.
The clinical and histological changes according to the diagnostic period
| 1997–2000 | 2001–2003 | 2004–2006 | 1997–2006 | p-value | |
|---|---|---|---|---|---|
| No. of cases (%) | 125 (16.5) | 291 (38.4) | 342 (45.1) | 758 (100.0) | |
| Age (years) | |||||
| Mean | 68.8 | 69.3 | 68.0 | 68.6 | 0.15∗ |
| Median | 69.0 | 70.0 | 68.0 | 69.0 | |
| Clinical stage (%) | |||||
| Localized | 71 (56.8) | 182 (62.5) | 258 (75.4) | 511 (67.4) | |
| Locally advanced | 6 (4.8) | 37 (12.7) | 31 (9.1) | 74 (9.8) | <0.001† |
| Metastatic | 48 (38.4) | 72 (24.7) | 53 (15.5) | 173 (22.8) | |
| Serum PSA level (ng/ml) | |||||
| Mean | 352.3 | 105.1 | 96.8 | 142.1 | |
| Median | 34.5 | 16.6 | 10.8 | 14.8 | <0.001∗ |
| 10 or less | 24 (19.2) | 97 (33.3) | 163 (47.7) | 284 (37.5) | |
| 10.1–20 | 28 (22.4) | 59 (20.3) | 67 (19.6) | 154 (20.3) | <0.001† |
| Greater than 20 | 73 (58.4) | 135 (46.4) | 112 (32.7) | 320 (42.2) | |
| Biopsy gleason score (%) | |||||
| 2–6 | 15 (12.0) | 52 (17.9) | 110 (32.2) | 177 (23.4) | |
| 7 | 21 (16.8) | 93 (32.0) | 101 (29.5) | 215 (28.4) | <0.001† |
| 8–10 | 89 (71.2) | 146 (50.2) | 131 (38.3) | 366 (48.3) |
Table 2.
The clinical and histological changes of clinically localized prostate cancer
| 1997–2000 | 2001–2003 | 2004–2006 | 1997–2006 | p-value | |
|---|---|---|---|---|---|
| No. of cases (%) | 71 (13.9) | 182 (35.8) | 256 (50.3) | 509 (100.0) | |
| Age (years) | |||||
| Mean | 68.4 | 69.0 | 67.0 | 67.9 | 0.035∗ |
| Median | 69.0 | 69.5 | 67.0 | 68.0 | |
| Serum PSA level (ng/ml) | |||||
| Mean | 31.5 | 20.2 | 20.0 | 21.7 | |
| Median | 13.6 | 11.5 | 8.8 | 10.3 | 0.381∗ |
| Biopsy gleason score (%) | |||||
| 2–6 | 13 (18.3) | 45 (24.7) | 100 (39.1) | 158 (31.0) | |
| 7 | 15 (21.1) | 79 (43.4) | 84 (32.8) | 178 (35.0) | <0.001† |
| 8–10 | 43 (60.6) | 58 (31.9) | 72 (28.1) | 173 (34.0) |


 PDF
PDF ePub
ePub Citation
 Print
Print


 XML Download