

 PDF
PDF ePub
ePub Citation
 Print
Print


INTRODUCTION
Cough or Valsalva leak point pressure (LPP) is an important objective tool that is routinely used to diagnose stress urinary incontinence (SUI) in the urodynamic clinic. However, these urodynamic techniques still have several major shortcomings with regard to the sensitivity, specificity, and reproducibility of those values in predicting intrinsic sphincter deficiency or incontinence severity [1-4]. Several technical factors may influence the performance of the cough or Valsalva LPP test, including differences in catheter size, bladder volume at the time of determining LPP, and patient position [1,5-8]. When such measurements are performed in a standardized fashion, they seem to be highly reproducible [1,9]. However, considerably various results have also been reported with these measurements [1,7,8,10,11], and the reasons for this variability have not been completely elucidated. The pressure changes during provocations last only a very short time, and even a short delay in detecting urinary leakage can result in a large difference between assessed and actual LPP. However, urodynamic detection of the starting moment of leakage by means of the conventional visualization method does not seem to have been explored as a cause of this variability.
Videourodynamic study is known as the gold standard for determining stress LPP. Its distinctive feature is the use of synchronized video images with pressure curves to detect urinary leakage [7,9,12,13]. However, it is not enough to recognize the exact instant of urinary leakage with only these video images, because the leaking radio-opaque urine through the narrow urethra is sometimes not discernable in the video image. Thus, when we determine stress LPP by videourodynamics, we additionally check the urethral pressure by using the urethral channel of a 7 Fr triple-lumen catheter. With urethral pressure curves shown retrospectively on the enlarged time scale, we can pinpoint the very moment of urinary leakage, which causes abruptly elevated urethral pressure just before the peak of intravesical pressure (IVP).
Valsalva LPP of less than 60 and of less than 90 cmH2O, as determined by visualization, have been noted by some authors to indicate the presence of some degree of intrinsic sphincter deficiency (ISD) or urethral hypermobility, respectively [9,14], and have been used as cutoff values in the diagnosis of SUI. Thus, it would be clinically relevant to know how much the stress LPP determined by use of the urethral channel differs from that determined conventionally by visualization. Such information could help us to assess the accuracy of the previous diagnostic criteria.
The primary aim of this study was therefore to measure and compare the actual time from the start to the end of provocation with the marking of leakage after visualization. The secondary aim was to assess the accuracy of direct visualization methods of urinary leakage detection and to compare those with the urethral channel method to determine cough and Valsalva LPP in the supine and erect positions in women with SUI. Additionally, we observed the accuracy of the LPP checked by direct visualization, classified by the current cutoffs of 60 or 90 cmH2O indicating ISD or urethral hypermobility, respectively, by comparison with the results of the urethral channel method.
MATERIALS AND METHODS
We reviewed data collected on 156 consecutive patients who presented to our clinic with complaints of SUI and who underwent videourodynamic studies with cough and Valsalva LPP measurements between March 2003 and February 2005. Institutional review board approval was obtained for this study. All patients underwent comprehensive assessment including past history, physical examination, and multichannel urodynamic evaluation according to the standards of the International Continence Society [15]. They were excluded if they had a diagnosis of neurogenic disease, if they had severe urogenital prolapse (Pelvic Organ Prolapse Quantification stages 2-4 were excluded) [16], if there was evidence of detrusor overactivity on filling cystometry, or if any data on LPP measured by use of the urethral channel or visualization methods were missing.
A Menuet Compact (Dantec, Denmark) urodynamic device was used. A three-channel, fluid-filled 7 Fr urethral cystometry catheter with two holes at the tip and a third side-hole at the proximal portion was used. First cough and then Valsalva-induced stress tests were performed with the patient in the supine and then 80° erect position on a urodynamic table. For every LPP measurement, the dual methods of urethral channel measurement and visualization were used to detect urinary leakage after the bladder was filled to a volume of 200 or 250 ml. Each measurement by both methods was repeated two or three times, and the lowest value was selected for analysis.
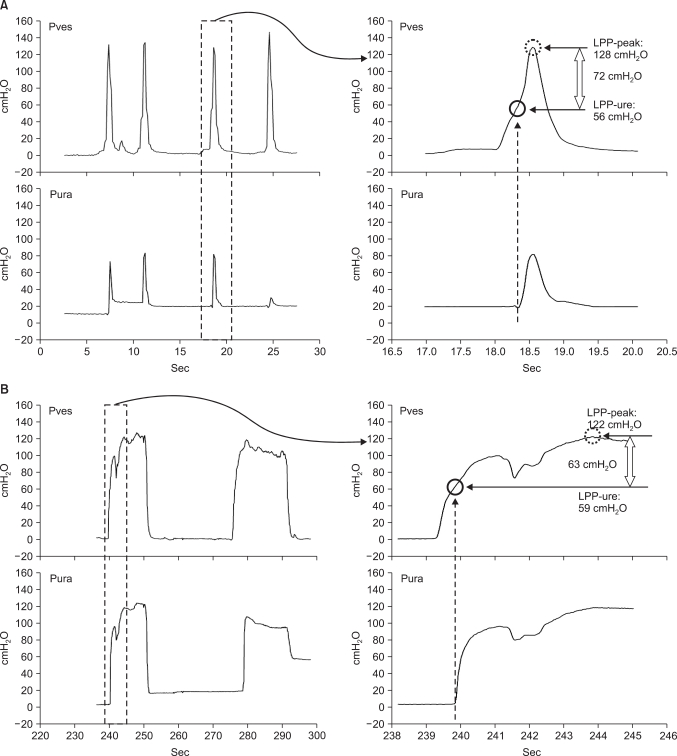
Under the enlarged time scale on the urodynamic screen, which was enlarged to 0.5 sec/cm on cough or 1 sec/cm on Valsalva, LPP-ure was defined as the simultaneous intravesical pressure at that moment at which the urethral pressure was abruptly elevated by the pressure delivered through the urethral channel (Fig. 1). We measured the time during which IVP was elevated during cough provocations (cough time), and the time from baseline to the top of IVP during Valsalva provocations (Valsalva time). We also measured the actual time from the start of provocations to the activated event marker on the screen of the urodynamic machinery, which we refer to as marker time, although we tried to activate the event marker at the precise moment during the procedures.
Because LPP-ure and LPP-vis resulted from different events of provocations, there could be an inherent source of error in direct comparison between the two measurements. Thus, to ensure appropriate comparison of the two values, we needed to check one more value for peak pressure of the spike for the provocation on which the LPP-ure was measured. We refer to this value as peak leak point pressure (LPP-peak) (Fig. 1). If the peak pressure proved to correspond statistically to the value checked by visualization on the next spike, we could investigate the accuracy of the previous diagnostic criteria by assessing the difference between the LPP-ure and the LPP-peak (representing the LPP-vis) from the same spike, after the peak values were categorized by the previous cutoffs of 60 or 90 cmH2O [9].
Descriptive statistics that included mean plus or minus standard deviation of the mean were used to characterize the LPP values measured by the different methods. Statistical analysis was performed by using two-tailed, paired t-tests for comparison between marker time and cough or Valsalva time, between the stress LPP-ure and LPP-peak or LPP-vis, and between the LPP-peak and LPP-vis in the same patient. Agreements between LPP-ure and LPP-peak from the same spike were analyzed by graphical interpretation by using box-plots and the weighted kappa statistics for categorical data of LPP-peak classified by the cutoff values with the aid of a computer software program (SPSS 17.00, SPSS, Chicago, IL, USA). We considered a kappa value of greater than 0.80 to represent excellent agreement and values of 0.61-0.80, 0.41-0.60, 0.21-0.40, and less than 0.21 to represent substantial, moderate, fair, and slight agreement, respectively [17].
RESULTS
A total of 52 patients (mean age, 46.5±10.9 years; range, 28-82 years) were eligible for this study. There were no significant differences between cough (0.96±0.24 s) and Valsalva (0.99±0.50 s) times. However, the marker time for cough or Valsalva provocation (3.90±1.28 or 4.12±1.40 s, respectively) was significantly longer than the respective cough and Valsalva times. This suggested that the marking of urinary leakage on the urodynamic machine by visualization was performed after the actual pressure changes caused by the provocation had finished.
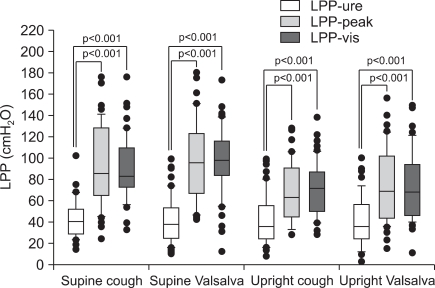
During cough provocation in the supine and erect positions, respectively, the LPP-ure values (42.1±18.7 and 42.1±21.8) were significantly lower than the LPP-peak (93.1±36.6 and 98.5±37.7) and LPP-vis (89.9±29.4 and 97.4±30.4; p<0.001 for both) values. The LPP-peak values were not significantly different from the LPP-vis values in the supine and erect positions (p=0.447 and p=0.760, respectively) (Fig. 2). The percentage of LPP-ure to LPP-peak or LPP-vis was 44.4±19.7% and 49.3±20.6%, respectively.
During Valsalva provocation in the supine and erect positions, respectively, the LPP-ure values (42.2±23.3 and 41.0±22.6) were significantly lower than the LPP-peak (68.0±27.9 and 71.1±33.4) and the LPP-vis (70.6±25.2 and 74.4±32.6) values (p<0.001 for both). The LPP-peak values were not significantly different from the LPP-vis values in the supine and erect positions (p=0.293 and p=0.888) (Fig. 2). The percentage of LPP-ure to LPP-peak or LPP-vis was 60.9±29.1% and 63.6±22.9%, respectively. This suggested that the values determined by visualization may contain false pressure estimates in the measurement of LPP.
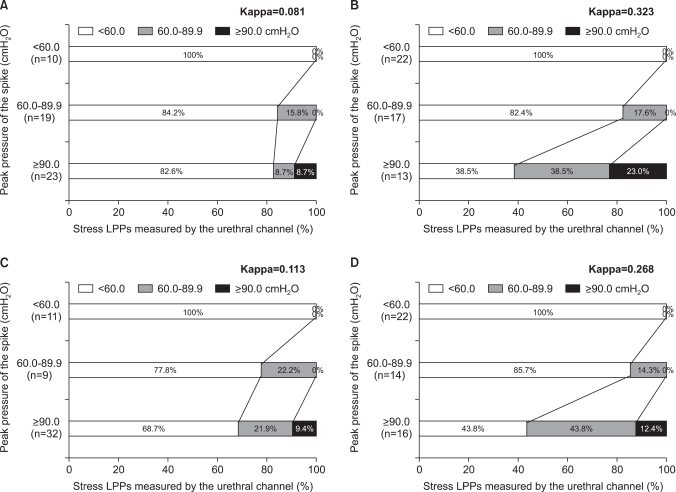
All LPP-peak values of less than 60 cmH2O proved to be less than 60 cmH2O by LPP-ure with both cough and Valsalva provocations in both positions. By contrast, only a small proportion (15.8%, 17.6%, 22.2%, and 14.3% for cough in supine, Valsalva in supine, cough in upright, and Valsalva in upright, respectively) of LPP-peak values of 60 to 90 cmH2O were shown to be 60 to 90 cmH2O by LPP-ure; the greater proportion (84.2%, 82.4%, 77.8%, and 85.7%, respectively) were less than 60 cmH2O by LPP-ure. In addition, only a small proportion (8.7%, 23.0%, 9.4%, and 12.4%, respectively) of LPP-peak values higher than 90 cmH2O were shown to be higher than 90 cmH2O by LPP-ure; the greater proportion (82.6%, 38.5%, 68.7%, and 43.8%, respectively) were shown to be less than 60 cmH2O by LPP-ure (Fig. 3).
The weighted kappa statistics between LPP-ure and LPP-peak showed fair agreement for supine Valsalva (0.323) and upright Valsalva (0.268) and slight agreement for supine cough (0.081) and upright cough (0.113). This result suggested that the visual detection method was not an accurate method on the whole and that the Valsalva maneuver tended to have better accuracy than the cough maneuver.
DISCUSSION
Stress LPP is a urodynamic measure of the intra-abdominal pressure or IVP at which leakage starts during a sudden or sustained increase in intra-abdominal pressure caused by a cough or Valsalva maneuver [18]. This value is believed to provide information about the presence of ISD and is used to predict surgical outcome in women with SUI [8,9,19]. However, standardized methodology is lacking [1,2,7,11], especially for urinary leakage detection, which makes it difficult to compare the reports on LPP data from different facilities in the evaluation and treatment of women with SUI.
Since 1993 when McGuire et al introduced the concept of Valsalva LPP in women with SUI, using videourodynamic study as the urinary detection method [9,20], many authors have proposed several modifications of the method, including the use of a flowmeter, electronic detection with a microtip catheter, and visualization with or without stepwise increases in abdominal pressure [1,14,21-24]. However, there seems to be significant disparity in values measured by these techniques of detecting the start of urinary leakage, even among values from one patient. A flowmeter may detect the leakage later than the microtip transducer of a catheter in the urethra, because the leaked urine should arrive at the rotating disk of the flowmeter outside the urethra. Visual observation of the external urethral meatus to detect leakage on provocation can sometimes be confused by drops of urine around the urethral catheter during the successive provocations. Especially for cough LPP, some patients cannot increase or decrease the abdominal pressure step by step appropriately, which is explained by the previous observation that approximately 30% of women are unable to perform an isolated pelvic floor contraction following written or verbal instruction for biofeedback therapy [25]. Furthermore, despite these scientific approaches, some clinical reports on the diagnosis and treatment of SUI, using stress LPP, still use visualization as the only method of detecting urinary leakage [26-28].
Our results showed that the changes in IVP during cough or Valsalva provocation usually lasted only about 1 s and that the real leakage happened during the increase in IVP before the pressure peaked. This was proved by the result showing that the LPPs determined by the urethral channel method were significantly lower than the values determined by visualization with both provocations and in both patient positions. When we perform a urodynamic study to check the LPPs, we cannot determine the LPP during the procedure, because the next steps must be continued. Thus, the marking of the leakage to the urodynamic machine is important in order to obtain values after the procedure. However, even with Valsalva provocation, our results suggested that the marking was done after the short pressure changes had already finished, although the examiner tried to let the patient stop to strain further and to mark as soon as possible after identifying the leakage around the external urethral meatus. Thus, when the examiner determined the LPP retrospectively after the procedure had finished, the summit of the spike could not help but be selected as the stress LPP, which could be a major source of the variation in LPP data and patterns in previous studies.
Selected cutoff values of Valsalva LPP have been used worldwide for the diagnosis and determination of treatment methods in SUI on the basis of McGuire et al's results showing that a Valsalva LPP of less than 60 cmH2O indicates the presence of significant ISD, a Valsalva LPP of 60 to 90 cmH2O suggests a combination of urethral hypermobility and some component of ISD, and one higher than 90 cmH2O suggests urethral hypermobility and minimal ISD [9]. However, our results showed that a significant proportion of conventional Valsalva LPPs of 60 to 90 and higher than 90 cmH2O by visualization corresponded with values less than 60 cmH2O by the urethral channel. In other words, a significant portion of patients who were regarded as having combinations of hypermobility and less of a component of ISD according to the conventional visualization method had a major ISD component in reality. This discrepancy between the LPP checked by visualization and that measured by the urethral channel could have caused some of the previous controversy in the diagnosis and treatment of SUI.
This study is limited by the small number of cases and its retrospective design, which might be unacceptable by the standards of modern medical research. However, the reason for the small number of cases is that our method of LPP measurement by the urethral channel does have some specific technical limitations; as a result, only 52 cases could be completed as a final data set among 156 cases over 2 years. To measure LPP by our method, the side hole of the catheter must be located accurately in the same position of the hypermobile urethra in erect patients with bladder neck hypermobility, and is liable to be moved into the bladder or out of the urethra during provocation, which results in false measurements. To overcome this problem, one examiner carefully controlled the position of the urethral port in the video images by use of a radiologic marker, which was sometimes very difficult. Furthermore, our technique, which uses side holes to measure urethral pressure, is liable to show an artifact dependent on the orientation of the side hole [2]. This could sometimes be circumvented by spinning the catheter to change the direction of the hole to a lateral one. Despite these defects, we think that our study provides essentially important results for solving the pitfalls of LPP measurements. Our results emphasize the need to standardize the methodologies used for urinary leakage detection and should stimulate achieving a new, better technology for this.
CONCLUSIONS
The cough and Valsalva provocations last for only a very short time. Thus, the use of visualization as the method of urinary detection entails potential errors that cannot be adjusted for on that time scale. Standardization of the urinary leakage detection method used in women with SUI is warranted because this measurement is closely related to the accuracy of measurement of LPP.
 XML Download