

 PDF
PDF ePub
ePub Citation
 Print
Print


Abstract
With globalization, international exchange has increased. Accordingly, the necessity for individual identification using genetic polymorphism has also increased. Paternal lineages are distributed differently, and different distribution patterns can be used to predict ancestry. We studied the distribution pattern of different paternal lineages in Korea and compared them with other populations.
All 30 SNPs on the Y chromosome were selected for paternal lineage confirmation. Loci that could subclassify haplogroup O, the most frequent in the East Asian population, were added. After multiplex amplification for the target loci, SBE reactions were set up for each SNP site. One hundred Korean men as well as 60 Chinese, 60 Japanese, 19 African-American, 48 Caucasian, and 47 Mexican American were tested and compared. Five Y haplogroups [C (C3), D (D2), NO, O, Q (Q1a1)] were found in Koreans, with haplogroup O being the most frequent. Haplogroup O sub-classified into O* (24%), O1 (6%), O2b (39%), O3a3c (4%), O3a3c1 (13%), and O3a3b(1%). This distribution pattern was similar to that of Chinese or Japanese, but minor differences were noted. With Fst, the Korean and Japanese patterns were close (0.01757) when using 6 SNPs. There were significant differences between Koreans and African Americans, Caucasians and Mexican Americans, and they were easily discernible without requiring haplogroup O sub-classification.
Sub-classification of haplogroup O is likely to be useful for East Asia group comparisons. Additional studies in populations from different areas of China or Japan or studies of mtDNA or autosomes may enhance the discrimatory power of genetic polymorphism in different Asian populations.
Figures and Tables
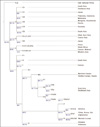 | Fig. 1Selected 30 Y-SNPs with phylogenic tree used in this study for Y-haplogrouping. Several SNPs were selected to sub-classify haplogroup O.
|
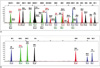 | Fig. 2Electropherograms of SBE reaction of two sets. (a). SBE-A set show five markers with derived state - M168, M89, M9. M214, M175. (b). SBE-B set show one marker with derived state - M176. The SNPs M168, M89, M9. M214, M175, M176 show the derived state, which leads to the assignement of the sample to haplogroup O2b with the final marker M176.
|
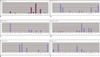 | Fig. 3Comparison of our Koreans data with that of previously reported for other populations. Other population data were from published studies. Korean have different haplogroup distribution especially in sub-haplogroup C, D, O from Central Asia(D*), Northeast Asia(C3, O2b) and Oceania population(C*, C2, K*).
a: our data b, c, d, e, f: previously reported data.
|
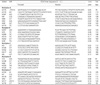
Table 1
Primer Sequences for Amplification of Each 30 Y-SNPs. The Amplification was Done Through 5 Separate Multiplex System
![]()
Table 2
SBE Primers for Genotyping Each SNP. Genotyping was Done Through Two Separate SBE Reactions, One for Macro-haplogrouping and the Other for O Sub-haplogrouping
![]()
Table 3
Observed Haplogroup Frequency in Each Population without Sub-classification of Haplogroup O. Haplogroups Observed in Korean were not the Same with that of with African-American, Caucasian and Mexican-American

![]()
Table 4
Different Sub-haplogrouping for Haplogroup O in Three Northeast Asia Populations. In Korean, Sub-haplogroup O*, O2b and O3a3c1 are the Major Sub-haplogroups (Unit : %)

![]()

Table 6
Fst was Calculated Through 6 Y-SNPs Using AMOVA. 6 Y-SNPs were M119, M95, M176, M134, M117, M7. Korean was More Closer to Japanese than to Chinese

![]()

Acknowledgments
We are grateful to National Biobank of Korea for providing DNA samples. Two anonymous reviewers are acknowledged for their helpful comments on the manuscript.
References
1. Lim JT. Fundamental research for foreign crime countermeasure. 2010. 08. IOM Migration Research & Training Centre Working Paper.
2. Grimes EA, Noake PJ, Dixon L, Urquhart A. Sequence polymorphism in the human melanocortin 1 receptor gene as an indicator of the red hair phenotype. Forensic Sci Int. 2001. 122:124–129.
3. Walsh S, Liu F, Ballantyne KN, van Oven M, Lao O, Kayser M. IrisPlex: a sensitive DNA tool for accurate prediction of blue and brown eye colour in the absence of ancestry information. Forensic Sci Int Genet. 2011. 5:170–180.
4. Walsh S, Lindenbergh A, Zuniga SB, et al. Developmental validation of the IrisPlex system: determination of blue and brown iris colour for forensic intelligence. Forensic Sci Int Genet. 2011. 5:464–471.
5. Walsh S, Wollstein A, Liu F, et al. DNA-based eye colour prediction across Europe with the IrisPlex system. Forensic Sci Int Genet. 2012. 6:330–340.
6. Nassir R, Kosoy R, Tian C, et al. An ancestry informative marker set for determining continental origin: validation and extension using human genome diversity panels. Bmc Genet. 2009. 10:39.
7. Londin ER, Keller MA, Maista C, et al. CoAIMs: A Cost-Effective Panel of Ancestry Informative Markers for Determining Continental Origins. Plos One. 2010. 5:e13443.
8. Phillips C, Salas A, Sanchez JJ, et al. Inferring ancestral origin using a single multiplex assay of ancestry-informative marker SNPs. Forensic Sci Int Genet. 2007. 1:273–280.
9. Butler JM. Forensic DNA typing. Biology, technology and genetics of STR markers. 2005. 2nd ed. Burlington: Elsevier Academic Press.
10. Butler J, Coble M, Vallone P. STRs vs. SNPs: thoughts on the future of forensic DNA testing. Forensic Sci Med Pathol. 2007. 3:200–205.
11. Kim SH, Han MS, Kim W, Kim W. Y chromosome homogeneity in the Korean population. Int J Legal Med. 2010. 124:653–657.
12. Shi M, Hou Y, Yan J, Bai R, Yu X. 6 Y-SNP Typing of China and Korean Samples Using Primer Extension and DHPLC. J Forensic Sci. 2007. 52:235–236.
13. Sanchez JJ, Borsting C, Hallenberg C, Buchard A, Hernandez A, Morling N. Multiplex PCR and minisequencing of SNPs--a model with 35 Y chromosome SNPs. Forensic Sci Int. 2003. 137:74–84.
14. Henegariu O, Heerema NA, Dlouhy SR, Vance GH, Vogt PH. Multiplex PCR: critical parameters and step-by-step protocol. Biotechniques. 1997. 23:504–511.
15. Markoulatos P, Siafakas N, Moncany M. Multiplex polymerase chain reaction: a practical approach. J Clin Lab Anal. 2002. 16:47–51.
16. Kim SH, Kim NY, Hong SB, et al. Genetic polymorphisms of 16 Y chromosomal STR loci in Korean population. Forensic Sci Int Genet. 2008. 2:e9–e10.
17. Hashiyada M, Umetsu K, Yuasa I, et al. Population genetics of 17 Y-chromosomal STR loci in Japanese. Forensic Sci Int Genet. 2008. 2:e69–e70.
18. Yan J, Tang H, Liu Y, et al. Genetic polymorphisms of 17 Y-STRs haplotypes in Chinese Han population residing in Shandong province of China. Legal Med. 2007. 9:196–202.
19. Bender K. SNaPshot for pharmacogenetics by minisequencing. Methods Mol Biol. 2005. 297:243–252.
20. Phillips C, Fang R, Ballard D, et al. Evaluation of the Genplex SNP typing system and a 49plex forensic marker panel. Forensic Sci Int Genet. 2007. 1:180–185.
21. Ahn HJ, Kim JJ, Han MS, Hur BK. Typing of Y-SNPs ina korean population using allele-specific hybridization. Korean J Forensic Sci. 2005. 1:15–19.
22. Jin HJ, Kwak KD, Hammer M, et al. Y-chromosomal DNA haplogroups and their implications for the dual origins of the Koreans. Hum Genet. 2003. 114:27–35.
23. Jota MS, Lacerda DR, Sandoval JR, et al. A new subhaplogroup of native American Y-Chromosomes from the Andes. Am J Phys Anthropol. 2011. 146:553–559.
24. Hammer MF, Karafet TM, Park H, et al. Dual origins of the Japanese: common ground for hunter-gatherer and farmer Y chromosomes. J Hum Genet. 2006. 51:47–58.
25. Tajima A, Hayami M, Tokunaga K, et al. Genetic origins of the Ainu inferred from combined DNA analyses of maternal and paternal lineages. J Hum Genet. 2004. 49:187–193.
26. Mizuno N, Kitayama T, Fujii K, et al. A forensic method for the simultaneous analysis of biallelic markers identifying Y chromosome haplogroups inferred as having originated in Asia and the Japanese archipelago. Forensic Sci Int Genet. 2010. 4:73–79.
27. Chae S-H, Kim J-M, Kim I-C, et al. Identification of novel allele on the locus 47z (DXYS5) in the Korean population. J Hum Genet. 2005. 50:664–666.
28. Shi H, Dong YL, Wen B, et al. Y-chromosome evidence of southern origin of the East Asian-specific haplogroup O3-M122. Am J Hum Genet. 2005. 77:408–419.
29. Abdulla MA, Ahmed I, Assawamakin A, et al. Mapping human genetic diversity in Asia. Science. 2009. 326:1541–1545.
30. Xue Y, Tyler-Smith C. The hare and the tortoise: one small step for four SNPs, one giant leap for SNP-kind. Forensic Sci Int Genet. 2010. 4:59–61.
 XML Download