Abstract
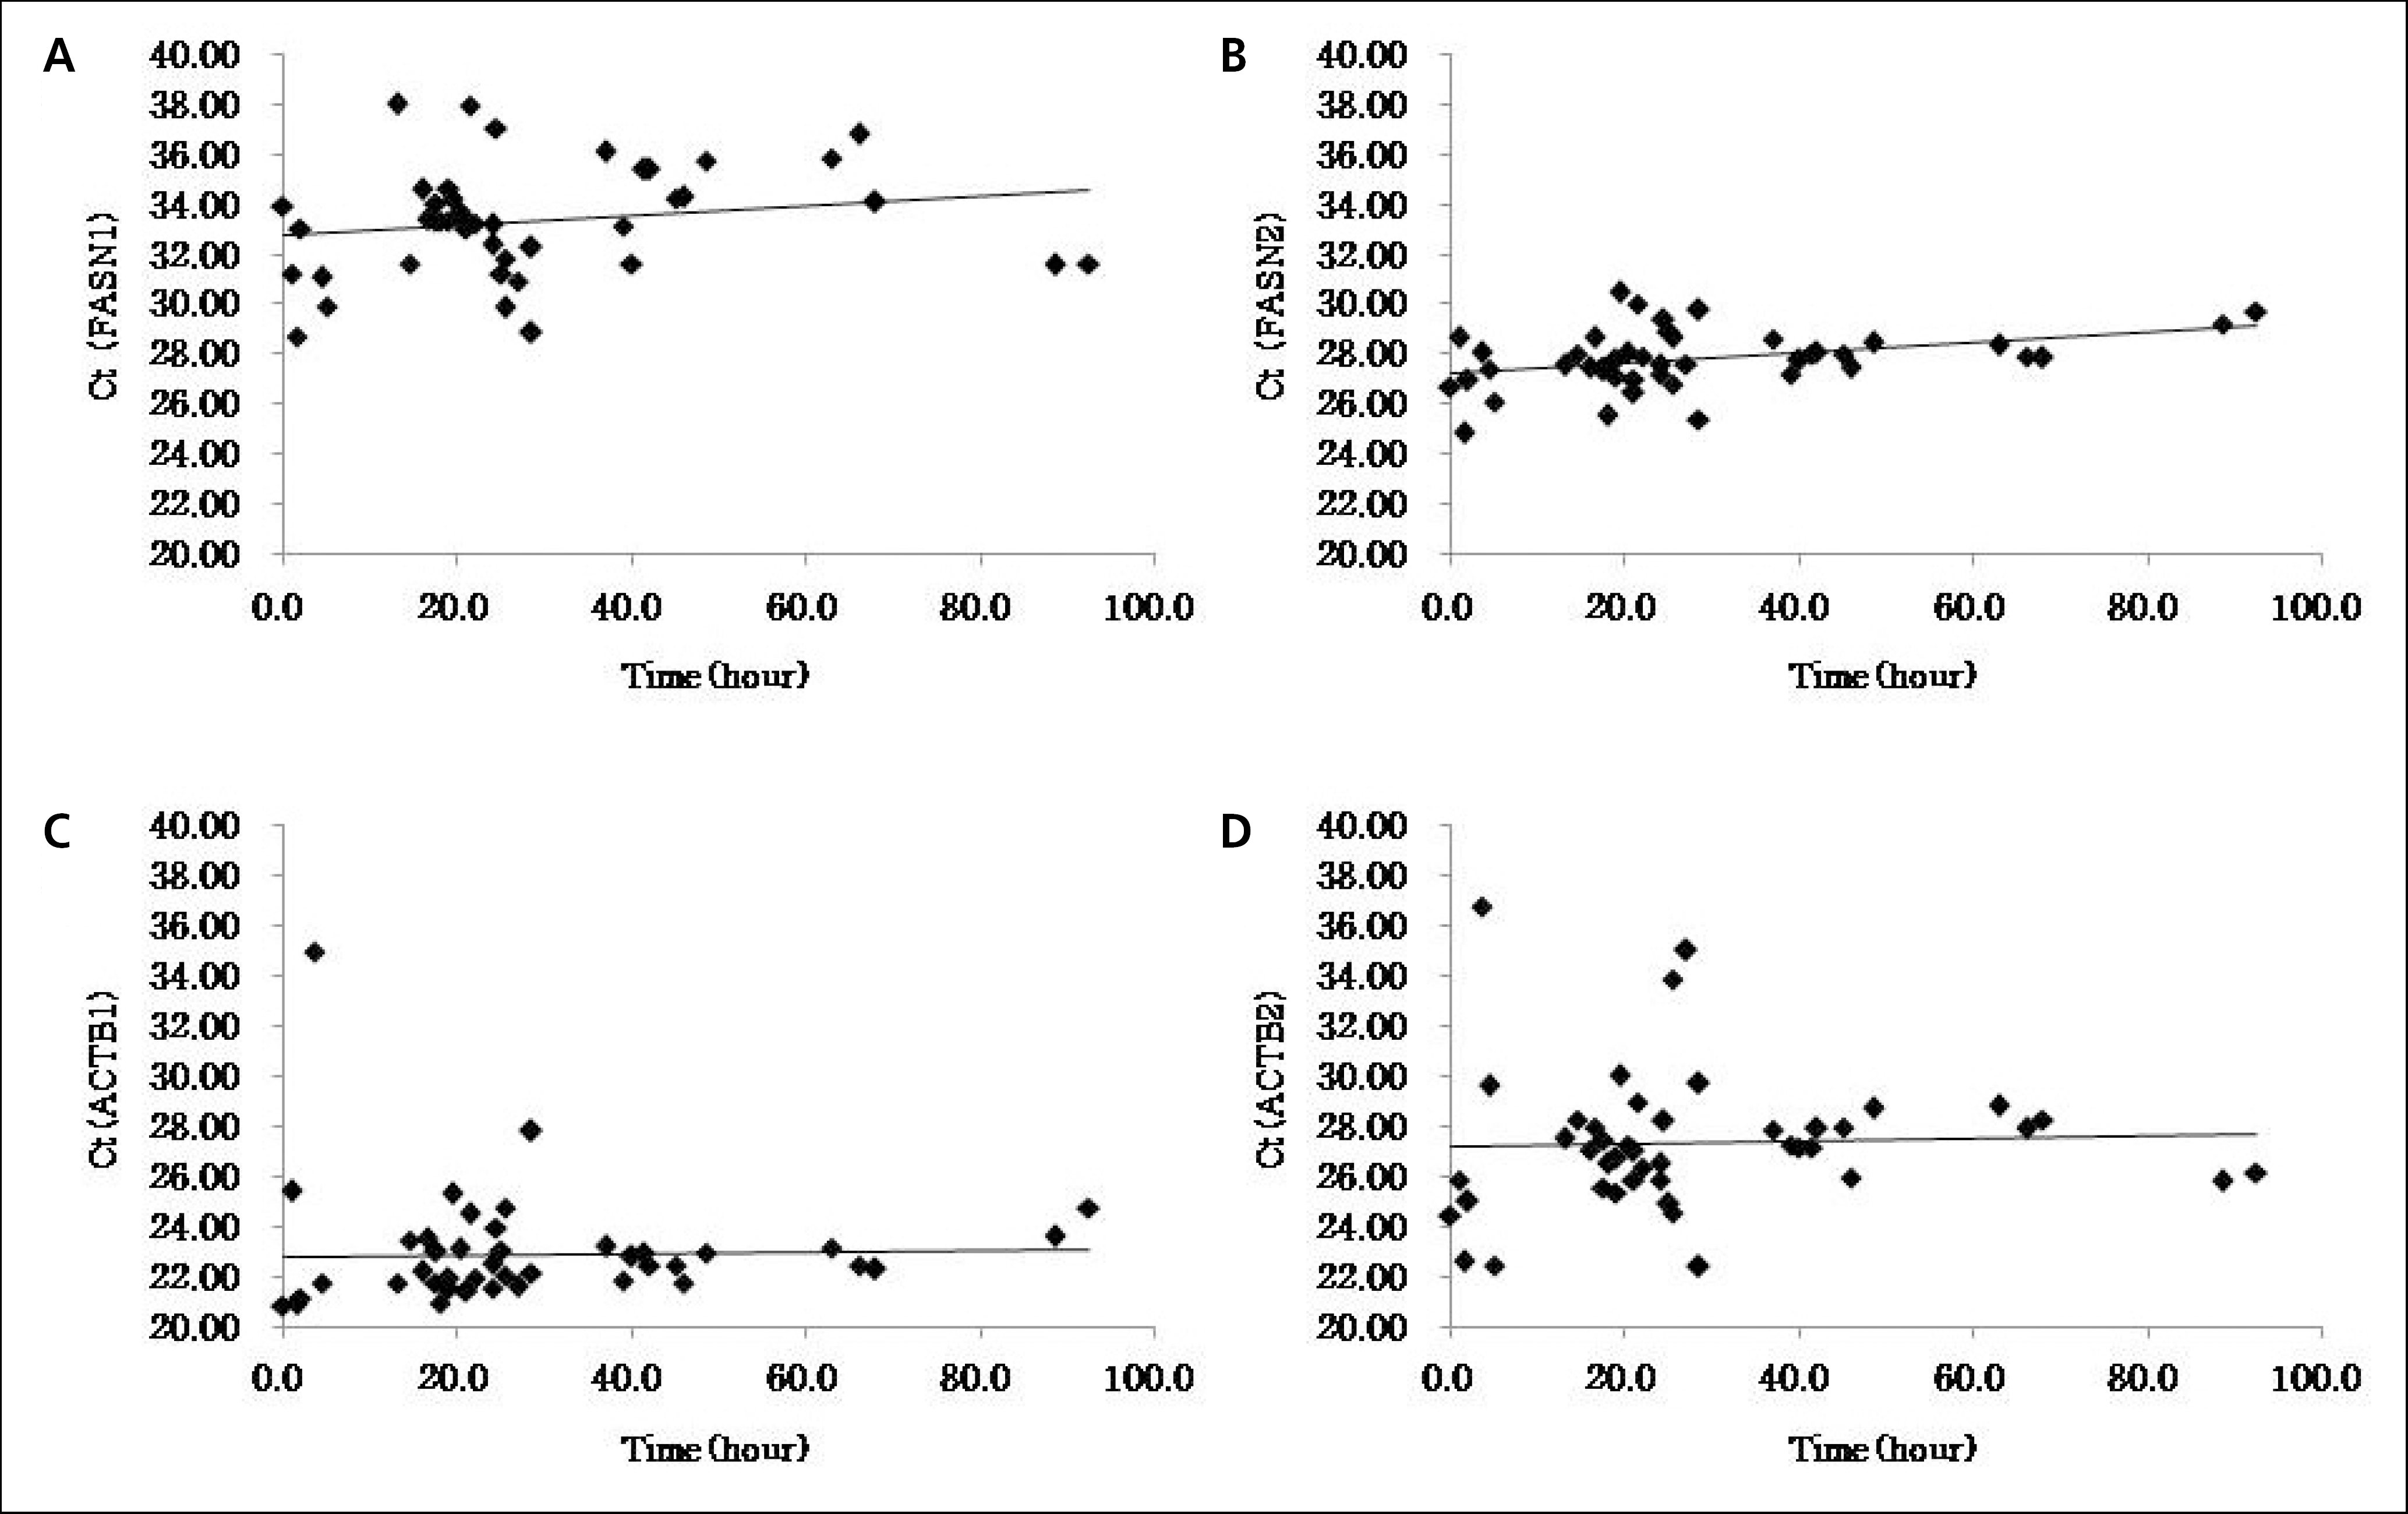
Ribonucleic acid (RNA) has potential use in forensic science for the determination of postmortem interval. We report the first study on serial sampling of messenger RNA (mRNA) from surgical specimens to determine if there is a correlation between mRNA quantity and elapsed time. Skin tissues were collected from modified radical mastectomy specimens. After a defined period of time, bisected skin sections were cut and frozen in liquid nitrogen. Serial collection of the specimens was conducted, and frozen sections were obtained from all samples. Quantitative real-time reverse transcription-polymerase chain reaction was performed using the extracted RNA to measure the transcriptional activity of 2 selected housekeeping genes. The selected loci were mRNA sequences that exhibited time-dependent quantitative changes in a previous study. We collected 44 samples from 9 different patients, with 3–10 samples collected per patient. The amount of mRNA transcripts present in the serial samples showed a weak time-dependent correlation trend only in some cases. Further studies to evaluate different target mRNA sequences are necessary, as is exploration of additional methods to evaluate mRNA transcript degradation.
Go to : 
References
2. Bauer M, Gramlich I, Polzin S, Patzelt D. Quantification of mRNA degradation as possible indicator of postmortem interval–a pilot study. Leg Med (Tokyo). 2003; 5:220–7.

3. Bauer M, Polzin S, Patzelt D. Quantification of RNA degradation by semiquantitative duplex and competitive RT-PCR: a possible indicator of the age of bloodstains? Forensic Sci Int. 2003; 138:94–103.

4. Heinrich M, Matt K, Lutz-Bonengel S, Schmidt U. Successful RNA extraction from various human postmortem tissues. Int J Legal Med. 2007; 121:136–42.

5. Harrison PJ, Heath PR, Eastwood SL, Burnet PW, McDonald B, Pearson RC. The relative importance of pre-mortem acidosis and postmortem interval for human brain gene expression studies: selective mRNA vulnerability and comparison with their encoded proteins. Neurosci Lett. 1995; 200:151–4.

6. Inoue H, Kimura A, Tuji T. Degradation profile of mRNA in a dead rat body: basic semi-quantification study. forensic Sci Int. 2002; 130:127–32.

7. Preece P, Cairns NJ. Quantifying mRNA in postmortem human brain: influence of gender, age at death, postmortem interval, brain pH, agonal state and inter-lobe mRNA variance. Brain Res Mol Brain Res. 2003; 118(1–2):60–71.

8. Barrachina M, Castano E, Ferrer I. TaqMan PCR assay in the control of RNA normalization in human postmortem brain tissue. Neurochem Int. 2006; 49:276–84.

9. Zhao D, Zhu BL, Ishikawa T, Quan L, Li DR, Maeda H. Real-time RT-PCR quantitative assays and postmortem degradation proles of erythropoietin, vascular endothelial growth factor and hypoxia-inducible factor 1 alpha mRNA transcripts in forensic autopsy materials. Leg Med (Tokyo). 2006; 8:132–6.
10. Heinrich M, Lutz-Bonengel S, Matt K, Schmidt U. Realtime PCR detection of five different “endogenous control gene” transcripts in forensic autopsy material. Forensic Sci Int Genet. 2007; 1:163–9.

11. Partemi S, Berne PM, Batlle M, et al. Analysis of mRNA from human heart tissue and putative applications in forensic molecular pathology. Forensic Sci Int. 2010; 203:99–105.

12. Castensson A, Emilsson L, Preece P, Jazin EE. High-resolution quantification of specific mRNA levels in human brain autopsies and biopsies. Genome Res. 2000; 10:1219–29.

13. Anderson S, Howard B, Hobbs GR, Bishop CP. A method for determining the age of a bloodstain. Forensic Sci Int. 2005; 148:37–45.

14. Yasojima K, McGeer EG, McGeer PL. High stability of mRNAs postmortem and protocols for their assessment by RT-PCR. Brain Res Brain Res Protoc. 2001; 8:212–8.

15. Ishida K, Zhu BL, Maeda H. A quantitative RT-PCR assay of surfactant-associated protein A1 and A2 mRNA transcripts as a diagnostic tool for acute asphyxial death. Leg Med (Tokyo). 2002; 4:7–12.

16. Trotter SA, Brill LB 2nd, Bennett JP Jr. Stability of gene expression in postmortem brain revealed by cDNA gene array analysis. Brain Res. 2002; 942:120–3.

17. Li JZ, Vawter MP, Walsh DM, et al. Systematic changes in gene expression in postmortem human brains associated with tissue pH and terminal medical conditions. Hum Mol Genet. 2004; 13:609–16.

18. Swift GH, Peyton MJ, MacDonald RJ. Assessment of RNA quality by semiquantitative RT-PCR of multiple regions of a long ubiquitous mRNA. Biotechniques. 2000; 28:: 524, 526, 528,. 530–1.

19. Udvardi MK, Czechowski T, Scheible WR. Eleven golden rules of quantitative RT-PCR. Plant Cell. 2008; 20:1736–7.

20. Hardy JA, Wester P, Winblad B, Gezelius C, Bring G, Eriksson A. The patients dying after long terminal phase have acidotic brains; implications for biochemical measurements on autopsy tissue. J Neural Transm. 1985; 61:253–64.

21. Madea B. Is there recent progress in the estimation of the postmortem interval by means of thanatochemistry? Forensic Sci Int. 2005; 151:139–49.

22. Cina SJ. Flow cytometric evaluation of DNA degradation: a predictor of postmortem interval? Am J Forensic Med Pathol. 1994; 15:300–2.
23. Di Nunno NR, Costantinides F, Bernasconi P, Bottin C, Melato M. Is flow cytometric evaluation of DNA degradation a reliable method to investigate the early postmortem period? Am J Forensic Med Pathol. 1998; 19:50–3.

24. Boy SC, Bernitz H, Van Heerden WF. Flow cytometric evaluation of postmortem pulp DNA degradation. Am J Forensic Med Pathol. 2003; 24:123–7.

25. Sharova LV, Sharov AA, Nedorezov T, Piao Y, Shaik N, Ko MS. Database for mRNA half-life of 19977 genes obtained by DNA microarray analysis of pluripotent and differentiating mouse embryonic stem cells. DNA Res. 2009; 16:45–58.
Go to : 
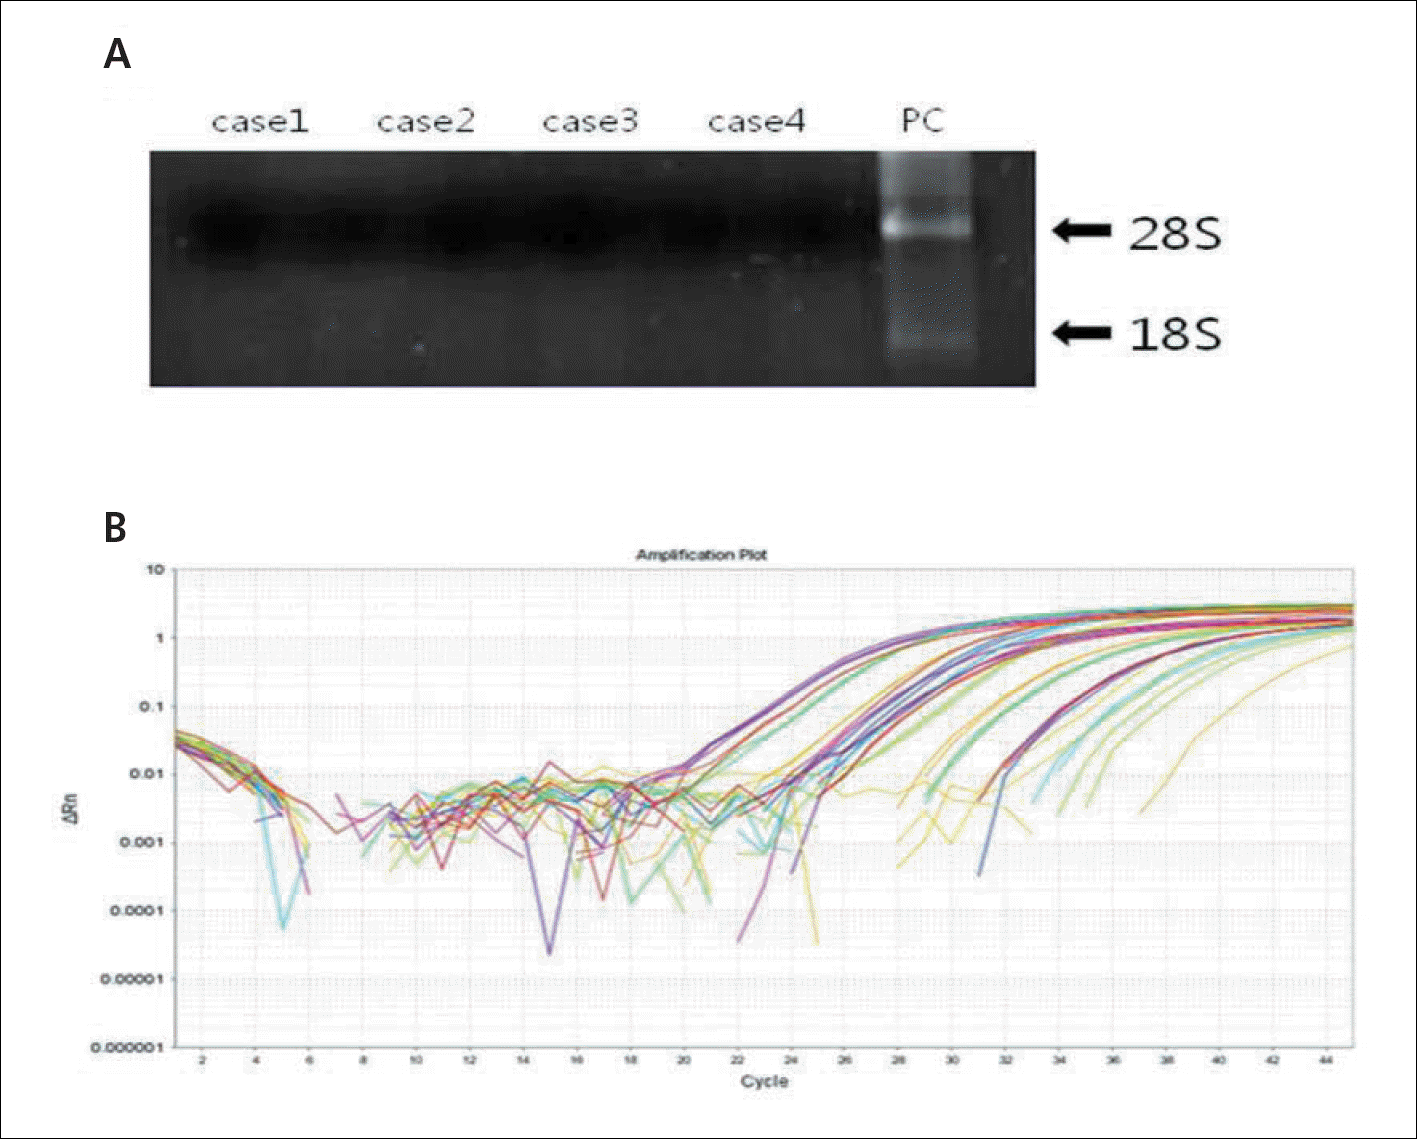 | Fig. 2.(A) This image shows a representative presentation of electrophoresis of extracted RNA compared to positive control (PC) with visible band for 18S (lower arrow) and 28S (upper arrow). (B) This plot shows the amplification of sequences in realtime PCR. |
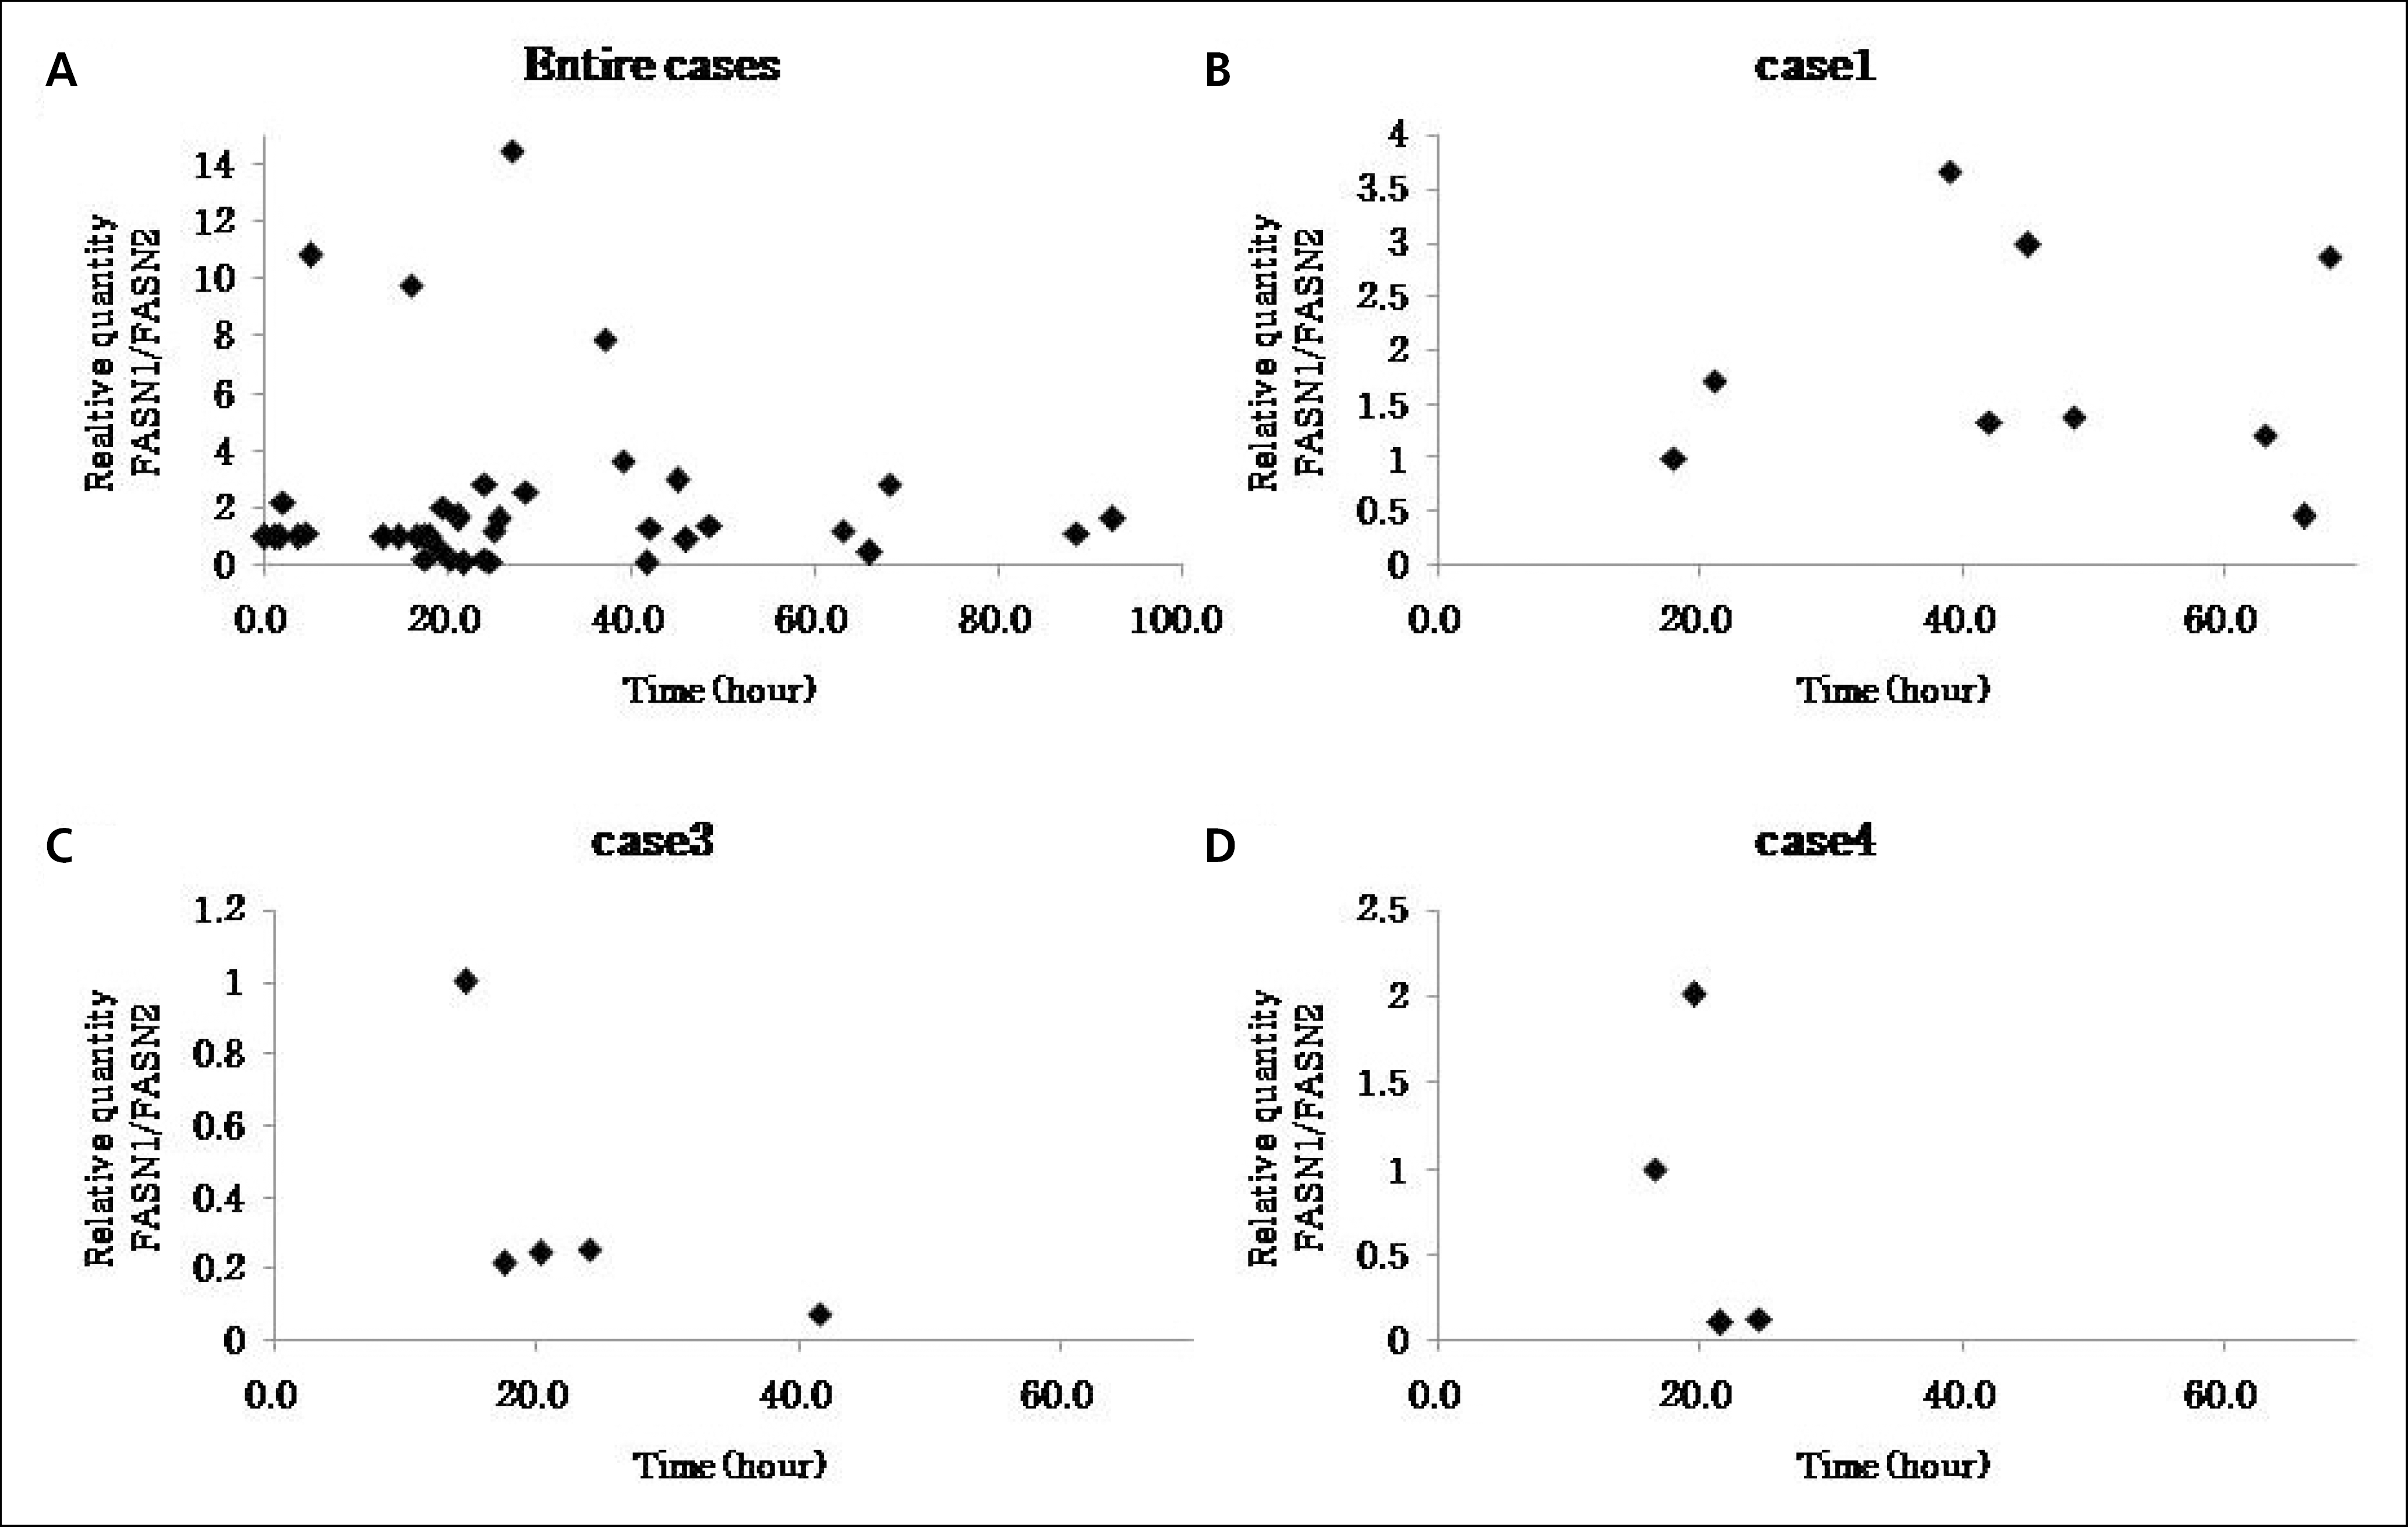 | Fig. 4.These graphs show the relative quantifications of FASN1 along elapsed time (calibrator: FASN2). |
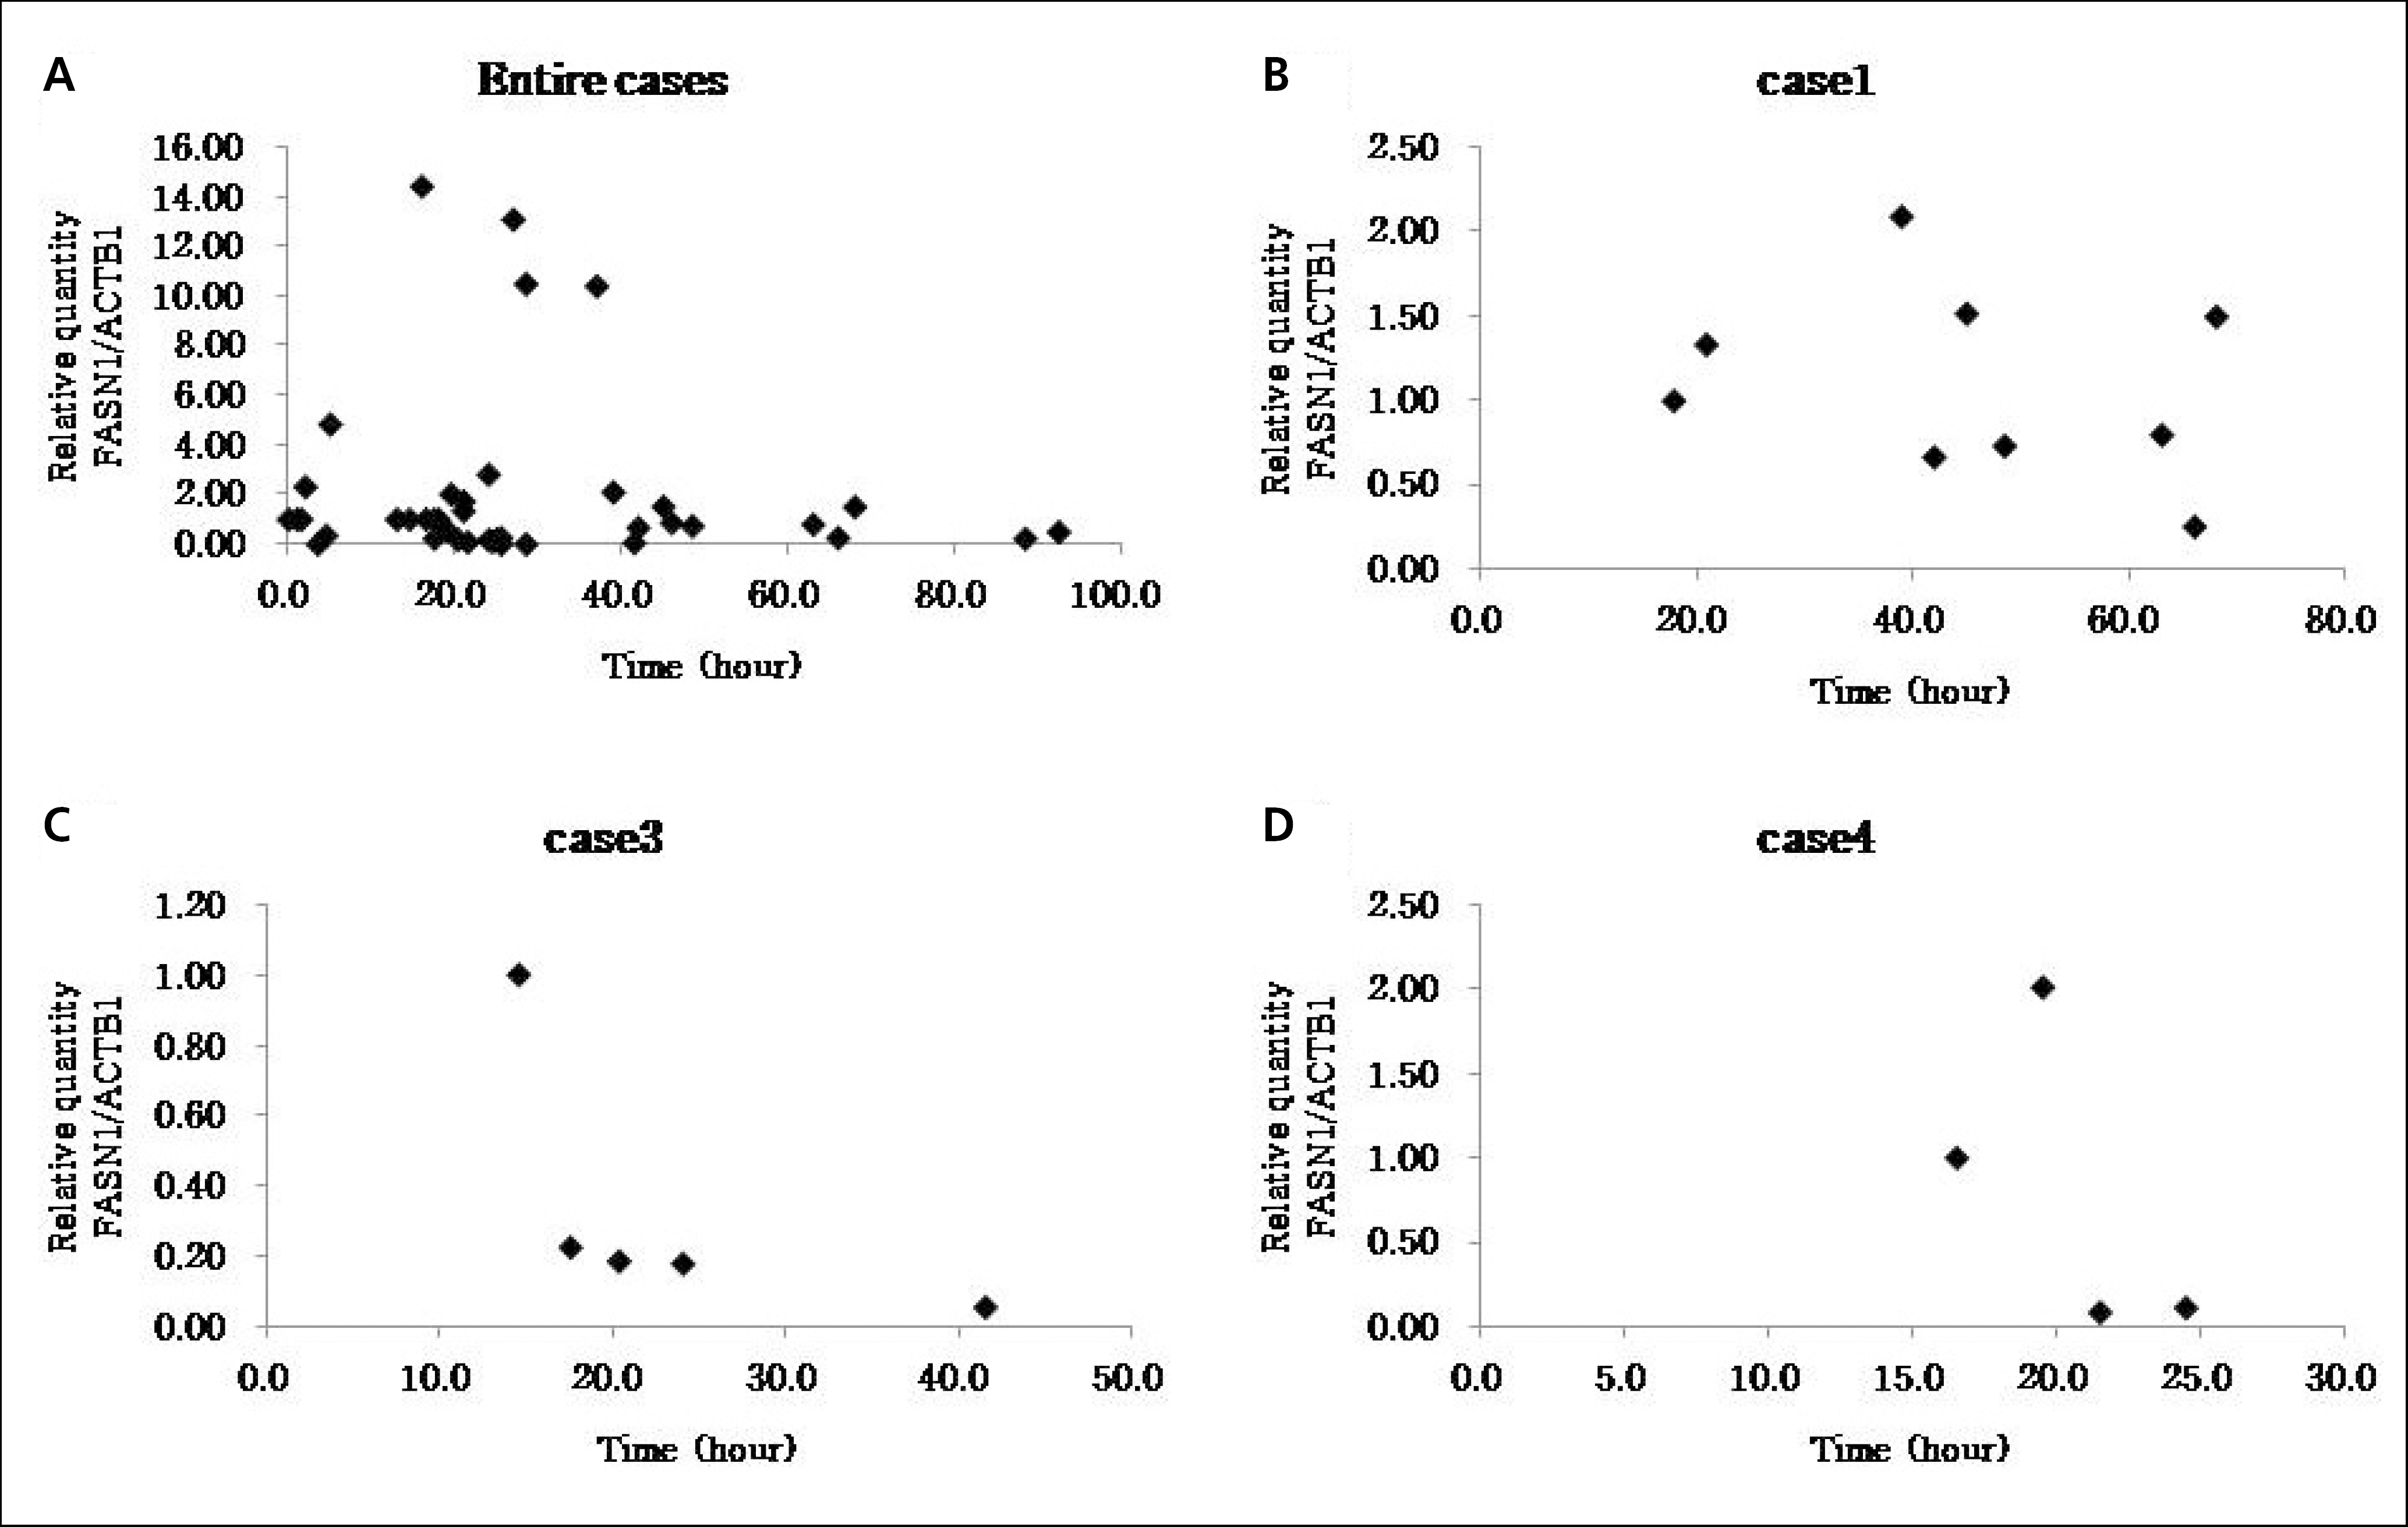 | Fig. 5.These graphs show relative quantifications of FASN1 along elapsed time (calibrator: ACTB1). |
Table1.
Specification of the Genes Tested in the Present Study
| Symbol | Name | Function | Localization |
|---|---|---|---|
| ACTB | Actin, beta | Cytoskeletal structural protein | 07p22 |
| FASN | Fatty acid synthase | Enzyme for long-chain saturated fatty acids synthesis | 17q25 |
Table 2.
Primer and Probe Sequences
| Sequence Name | Primer Sequence | Probe Sequence | Size |
|---|---|---|---|
| FASN1* | 5’-CTCATCCGCTCGTTGTACCAG-3’ | FAM�-CCGGAGTGGCCCCT-NFQ | 300bp |
| 5’-GCTGGGATCTCAGGGTTGG-3’ | |||
| FASN2 | 5’-GGTCTTGAGAGATGGCTTGCTG-3’ | FAM-TTCCAGGACGTCTGCA-NFQ | 195bp |
| 5’-TTGGCAAAGCCGTAGTTGCT-3’ | |||
| ACTB1� | 5’-CAGATCATGTTTGAGACCTTCAACA-3’ | FAM-TCCTCACCGAGCGCG-NFQ | 346bp |
| 5’-GTGGCCATCTCTTGCTCGAA-3’ | |||
| ACTB2 | 5’-ATCCACGAAACTACCTTCAACTCC-3’ | FAM-TGGCATTGCCGACAGG-NFQ | 177bp |
| 5’-AAGGAGCAATGATCTTGATCTTCAT-3’ |
Table 3.
Ct Values of each RNA Segment and Relative Quantification by the Ct Method


 PDF
PDF ePub
ePub Citation
 Print
Print


 XML Download